
 ?Mathematical formulae have been encoded as MathML and are displayed in this HTML version using MathJax in order to improve their display. Uncheck the box to turn MathJax off. This feature requires Javascript. Click on a formula to zoom.
ABSTRACT
The concerns have been raised about the potential for overfitting, which means that the correlation can predict the data used to develop the correlation well, but lacks in predictive capability on other data not used in the development of the correlation. In developing the CHF correlations to avoid overfitting problem when validation data are not enough or has a meaningless range, currently, it has been suggested that the database for a CHF correlation should be divided into a training data-set and a validation data-set. The systematic process to develop CHF correlation with cross-validation technique and to yield 95/95 DNBR values was developed to estimate quantitatively the risk of its overfitting on the resulting DNBR limit of CHF correlation. The repeated hold-out method out of cross-validation techniques was applied to the example CHF correlation (KCE-1M) by running 1000 random-sampling trials of CHF database with training (75%) and validation (25%) data-set. The effect of cross-validation technique on determination of the DNBR limit was estimated less than 3% at 95% probability with 95% confidence. Also, it was verified that DNBR limit of CHF correlation with cross-validation was more conservative to be applicable to the thermal-hydraulic design than that without cross-validation.
1. Introduction
The critical heat flux (CHF) correlation is an important tool related to the thermal performance in developing the nuclear fuel for the pressurized water reactor. The PLUS7™ fuel and HIPER16 ™ fuel were developed by KEPCO NF (Korea Electric Power Corporation Nuclear Fuel) and the CHF tests to develop CHF correlation for its fuels were performed at HTRF (Heat Transfer Research Facility) of Columbia University in USA and OMEGA-2 loop of CEA(Commissariat à l'énergie atomique et aux énergies alternatives) in FRANCE, respectively. KEPCO NF has developed KCE-1M CHF correlation using HTRF CHF data for PLUS7™ fuel and using OMEGA-2 CHF data for HIPER16™ fuel.
Generally, when a CHF correlation is developed from all the available data and then validated on the same set of data, this validation process uses all the available data but suffers problems of overfitting [Citation1]. Best practices to avoid overfitting in fitting CHF correlations have suggested that a given CHF test database be divided into a training data-set and a validation data-set. Then, correlation coefficients are fitted using the larger training data-set and independently are validated against the smaller validation data-set to ensure a consistent behavior of the correlation. This process helps to assess whether the correlation lacks in predictive capability on data not used in the development of the correlation [Citation1].
There are typical techniques such as hold-out cross validation, k-fold cross validation, and leave-one-out cross-validation to develop the correlation as training data-set and to validate the correlations as validation data-set, when splitting the available data into training data-set and validation data-set [Citation1]. The concept for cross-validation was created in the 1930s, in which a part of the sample was used for regression and the other part for prediction [Citation2]. The first cross-validation proposed by Mosteller and Tukey [Citation3] is similar to current version of k-fold cross-validation. Stone [Citation4] and Geisser [Citation5] employed cross-validation as tools for selecting optimal model parameters, as opposed to using cross-validation purely for estimating model performance. Kohavi [Citation6] recommended the best method to use for model selection is 10-fold stratified cross-validation on a variety of real-world data-sets with differing characteristics. Salzberg [Citation7] proposed the use of k-fold cross-validation followed by appropriate hypothesis test rather than directly comparing the average accuracy. Efron and Tibshirani [Citation8] showed that the prediction error and the true misclassification error are estimated using bootstrap. The empirical evidence has been presented that bootstrap estimator has more competition than cross-validation, when the sample size is small because it has low variance [Citation9]. Kim [Citation10] estimated classification error rate comparing with repeated hold-out, repeated k-fold, and bootstrap method and showed that there were many factors to be considered in the choice of the best error estimator.
The classical and simple method to reduce the overfitting problem is cross-validation technique. It is widely accepted rather than bootstrap in data mining and machine learning community, and serves as a standard procedure for performance estimation and model selection [Citation10]. The training and validation data-sets in the repeated hold-out method may cross over in successive rounds so that each data point has a chance of being validated against. Also, its effect can prevent validation data-set from being intentionally put aside [Citation11].
Many methods to resolve the overfitting problem have been developed as mentioned earlier. But, the application of the repeated hold-out method to develop CHF correlation and systematic process to determine DNBR limit has not been done so far.
Our study has two following objectives:
| (1) | To develop a systematic process that integrates the procedure to fit the CHF correlation with repetitive cross-validation technique and the procedure to yield 95/95 (at 95% probability with 95% confidence level) DNBR values using statistics logic and then finally to determine DNBR limit | ||||
| (2) | To evaluate quantitatively the risk of overfitting with 95/95 DNBR limit using the process developed | ||||
The process is performed systematically using a free software, R programming (available at http://www.r-project.org/). The procedure to split data-set into training data-set and validation data-set and to fit coefficients of CHF correlation using the training data-set will be described in Section 2.1. The statistical procedure to yield the 95/95 DNBR value during every repetition will be described in Section 2.2. To demonstrate the developed process, the results of the example applying this process to KCE-1M CHF correlation are investigated in Section 3.
2. Description of process
2.1. Procedure to fit correlation with cross-validation
Three-way split hold-out method has training, validation, and test data. When the best correlation (or model) is not completed, hold-out method using three-way split can be used. Three-way split is 50% for training data-set and 25% each for validation data-set and test data-set. Training and validation may be iterated a few times till a best correlation is found. The final correlation is assessed using the test data-set. After assessing the final correlation with the test data, model must not be further tuned [Citation12–Citation14]. Our study does not include the process to find the best correlation using three-way split because KCE-1M CHF correlation has the same formula type (nonlinear) and variables as CE-1 CHF correlation which has been already identified as the best correlation [Citation15]. If the hold-out method with repetition is used, it is appropriate to use two-way split [Citation10]. Thus, our repeated hold-out method has two-way split to perform the procedure to fit correlation with cross-validation and to determine the final DNBR limit.
represents the flowchart to optimize CHF correlation with N times (or rounds) repetitive cross-validation technique. The flowchart is explained as following steps:
| (1) | Functional type to optimize CHF correlation should be fixed. The information (test geometry and CHF location/inlet temperature/inlet mass flux/pressure/measured CHF when CHF occurred) from CHF test is arranged for initial database set. Full DB (DastaBase) by RUNID (CHF test run identification number) is defined as the values of local variables at all nodes calculated from THALES subchannel code [Citation16] regardless of CHF location at condition of CHF occurrence. | ||||
| (2) | Initial DB set is divided into training (or development) data-set and validation (or test) data-set at specific ratio (generally 75% for training data-set and 25% for validation data-set) by random sampling. Initial DB is defined as the collection of the values of local variables from only the location where CHF occurred, using THALES subchannel code. Also, RUNID of Full DB is equally divided so that it is one-to-one correspondence with the Initial DB RUNID already divided. | ||||
| (3) | Coefficients of CHF correlation are fitted with only training data-set out of the divided Initial DB. Then, coefficients of similar function type in correlation are recommended as initial coefficients, which could be zero. | ||||
| (4) | M/P values by RUNID are calculated by reading the training Full DB with newly fitted coefficients. | ||||
| (5) | The maximum M/P values from calculated M/P values at all nodes are extracted by RUNID. | ||||
| (6) | M/P's average and standard deviation by RUNID are calculated from the maximum M/P values collected. The iteration continues from step 4 to step 6, until the statistics of M/P values in the previous iterative step are equal to those in the current step. If the convergence fails, the fitting to converge coefficients is performed with the maximum M/P values in step 6. | ||||
| (7) | The validation Full DB divided in step 2 is read with the converged coefficients. Then, the maximum M/P values out of calculated M/P values at all nodes are extracted by RUNID. Also, the statistics of validation data-set are calculated. | ||||
Figure 1. Flowchart to optimize CHF correlation with cross-validation technique.
When fitting the coefficients of CHF correlation without repetition, only one round step 1–step 7 is needed. The step 2–step 7 should be performed repeatedly N rounds to apply to the repeated hold-out method. The repeated k-fold cross-validation as well as repeated hold-out method can be applicable to this procedure.
2.2. Statistical procedure to yield 95/95 DNBR values
During repetition mentioned in Section 2.1, the training and validation data-set's statistics are collected every round, which consist of average, standard deviation of M/P, and normality test results. Also, statistics results include variance homogeneity, average homogeneity, and non-parametric Wilcoxon–Mann–Whitney test statistics between the two groups (training data-set and validation data-set). The 95/95 DNBR value every round is very much dependent on the situation in which the statistical relationship between the two groups lies. The logics to yield the statistics and 95/95 DNBR values every round are shown as tree structure in .
Figure 2. Statistical procedure to yield 95/95 DNBR values.
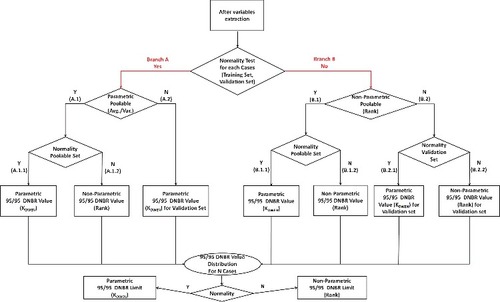
First, normality tests are performed for each of training data-set and validation data-set every round. If both training data-set and validation data-set for each normality test are satisfied, the arrow goes down to left-side (Branch A) in . If at least one group out of the two groups for each normality test is not satisfied, the arrow goes down to right-side (Branch B) in .
So, the criterion on following Branch A and Branch B is categorized depending on whether normality test's results for each of the two groups (training data-set and validation data-set) are satisfied or not.
2.2.1. Branch A. Satisfaction of normality test for two groups
Branch A is divided into sub-branch A.1 and A.2 depending on whether the two groups are homogeneous using parametric test or not, where they have normal distribution. The F-test is used to assess the homogeneity of variance between the two groups and the T-test is used to assess the homogeneity of average. If both the results of F-test and T-test are satisfied, Branch A goes to sub-branch A.1 (‘Poolable’) and if not so, it goes to sub-branch A.2 (‘Non-Poolable’).
A.1 If two groups have homogeneous variance and average, two groups are treated as ‘Poolable.’.
‘Poolable’ means that the two groups can be combined as training data-set plus validation data-set. The normality test for ‘Poolable’ group should be performed since ‘Poolable’ is not guaranteed to satisfy the normality. Depending on whether ‘Poolable’ group satisfies normality or not, Branch A.1 is again divided into A.1.1 and A.1.2.
A.1.1 If the result of normality test for ‘Poolable’ group is ‘pass,’ the upper one-sided 95/95 tolerance limit can be determined using the concept of Owen's factor [Citation17], which is dependent on the number of data as definition shown in the nomenclature. The upper one-sided 95/95 tolerance limit can be defined as 95/95 DNBR value to apply to thermal-hydraulic design.
A.1.2 If the result of normality test for ‘Poolable’ group is ‘fail,’ then M/P values of ‘Poolable’ group are sorted in descending order so that the mth largest M/P value is selected. The ‘mth’ dependent on the number of data for ‘Poolable’ group can be searched in one-sided 95/95 non-parametric tolerance limit table [Citation18]. The inverse of mth largest M/P value is 95/95 DNBR value.
Thus, this 95/95 DNBR value of ‘Poolable’ group from branch A.1 is determined depending on whether ‘Poolable’ group satisfies (A.1.1) the normality test or not (A.1.2).
A.2 If two groups do not have homogeneous variance and average, two groups are treated as ‘Non-Poolable’.
‘Non-Poolable’ means that the two groups cannot be combined as ‘Poolable’ parametrically. In this case, DNBR value should be determined with only ‘Validation dataset’. Because the normality of ‘Validation dataset’ group is satisfied, 95/95 DNBR value can be determined as mean and standard deviation for ‘Validation dataset’ group using Owen's factor according to the number of data for ‘Validation dataset’ group.
2.2.2. Branch B. Dissatisfaction of normality test for two groups
Branch B is divided into sub-branch B.1 and B.2 depending on whether the two groups have homogeneous variance and average. Since at least one of the two groups has non-normal distribution, non-parametric test such as Wilcoxon–Mann–Whitney test should be performed. If the result of Wilcoxon–Mann–Whitney test is satisfied, Branch B goes to sub-branch B.1 (‘Poolable’) and if not so, it goes to sub-branch B.2 (‘Non-Poolable’).
B.1 If two groups have homogeneous variance and average, two groups are treated as ‘Poolable’.
‘Poolable’ from branch B means that the two groups can be combined non-parametrically as training data-set plus validation data-set. Since this non-parametric ‘Poolable’ may be not guaranteed to satisfy the normality, the normality test for ‘Poolable’ group should be performed again. Depending on whether ‘Poolable’ group satisfies normality or not, Branch B.1 is again divided into sub-branches B.1.1 and B.1.2.
B.1.1 If the result of normality test for this non-parametric ‘Poolable’ group is ‘pass,’ 95/95 DNBR value can be determined as mean and standard deviation for ‘Poolable’ group using Owen's factor according to the number of data for ‘Poolable’ group.
B.1.2 If the result of normality test for this non-parametric ‘Poolable’ group is ‘fail,’ then M/P values of ‘Poolable’ group are sorted in descending order so that the mth largest M/P value is selected. The ‘mth’ dependent on the number of data for this non-parametric ‘Poolable’ group can be searched in one-sided 95/95 non-parametric tolerance limit table. The inverse of mth largest M/P value is 95/95 DNBR value.
B.2 If two groups do not have homogeneous variance and average, two groups are treated as ‘Non-Poolable’.
This ‘Non-Poolable’ from branch B means that the two groups cannot be combined as ‘Poolable’ and only validation data-set can be evaluated. Since this validation data-set may be not guaranteed to satisfy the normality, the normality test for validation data-set should be performed again. Depending on whether validation data-set satisfies normality or not, Branch B.2 is again divided into sub-branches B.2.1 and B.2.2.
B.2.1 If the result of normality test for validation data-set is ‘pass,’ 95/95 DNBR value can be determined as mean and standard deviation for validation data-set using Owen's factor according to the number of data for ‘Poolable’ group.
B.2.2 If the result of normality test for validation data-set is ‘fail,’ then M/P values of validation data-set are sorted in descending order so that the mth largest M/P value is selected. The ‘mth’ dependent on the number of data for validation data-set can be searched in one-sided 95/95 non-parametric tolerance limit table. The inverse of mth largest M/P value is 95/95 DNBR value.
The 95/95 DNBR value yields through statistical procedure of Branch A and B. If repetition of N rounds is performed, N 95/95 DNBR values are collected and distributed. To determine the final DNBR limit out of N 95/95 DNBR values, it is important that the distribution of N 95/95 DNBR values is normal or not. If N 95/95 DNBR values are distributed normally, final DNBR limit can be determined as mean and standard deviation of N DNBR value using Owen's factor according to the number of repetition. If they are not so, N 95/95 DNBR values are sorted in descending order so that the mth largest 95/95 DNBR value is selected and then leads to final 95/95 DNBR limit.
The distribution of N 95/95 DNBR values can be classified into five categories with the following meanings:
‘Training’: the data-set that are used in fitting CHF correlation's coefficient
‘Validation’: the data-set that are not used in developing CHF correlation
‘Poolable (T+V)’: ‘Training’ and ‘Validation’ are poolable through parametric test (T-test) or non-parametric test (Wilcoxon–Mann–Whitney test) for the corresponding distribution characteristics, normal or non-normal.
‘Non-poolable (V)’: when poolability of ‘Training’ and ‘Validation’ failed, statistics for 95/95 DNBR value are calculated with only the validation data-set.
‘Combined (T+V and V)’: ‘Poolable (T+V)’ and ‘Non-poolable (V)’ are combined.
The reason to classify the 95/95 DNBR values extracted from every round into the five groups is to figure out that to which the 95/95 DNBR values are bounded and from which final 95/95 DNBR limit yields. It also has purpose to figure out what proportion of the five classifications is distributed.
3. Example of application
To demonstrate our systematic process to determine DNBR limit of CHF correlation with repetitive cross-validation technique, KCE-1M CHF correlation developed by KEPCO NF was selected as an example. KCE-1Mall (‘all’ subscript means all available data) CHF correlation used all available data without repetitive cross-validation technique to determine the coefficients. It was concerned about the potential for ‘overfitting,’ which indicated that all available CHF data points in the database were used in the regression analysis to optimize the KCE-1Mall CHF correlation coefficients and no data points were set aside to perform an independent validation of the correlation. The total number of data to develop and validate KCE-1M CHF correlation is 260 data points, which is enough to avoid high variance. It was generally known that error estimates of cross-validation cause high variance, when the sample size is small [Citation9].
It was investigated how the quantitative risk of overfitting with final 95/95 DNBR limit was included by applying repetitive cross-validation technique to develop KCE-1M CHF correlation.
Repeated hold-out method as the simplest kind out of cross-validation techniques was used for 1000 times (or rounds) with random sampling by splitting as a fixed ratio of training data-set and validation data-set, 75% and 25%, respectively. If split ratio for KCE-1M correlation is 80% for training and 20% for validation, the number of validation for 20% is 52 data points. The number of data, 52, cannot be searched in one-sided non-parametric tolerance limit table [Citation18]. Its table is available when the number of data is 60 data points or more at 95 probability with confidence 95%. The total number of data of KCE-1M correlation was 260 data points and 75%:25% is the largest (one-fourth) split ratio available due to the limitation of the number of validation data-set. If the total number of data used in developing correlation is more than 600 data points, it is available to use 90%:10% (one-tenth) split ratio recommended as best estimator ratio [Citation6].
The results of sensitivity analysis according to data-set split ratio except for 80:20 and 90:10 are shown in . The sensitivity results are presented as the final 95/95 DNBR limit determined through our process. The sensitivity results are nearly independent on the data split ratio since the deviation between 1.158 and 1.157 is less than about 0.1%.
Table 1. Sensitivity results for data-set split ratio
It was known that 200 times of the number of repetition provide an estimate that is very close to population parameter for linear regression [Citation19], but our study used 1000 times as the repetition number due to more complex non-linear regression for CHF correlation. It is verified that sensitivity beyond 1000 times of repetition is within 0.01% in DNBR limit. The results of sensitivity analysis according to the number of repetition are shown in .
Figure 3. Comparison results with repeated k-fold cross-validation technique and sensitivity check on the number of repetition.
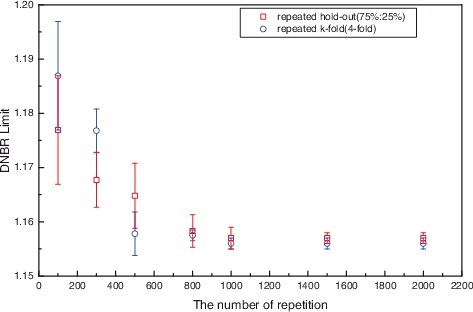
Meanwhile, k-fold cross-validation in which all data can be used for training and validation data-set is recommended as the best cross-validation technique [Citation6]. To demonstrate the quantitative comparison with other cross-validation techniques, 95/95 DNBR limits for both repeated hold-out method (75%:25% split ratio) and repeated k-fold method (four-fold) are shown in . Both cross-validation techniques yield similar results beyond 1000 repetition point except for near the smaller number of repetition. There is some probability that DNBR limit near smaller number of repetition could be explained by random effects so that error bars are 95% confidence intervals for the mean by repeating 50 times at each repetition point. As shown in , the larger the number of repetition, the smaller the standard deviation. If both methods have sufficient repetitions with random sampling, either of two methods can be used to yield 95/95 DNBR limit by using our process. So, the simpler repeated hold-out method out of the two methods is selected and it is emphasized that neither of the two methods can be concluded as performing better.
shows the statistics of M/Ps for 1000 cases extracted from every round for five classifications. The average of averaged M/Ps for 1000 cases is approximately 1.0 and about 96% cases are belongs to ‘Poolable’ classification. Standard deviation (SD) of averaged M/Ps for ‘Non-poolable’ classification is about 10 times larger than that of ‘Poolable’ classification because correlation was not fitted using these data.
Table 2. Statistics of M/Ps for 1000 cases for five classifications
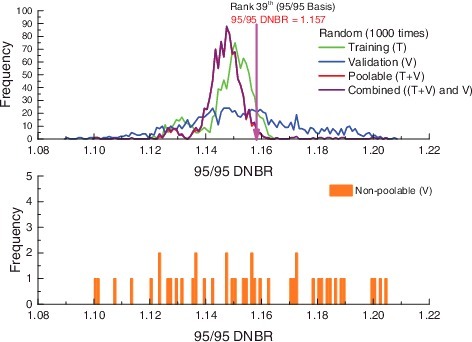
shows the statistics of 95/95 DNBR values for 1000 cases extracted from every round for five classifications. The average of 95/95 DNBR values for ‘Non-poolable’ is 1.1549, the largest among the five classifications. The average of 95/95 DNBR values for ‘Combined’ is 1.1469. The idea of determining the final DNBR limit out of 1000 DNBR values at 95% probability with 95% confidence will be found in Somerville's table [Citation18], which provided one-sided non-parametric tolerance limit. This table at 95% probability with 95% confidence has the 39th largest order among 1000 cases. When this tolerance based on the rank in our example study is applied, the 39th largest 95/95 DNBR value is 1.157 and belongs to ‘Poolable’ classification.
Table 3. Statistics of DNBR values for 1000 cases for five classifications
shows M/P statistics of the 39th largest case out of 95/95 DNBR values for 1000 cases. Average M/P and standard deviation for training data-set (193 data points) are similar to those compared to KCE-1Mall correlation. The 39th rank 95/95 DNBR value, 1.157 is determined by the statistics logic mentioned in Section 2.2. The training data-set and validation data-set for the 39th rank have result of ‘pass’ and ‘fail’ through normality test, respectively, as shown in . Though either the training data-set or validation data-set did not satisfy the normality test, these two groups are considered the same population by non-parametric Wilcoxon–Mann–Whitney test as shown in . So, 1.157 of DNBR value was determined using non-parametric tolerance limit table. Because these two groups are ‘Poolable,’ the number of data combining training data-set and validation data-set is 260 (=193 + 67), where the rank order for 260 data is 7th in Somerville's table. The 95/95 DNBR limit for fitting with 100% data for KCE-1Mall correlation is 1.128, which is calculated by Owen's factor because its M/P values have normal distribution. The difference(=(1.157−1.128)/1.128) of DNBR limit with cross-validation (KCE-1M) and that without cross-validation (KCE-1Mall) in is less than 3%, which is reflected by effect of cross-validation. The effect of cross-validation is to avoid overfitting and simultaneously to be estimated conservatively for safety analysis.
Table 4. M/P statistics of 39th rank out of 1000 DNBR values
Table 5. Results of the poolablity 39th rank out of 1000 DNBR values
shows the average M/P distribution of five classifications for . Average M/Ps for five classifications are well distributed. But, the average M/Ps for ‘Non-poolable’ classification are separated around 0.99 and/or 1.03. This distribution is a natural one because the data are not included in the fitting of correlation.
Figure 4. Average M/Ps distribution for 1000 cases for five classifications.
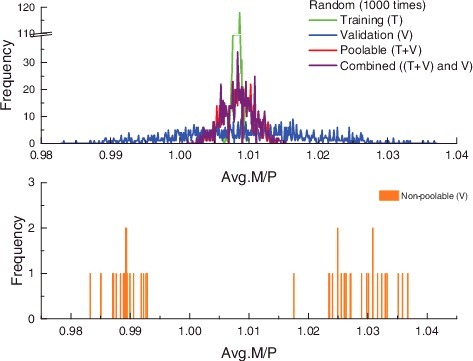
shows the distribution of 95/95 DNBR values for 1000 cases belonging to five classifications for . However, 95/95 DNBR values for ‘Non-poolable’ classification are distributed continuously, unlike separate distribution for the average M/Ps of . The reason is that 95/95 DNBR values are determined by the combination of the average M/P, its standard deviation, and Owen's factor or free-distribution rank. Since ‘Poolable’ classification occupies about 96% in the number of total cases, its graph looks superimposed on ‘Combined’ classification.
Figure 5. Distribution of 95/95 DNBR values for 1000 cases for five classifications.
shows poolability check and normality test results between the training data-set and validation data-set of the 39th largest case out of 95/95 DNBR values for 1000 cases. Because either training data-set or validation data-set does not pass the normality test, non-parametric Wilcoxon–Mann–Whitney test between the two groups is performed and its result is satisfied. The level of significance of the tests is selected to be 0.05. So, the 39th largest case is classified as ‘Combined’. This table is the basis for important statistical logic to follow the procedure shown in to determine 95/95 DNBR limit.
shows range of variables for the 39th largest case out of 95/95 DNBR values for 1000 cases. Variable ranges for training data-set and validation data-set are similar to each other and to those of KCE-1Mall correlation.
Table 6. Range of variables for 39th rank out of 1000 DNBR values
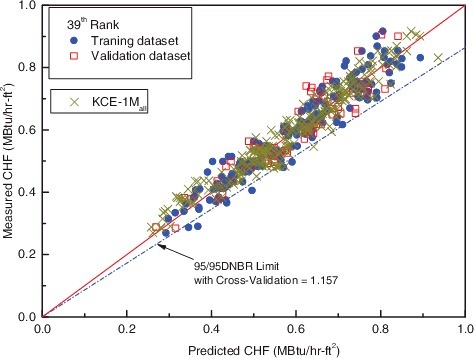
The relation between measured and predicted CHF of the training data-set and that of validation data-set is similar, as shown in . There is no inherent difference in M/P distributions with respect to those of the KCE-1Mall CHF correlation.
Figure 6. Comparison of predicted CHF and measured CHF.
4. Conclusion
The systematic process to fit CHF correlation with cross-validation technique and to yield 95/95 DNBR value with statistical logic and then to determine DNBR limit to apply to thermal-hydraulic design was described. This developed process with cross-validation technique is more effective under the limitation that validation data are independently insufficient including the reason by meaningless range. The DNBR limit of KCE-1M CHF correlation fitted by applying our process was compared to that of KCE-1Mall CHF correlation excluding cross-validation technique. The effect of cross-validation on the 95/95 DNBR limit was estimated 3% less than that of KCE-1Mall CHF correlation using all data. The 3% effect on repetitive cross-validation technique would be reflected in determining DNBR design limit for thermal-hydraulic design. An effective method to prevent the additional risk for distortion of characteristics of CHF data by unexpected errors such as intentional and coincidental errors, except for overfitting problem, could be dared to be repetitive cross-validation technique. In a point of view of DNBR limit, conservatism of KCE-1M CHF correlation using cross-validation to thermal-hydraulic design application could be well quantified. This reliable cross-validation approach will be considered as the best option to the more rigorous method used for CHF prediction in CHF test. This developed process is available to apply with only cross-validation technique, not with bootstrap technique. It can be concluded that both the hold-out method and the repeated k-fold cross-validation with our process yield similar results under consideration that they have sufficient repetition with random sampling. It has been known that the bootstrap technique enhances correlation's prediction performance and helps overfitting problem not to occur easily. In developing of CHF correlation using data from future CHF test, the developed process will be applied to thermal-hydraulic design. Further study for the error estimation rate between cross-validation techniques and bootstrap technique will be essential.
| Nomenclature | ||
| Avg. | = | Average |
| DNBR | = | Departure from Nucleate Boiling Ratio |
| KCE-1M | = | CHF Correlation fitted using cross-validation technique |
| KCE-1Mall | = | CHF Correlation fitted using all data without cross-validation technique |
| KOwen | = | Owen's factor to express one-sided upper tolerance limit |
| = | mean of sample data |
| n | = | the number of sample data |
| M/P | = | Measured critical heat flux/predicted critical heat flux |
| N | = | The number of repetition by random sampling |
| S.D. | = | Standard Deviation |
| T | = | Training |
| V | = | Validation |
Acknowledgments
The authors wish to thank Manager Chae Joon Lim for the helpful comments to prepare this study.
This work was supported by KEPCO Nuclear Fuel Co., Ltd. 's Internal Project (Development to Thermal-Hydraulic Acceptance Criteria for Fuel Development/Assessment, grant number: 12192), and authors would like to appreciate this support.
Disclosure statement
No potential conflict of interest was reported by the authors.
Additional information
Funding
Related Research Data
References
- Piepel GF, Cuta JM. Statistical concepts and technique for developing, evaluating, and validating CHF correlations and corresponding fuel design limits. Washington (DC): Pacific Northwest Laboratories; 1993. ( SKI Technical Report; no. 93–46).
- Larson S. The shrinkage of the coefficient of multiple correlation. J Educat Psychol. 1931;22(1):45–55.
- Mosteller F, Tukey JW. Data analysis and regression: a second course in statistics. Reading (MA): Addison-Wesley; 1968.
- Stone M. Cross-validatory choice and assessment of statistical predictions. J R Stat Soc. 1974;36(2):111–147.
- Geisser S. The predictive sample reuse method with application. J Am Stat Assoc. 1975;70(350):320–328.
- Kohavi R. A study of cross-validation and bootstrap for accuracy estimation and model selection. IJCAI’95 Proceedings of the 14th International Joint Conference on Artificial Intelligence; 1995 Aug 20–25; Montreal, QC, Canada.
- Salzberg S. On comparing classifiers: pitfalls to avoid and a recommended approach. Data Min Knowl Discov. 1997;1(3):317–328.
- Efron B, Tibshirani R. Improvements on cross-validation: the .632+ bootstrap method. J Am Stat Assoc. 1997;92:548–560.
- Efron B. Estimating the error rate of a prediction rule: improvement on cross-validation. J Am Stat Assoc. 1983;78:316–331.
- Kim JH. Estimating classification error rate: repeated cross-validation, repeated hold-out and bootstrap. Comput Stat Data Anal. 2009;53:3735–3745.
- Refaeilzadeh P, Tang L, Liu H. Cross-validation. Encyclopedia of database systems. Springer; 2009. p. 532–538.
- Hastie T, Tibshirani R, Friedman J. The elements of statistical learning: data mining, inference, and prediction. 2nd ed. New York (NY): Springer; 2016.
- Gutierrez-Osuna R. Pattern analysis for machine olfaction: a review. IEEE Sens J. 2002;2(3);189–202.
- Raschka S, Mirjalili V. Python machine learning. 2nd ed. Birmingham (UK): Packt Publishing; 2017.
- Tong LS, Tang YS. Boiling heat transfer and two-phase flow. 2nd ed. London (UK): Taylor & Francis; 1997.
- Nahm KY, Lim JS, Chun CK, et al. Development status of THALES code. Development status of THALES code. Transactions of the Korean Nuclear Society Autumn Meeting; 2008 Oct 30–31; Pyeongchang, Korea.
- Owen DB. Factors for one-sided tolerance limits and for variable sampling plans. Monograph no. SCR-607. Washington (DC): Sandia Corporation; 1963.
- Somerville PN. Table for obtaining non-parametric tolerance limits.Ann Math Stat. 1958;29(2):599–601.
- Lewis-Beck MS. Applied regression: an introduction. 1st ed. New York (NY): Sage Publication; 1980.
- Gutierrez DD. Machine learning and data science: An introduction to statistical learning method with R. 1st ed. Basking Ridge (NJ): Technics Publications; 2015.