
ABSTRACT
The Fukushima Daiichi Nuclear Power Station (FDNPS), operated by Tokyo Electric Power Company Holdings, Inc., went into meltdown in the aftermath of a large tsunami caused by the Great East Japan Earthquake of 11 March 2011. The measurement of radiation distribution inside the FDNPS buildings is indispensable to execute decommissioning tasks in the reactor buildings. We conducted a radiation imaging experiment inside the turbine building of Unit 3 of the FDNPS by using a compact Compton camera and succeeded in visualizing high-dose contamination (up to 3.5 mSv/h). In addition, we drew a three-dimensional radiation distribution map inside the turbine building by integrating the radiation image resulting from the Compton camera into the point cloud data of the experimental environment acquired using a scanning LRF. The radiation distribution map shows the positions of these contaminations on a real space image of the turbine building. The radiation distribution map helps workers to easily recognize radioactive contamination and to decrease their own exposure to radiation because the contamination cannot be observed with the naked eye.
1. Introduction
A large amount of radioactive substances was spread over a large area as a result of the Fukushima Daiichi Nuclear Power Station (FDNPS) accident that occurred on 11 March 2011 owing to a large tsunami caused by the Great East Japan Earthquake. Decommissioning tasks inside and outside the reactor buildings are underway.
Radiation-distribution measurements inside the FDNPS buildings are essential for performing decommissioning tasks in the reactor buildings. Especially, drawing a radiation-distribution map, which indicates the distribution condition of radioactive substances inside the buildings, is extremely important to predict risk to workers and to decrease the amount of radiation exposure. Such a map would help workers to easily recognize the positions and shapes of radioactive contamination in their work environment. In addition, information about the distribution of radioactivity would be effective for formulating detailed decontamination plans. Therefore, improvement of radiation-measurement methods for drawing the radiation-distribution map is important.
The main source of radioactive contamination inside the FDNPS building is radioactive cesium. Gamma surveys are being conducted using handheld survey meters, but it is concerned that the measurement using the survey meters takes long time to get the information about the contamination level at the wide area, and locally existing hotspots are overlooked. Moreover, the radiation exposure inside the buildings to the workers during the survey is a critical issue.
Here, the combination of a gamma-ray imager and remote equipment is useful for remotely measuring radioactive contamination over the wide area or in high dose-rate environments, such as those inside the FDNPS buildings, which workers are prohibited from entering. Gamma-ray imagers are powerful devices for measuring the distribution of radioactive contamination for wide area inside the field of view (FOV). Especially, a Compton camera uses the kinematics of Compton scattering to estimate the direction of the gamma rays incident on the sensor without using pinhole collimators unlike pinhole cameras. Because heavy collimators are not used, the size and weight of this sensor are lower than those of pinhole cameras, and are useful for installing remote equipment such as an unmanned aerial vehicle (UAV). Attempts to remotely measure radioactive substances by using Compton cameras mounted on UAVs, such as an unmanned helicopter or a multicopter-type drone, have been made by several teams of researchers, including our team [Citation1–Citation3]. Radiation-distribution maps of the outdoor environment were obtained by using Compton cameras mounted on UAVs.
In addition, inside the FDNPS buildings, three-dimensional (3D) identification of the position of radioactive substances is necessary to draw a detailed radiation-distribution map because the radioactive contamination has spread to the ceiling, walls, and many building structures as well as to the ground floor.
Vetter et al. [Citation4] reported a method of superimposing radiation images measured using a gamma-ray imager on a 3D model of the measurement area prepared using Microsoft Kinect to visualize the radiation sources on a 3D real space image. The Microsoft Kinect sensor provides both RGB images and dense 3D point cloud data of the scenes. Another useful way to construct a 3D model of the working environment is to use a laser range finder (LRF) system. A pulsed laser is used to scan the objects and scenes and obtain 3D point cloud data of the working environment. The range of measurement of LRF is over several tens of meters, which is wider than the 4–6-m range of Microsoft Kinect. In addition, LRF can be used to perform measurements in the dark inside the FDNPS buildings because it employs laser scanning.
In the present work, we conducted a new experiment for measuring radiation distribution by using a compact Compton camera inside the turbine building of Unit 3 in the FDNPS. We succeeded in visualizing hotspots by using the Compton camera and in drawing a radiation-distribution map of the experimental environment by integrating the radiation image with the point cloud data of the experimental environment, which were measured using a scanning LRF. The usability of the radiation distribution map is discussed as well.
2. Radiation imaging inside FDNPS buildings
Previously, a joint team from Waseda University and Hamamatsu Photonics K.K. developed a handheld Compton camera [Citation5,Citation6]. We fabricated a lightweight compact Compton camera to measure the distribution of radioactive contamination inside the FDNPS buildings based on the technology developed by the above team. The details of our Compton camera can be found in [Citation2]. The gamma-ray sensors employ a Ce-doped GAGG (Gd3Al2Ga3O12) scintillator coupled with a multipixel photon counter (MPPC; Hamamatsu Photonics K.K.) [Citation7,Citation8]. The scintillator has a 15 × 15 pixel array, and the sizes of each pixel in the scatterer and the absorber are 1.5 mm × 1.5 mm × 5 mm and 1.5 mm × 1.5 mm × 10 mm, respectively. The distance between the two gamma-ray sensors is 23.5 mm. The Compton camera weighs less than 1.0 kg. We have confirmed in the outdoor environment that the Compton camera can visualize 30–55 µSv/h hotspots in the surrounding dose rate of 10–15 μSv/h [Citation2].
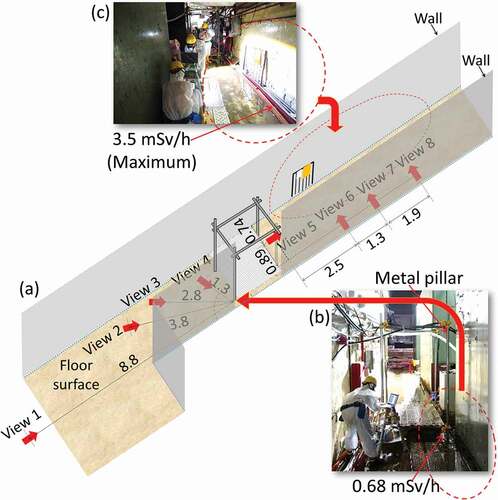
We conducted a radiation imaging experiment by using the compact Compton camera inside the turbine building of Unit 3 in the FDNPS. ) shows a schematic diagram of the passageway in the experimental environment. The arrows denote the installation locations of the Compton camera, that is, measurement points for radiation imaging. The direction of the arrows shows the center of the FOV of the Compton camera. Photographs of the measurement area are shown in . The Compton camera was fixed at a height of about 60 cm from the floor surface. Lead shielding with a thickness of 1 cm was installed on the top and bottom, left and right, and back of the gamma-ray sensor of the Compton camera.
Figure 1. (a) Schematic of experimental environment. Arrows show the installation locations of the Compton camera for radiation imaging. The direction of the arrows shows the center of the FOV of the Compton camera. The unit of length values is m, and the error in the values is less than 10%. The photographs in panels (b) and (c) show the hotspot locations. The values of dose rate in the photographs were measured using a handheld survey meter.
shows representative measurement results obtained through radiation imaging using the Compton camera at the locations shown in . The measurement time for image reconstruction was 39.5 s for each panel in . The panels on the left show the photographs captured using the optical camera in the Compton camera at each measurement point. The panels on the right show the results of radiation imaging. Here the intensity described in the color bar represents the degree of overlap of the Compton cones. We can find radioactive substances at the point of intersection of the Compton cones. In the measurement, the event data used for image reconstruction were selected to observe the contamination due to 137Cs, which emits 662-keV gamma rays, because the main source of radioactive contamination inside the FDNPS buildings is 137Cs. The selected energies were set to 625 keV ≤ Es + Ea ≤ 725 keV and 10 keV ≤ Es ≤ 165 keV, where Es and Ea are the energy depositions in the scatterer and absorber, respectively.
Figure 2. Measurement results of radiation imaging using Compton camera. The installation locations of the Compton camera are displayed above each panel (see )). Left and right panels show the photographs captured using the optical camera of the Compton camera and the reconstructed radiation image measured at each measuring point. The measurement time was 39.5 s for each panel.
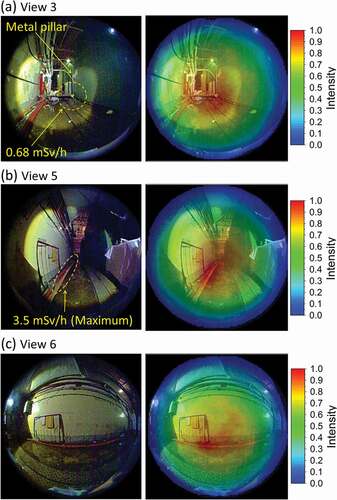
Regarding the measurement results at the location shown in ), strong contamination was detected near the foot of one metal pillar, as shown in ). Here, a dose rate of approximately 0.68 mSv/h was observed near the foot of the metal pillar by using a handheld survey meter. By contrast, the dose rate around the hotspot was several hundreds of µSv/h. The Compton camera successfully detected the high-dose-rate region (hotspot) compared to the surrounding regions.
Additionally, we succeeded in visualizing strong contamination in measurement area shown in ). The measurement result showed contamination near the hose extending to the floor surface, as shown in ). The handheld survey meter showed dose rates of up to 3.5 mSv/h on the surface of the hose. A similar result was obtained by means of 10 s measurement, in which case, too, the high-intensity image appeared on the hose. Measurements from the side, too, clearly detected the contamination near the hose, as shown in ). Incidentally, the dose rates at a height of 1 m in the regions surrounding the 3.5 mSv/h hotspot were 0.4–0.5 mSv/h. The Compton camera clearly visualized the hotspot.
Here, the hose was used for transferring the water retained in the condenser of the turbine building of Unit 3. Conceivably, the contaminated water remaining in the hose or any radioactive cesium adhered to the inner surfaces of the hose is the cause of the high dose rate (Tokyo Electric Power Company Holdings, Inc., private communication).
In the experiment, the Compton camera succeeded in visualizing the hotspots inside the turbine building of Unit 3 in the FDNPS within a short measurement time. These visualization results are consistent with the results of measurements made using handheld survey meters.
3. Drawing radiation-distribution map
We attempted to draw the 3D radiation-distribution map of the inside of the turbine building by using the measurement data of the Compton camera.
First, we acquired point cloud data of the passageway by using the scanning LRF (Hokuyo Automatic Co., Ltd.: YVT-X002) (see )). All point data have 3D coordinate information indicating the actual size of the measurement area. We created a model of the passageway in the 3D virtual space on a computer.
Figure 3. (a) Point cloud data of experimental environment acquired using scanning LRF. Combined metal pipes can be seen. (b,c) Radiation distribution map prepared by superimposing radiation image and point cloud data. In panels (b) and (c), the viewpoints are different.
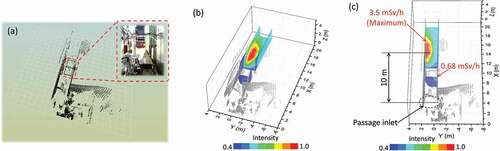
Then, the installation points of the Compton camera were placed in the virtual space. The positional relationship of each installation point was measured with an analog ruler and a laser measure, as shown in ). The unit of length values in the figure is m, and the values have an error of less than 10%. The positional relationship between the passageway and the installation point of the Compton camera, that is, distance from the wall, was measured as well.
The Compton cones measured at each installation point were drawn on the floor surface and wall surface of the passageway in the virtual space to create the 3D radiation distribution map, as shown in . These figures show the same radiation distribution map, but their viewpoints are different; once the distribution map is constructed, it is possible to observe the contamination distribution from an arbitrary viewpoint. The positions of the radioactive contaminations can be visualized easily. By using the point cloud data, an additional advantage is that discussion considering building information becomes possible. For example, in the radiation distribution map prepared in this study, it is possible to visually recognize the strong contamination at about 10 m from the passage inlet.
4. Conclusion
We succeeded in detecting the high-dose contamination (up to 3.5 mSv/h) inside the turbine building of Unit 3 of the FDNPS by using the compact Compton camera. In addition, we drew a 3D radiation distribution map by integrating the measured radiation image with the Compton camera into the point cloud data of the experimental environment measured using the scanning LRF. By using the radiation-distribution map, workers can work while recognizing the hotspot, which leads to reduction of radiation dose. Since many hotspots with high dose rates as described above exist inside the FDNPS buildings, visualization of these hotspots is effective for grasping the situation inside the building. Furthermore, by using the robot such as UAVs, workers will be able to obtain information on hotspots without entering the building.
In the future, we aim to estimate the radioactivity of radioactive substances by using the Compton camera and estimate the dose rate of the working area by using radioactivity information. In the experiment conducted herein, the existence of the hotspots was found using a color contour map showing the degree of overlap of the Compton cones. However, the contour map does not correspond to the radioactivity of the radioactive substances in the measurement area.
First, a weakness of the Compton camera is that it draws a circular arc (a part of a Compton cone) in a space where radioactive material does not actually exist. In addition, even if the radioactive substances have the same radioactivity, the number of gamma rays detected by the Compton camera decreases with increasing distance between the Compton camera and the radioactive substances. The intensities of the reconstructed images on the color contour map become weak as well. Moreover, in the measurements from multiple viewpoints, it is important to understand the degree to which the FOV of the Compton camera overlaps with the contaminated area. When the radioactive substance is measured redundantly from multiple viewpoints, the intensity of the reconstructed image is naturally increased.
Thus, it is necessary to correct a Compton cone drawn in a space in which a radioactive substance does not actually exist. In addition, corrections for the different distances toward the radioactive substances and the area of overlap of the FOV of the Compton camera are necessary to evaluate the radioactivity of radioactive substances and dose rate quantitatively, and these aims will be achieved in the future.
Acknowledgments
The authors wish to acknowledge engineers of Tokyo Electric Power Company Holdings, Inc., for supporting the experiment inside the turbine building of Unit 3 of the FDNPS. The authors also wish to acknowledge K. Minemoto of Visible Information Center, Inc. for supporting the development of the 3D reconstruction of the radiation image and Prof. J. Kataoka and A. Kishimoto of Waseda University, S. Nakamura and M. Hirayanagi of Hamamatsu Photonics K.K. for development of base technologies of the compact Compton camera. This research was partly supported by a grant-in-aid under the Fukushima innovation coast initiative.
Disclosure statement
No potential conflict of interest was reported by the authors.
Additional information
Funding
Related Research Data
References
- Jiang J, Shimazoe K, Nakamura Y, et al. A prototype of aerial radiation monitoring system using an unmanned helicopter mounting a GAGG scintillator Compton camera. J Nucl Sci Technol. 2016;53:1067–1075.
- Sato Y, Ozawa S, Terasaka Y, et al. Remote radiation imaging system using a compact gamma-ray imager mounted on a multicopter drone. J Nucl Sci Technol. 2018;55:90–96.
- Mochizuki S, Kataoka J, Tagawa L, et al. First demonstration of aerial gamma-ray imaging using drone for prompt radiation survey in Fukushima. JINST. 2017;12:P11014.
- Vetter K, Barnowksi R, Haefner A, et al. Gamma-Ray imaging for nuclear security and safety: towards 3-D gamma-ray vision. Nucl Instrum Methods A. 2018;878:159–168.
- Kataoka J, Kishimoto A, Nishiyama T, et al. Handy Compton camera using 3D position-sensitive scintillators coupled with large-area monolithic MPPC arrays. Nucl Instrum Methods A. 2013;732:403–407.
- Kishimoto A, Kataoka J, Nishiyama T, et al. Performance and field tests of a handheld Compton camera using 3-D position sensitive scintillators coupled to multi-pixel photon counter arrays. JINST. 2014;9:P11025.
- Iwanowska J, Swiderski L, Szczesniak T, et al. Performance of cerium-doped Gd3Al2Ga3O12 (GAGG:Ce) scintillator in gamma-ray spectrometry. Nucl Instrum Methods A. 2013;712:34–40.
- Hamamatsu Photonics K.K. Opto-semiconductor handbook. Hamamatsu, Japan: Hamamatsu Photonics K.K, Solid State Division; 2014. Chapter 3.