
 ?Mathematical formulae have been encoded as MathML and are displayed in this HTML version using MathJax in order to improve their display. Uncheck the box to turn MathJax off. This feature requires Javascript. Click on a formula to zoom.
ABSTRACT
We investigate the distribution of alloying elements in irradiated Zr alloys with different Fe contents using atom probe tomography. Our results showed dense nanoscale regions (clusters) of Fe formed in the matrix. The average diameter of the Fe clusters in alloy with a high Fe content increased under a higher neutron fluence. Conversely, the number density of Fe clusters remained similar in all the Zr alloy specimens. Energy-dispersive X-ray spectrometry showed that the maximum cluster size depended on the Fe content in the secondary phase particles. Fe clusters gathered along the basal plane of the Zr alloys at high fluence, indicating that irradiation defects influence Fe clustering. The solute concentration of Fe was estimated to be approximately 0.1 at%, which is the Fe concentration in the matrix exclusive of Fe clusters.
1. Introduction
The alloying elements Sn, Fe, Cr, and Ni improve the corrosion resistance of Zr alloys used for fuel cladding in BWRs. Because Fe, Cr, and Ni have low solubility in a Zr matrix, two kinds of secondary phase particles (SPPs), namely Zr(Fe,Cr)2 and Zr2(Fe,Ni), form in Zr alloys after fabrication. The SPP size is controlled during the fabrication process to obtain an optimum SPP size for corrosion resistance, which is considered to be 0.1–0.2 µm [Citation1]. Under neutron irradiation, the alloying elements in SPPs become dissolved in the matrix and smaller SPPs eventually disappear at high burnup [Citation2,Citation3]. The oxidation and hydrogen content in the Zr alloys also increases. Previously, a Zr alloy modified with a higher Fe content than that of Zircaloy-2 showed better resistance to hydrogen absorption at high burnup in a BWR [Citation4–Citation6], indicating that Fe is a key element for improving resistance to hydrogen absorption.
We have been investigating the distribution of Fe atoms in a Zr alloy matrix by atom probe tomography (APT) to understand the mechanism of hydrogen absorption at high burnup. No Fe atoms were detected in the matrix of unirradiated Zircaloy-2 specimens [Citation7]. Conversely, dense nanoscale regions of Fe atoms (Fe clusters) were observed in the irradiated Zircaloy-2 specimens [Citation8]. This result implies that the number density and diameter of the Fe clusters increase under a higher neutron fluence. However, the effects of the Fe content and its behavior at higher neutron fluences have yet to be investigated. In this study, we investigated the atomic distribution of the alloying elements in irradiated Zr alloys with different Fe contents. Moreover, correlation between the Fe distribution and irradiation defects was explored by comparing results from APT and transmission electron microscope (TEM) observations.
2. Experimental procedure
2.1. Materials
The Zr alloys used in this study were Zircaloy-2 and Zircaloy-2 with added Fe. The original chemical compositions of the ingots are listed in . Each ingot featured a different Fe content and the alloyed specimens are referred to as H(high)-Fe Zry, M(middle)-Fe Zry, and L(low)-Fe Zry. The H-Fe Zry and M-Fe Zry specimens were taken from a portion of the tube specimens used for the corrosion test. The tube specimens were 60 mm in length and irradiated in dummy neutron source holders located outside the channel box of a commercial BWR [Citation4,Citation5]. Nuclear fuels were not contained in the tube specimens. The inner and outer surfaces of the tube specimen were exposed to water in the BWR. The maximum fast-neutron fluence was 15 × 1025/m2 (E > 1 MeV) and the irradiation temperature was approximately 283°C [Citation4–Citation6]. The as-fabricated specimens and those irradiated for two, four, and six irradiation cycles were cut from the tube specimens. Both the inner and outer surfaces were mechanically and chemically polished. Hence, the analysis area for APT was the intermediate portion between the inner and outer surfaces.
Table 1. Chemical composition of Zr alloy ingots
The corrosion behavior and microstructural features of H-Fe Zry and M-Fe Zry have been previously reported by Takagawa et al. [Citation6]. The oxide thickness and hydrogen pickup fraction in H-Fe Zry were approximately 50% smaller than those of in the M-Fe Zry after six irradiation cycles. SPPs were observed in H-Fe Zry but were not found in M-Fe-Zry after six irradiation cycles. Here, L-Fe Zry corresponds to the previously investigated Zircaloy-2 specimen [Citation8], taken from a portion of a fuel rod irradiated in another commercial BWR. The cladding tube was defueled and three fluence regions were cut. The maximum fast-neutron fluence was 6 × 1025/m2 (E > 1 MeV) and the burn-up was estimated to be 69 GWd/t. The corrosion behavior was not estimated. Disk samples of 3 mm ø were fabricated for microstructural analysis from the intermediate portion between the inner and outer surfaces. The analysis area of the L-Fe Zry was the same as that for the H-Fe Zry and M-Fe Zry specimens.
2.2. Examination of microstructure
The samples for APT and TEM experiments were fabricated by a focused ion beam (FIB) instrument (Hitachi SMI-3050SE). Laser-assisted APT was performed with the use of a CAMECA LEAP 3000X-Si. Mass spectra of the samples were acquired at 20 K, with a laser energy of 2.0 nJ and a pulse frequency of 250 kHz. The IVAS 3.6.6 software (CAMECA) was used to reconstruct three-dimensional atom maps and analyze clusters. Nanoscale clusters were identified by the maximum separation method [Citation9] with Fe and Cr selected as cluster core atoms. Cluster candidates were detected from the maximum distance between the core atoms, dmax = 1.5 nm, and the minimum number of core atoms, Nmin = 6 atoms. Any candidate that contained more than 100 atoms was defined as a cluster. Most of the clusters detected by this process were also observed visually [Citation7]. The cluster size was estimated from the Guinier diameter (DG), which is defined as
where Rg is the radius of gyration of a cluster. Namely, the Guinier diameter is obtained by assuming that the clusters are solid spheres.
3. Results
3.1. Mass spectrum in Zr matrix
Mass spectra in the matrix of the H-Fe Zry before and after two irradiation cycle are shown in . Zr was detected as Zr, ZrH, ZrC, and ZrO. Hydrogen, oxygen, and carbon were present as impurities in the Zr alloys or derived from atmospheric contamination. We included ZrH, ZrC, and ZrO in our consideration of the Zr content. Sn peaks were observed at 56–62 m/z. The peak of Al at 27 m/z is a typical impurity in Zr alloys, which was also detected in the unirradiated Zircaloy-2 [Citation7]. Peaks from Cr, Fe, and Ni appeared at 25–32 and 50–64 m/z. Notably, the major 56Fe+ peak overlapped with the 96Zr16O2+ and 112Sn2+ peaks, and the major 58,60Ni+ peaks overlapped with the 116,120Sn2+ peaks. The major 52Cr+ peak was located on the long Zr tail. Therefore, the Cr atomic mapping results contained background noise from the Zr tail. The Ga peaks at 69 and 71 m/z derived from the FIB process.
Figure 1. Mass spectra of the matrix of H-Fe Zry before and after irradiation.
Before irradiation, Cr, Fe, and Ni peaks were not observed in the matrix. The peaks at 56, 58, and 60 m/z consisted of Sn (and ZrO), which were estimated from the relationship between the natural abundance and the intensities of Zr and Sn. Thus, there were no Fe and Ni present. After two irradiation cycles, the 56Fe2+ peak clearly appeared at 28 m/z and the intensity at 56 m/z increased. Thus, dissolution of Fe was confirmed. According to the relationship between the natural abundance and intensities of Zr and Sn, the intensity of the 56 m/z peak consisted of 87% Fe, 7% ZrO, and 6% Sn. Thus, the Fe atom map includes a contribution of approximately 10% from the distributions of ZrO and Sn. However, in the Fe clusters, the intensity of the 56 m/z peak indicated a content of more than 99% Fe. Hence, the effect of ZrO and Sn on the cluster analysis was negligible.
In terms of the unknown peaks at 49–52 m/z, the peak shape was broad and the position was slightly shifted to the right (i.e. higher mass-to-charge ratio). The unknown peaks at 64–66.7 m/z were not identified in the Zr alloy elements. Therefore, these unknown peaks were not considered in this study.
3.2. Atomic distribution in Zr matrix
Atom maps for the H-Fe Zry and M-Fe Zry before irradiation are shown in and , respectively. Sn was distributed homogenously within the matrix and other alloying elements were not detected. Note that the apparent Cr content in the matrix is noise corresponding to the tail of the Zr spectrum in . The SPPs of Zr(Fe,Cr)2 and Zr2(Fe,Ni) were observed in the atom maps. Their chemical compositions are shown in . The Fe content in the Zr(Fe,Cr)2 SPP of H-Fe Zry was higher than that of the SPP in M-Fe Zry. Si was concentrated in the Zr2(Fe,Ni) SPP and the ratio of Zr:(Fe + Ni + Si) was 2:1. This ratio was in good agreement with previous results for Zircaloy-2 [Citation7]. Fe or Ni atoms could be substituted for Si atoms.
Table 2. Chemical composition of SPPs
Figure 2. Distribution of alloying element atoms in H-Fe Zry before irradiation.
Figure 3. Distribution of alloying element atoms in (a) matrix and (b) Zr(Fe,Cr)2 and Zr2(Fe,Ni) phases of M-Fe Zry before irradiation.
After two irradiation cycles, Fe atoms were already dissolved in the matrix. The atom maps for the H-Fe Zry and M-Fe Zry specimens are shown in and , respectively. Fe atoms formed Fe clusters in the matrix. The Sn distribution was heterogenous and the locations of the Sn-poor regions corresponded with those of the Fe-rich regions. In contrast, Fe and Sn were concentrated at grain boundaries in a similar manner to that observed for the H-Fe Zry specimen (). Two types of SPPs were observed in the M-Fe Zry () and their chemical compositions are shown in . In , the lower SPP was Zr(Fe,Cr)2 in which Fe atoms were almost completely dissolved and the upper SPP was likely Zr3Si containing small amounts of Fe and Ni. The Zr3Si SPP was previously observed in the H-Fe Zry and M-Fe Zry after six irradiation cycles [Citation6]. Cr was slightly concentrated and formed Fe–Cr clusters around the grain boundaries and the Zr(Fe,Cr)2 SPPs.
Figure 4. Distribution of alloying element atoms in H-Fe Zry after two irradiation cycles.
Figure 5. Distribution of alloying element atoms in M-Fe Zry after two irradiation cycles.
The APT measurements of the H-Fe Zry after four irradiation cycles revealed Zr(Fe,Cr)2 and Zr2(Fe,Ni) SPPs, as shown in . Fe–Cr clusters were observed around the Zr(Fe,Cr)2 SPP; these Fe–Cr clusters were distributed in the plane of the matrix. The Fe clusters without Cr atoms were distributed separately from the Zr(Fe,Cr)2 SPP, as seen in the central area of . Fe atoms in the Zr(Fe,Cr)2 SPP were almost completely dissolved, as shown in . Conversely, the composition of the Zr2(Fe,Ni) SPP maintained a Zr:(Fe + Ni + Si) ratio of 2:1; therefore, Fe, Ni, and Si remained undissolved. The atom maps for the M-Fe Zry after four irradiation cycles are shown in . Fe clusters were observed in the matrix, Fe and Sn were concentrated at grain boundaries, and Fe–Cr clusters were observed around grain boundaries. Ni and Si were not detected.
Figure 6. Distribution of alloying element atoms in H-Fe Zry after four irradiation cycles.
Figure 7. Distribution of alloying element atoms in M-Fe Zry after four irradiation cycles.
A dark-field TEM image of the APT specimen of H-Fe Zry after six irradiation cycles is shown in . The ‘corduroy’ contrast observed in the matrix was attributed to contrast from <a> loops arranged in the basal plane of zirconium [Citation10]. The atom maps for the area marked with a rectangle in are shown in . Fe clusters were arranged on a plane and Cr was also concentrated with Fe in the vicinity of a Z r(Fe,Cr)2 SPP. This plane corresponded to the dark part of the corduroy contrast. A concentration profile of Fe and Cr across the plane of the Fe–Cr clusters is shown in . Areas rich in Fe and Cr appeared periodically every few dozen nanometers. Sundell et al. previously reported the same planar distribution of Fe–Cr clusters in a high burnup Zircaloy-2 cladding [Citation11]. The concentration of Fe in the Zr(Fe,Cr)2 SPP was almost the same in the specimens subjected to four and six irradiation cycles (). The Zr(Fe,Cr)2 SPP contained small quantities of Ni and Si. The atom maps for the M-Fe Zry after six irradiation cycles are shown in . A linear distribution of Fe–Cr clusters was observed in the upper area of the atom map. Conversely, Cr was hardly detected in Fe clusters at the lower area. The Zr(Fe,Cr)2 SPP was located near the upper position of the atom map.
Figure 8. (a) Dark-field TEM image of the APT specimen of H-Fe Zry after six irradiation cycles. (b) Distribution of alloying element atoms in the rectangular region of (a). (c) Concentration profile of Fe and Cr across the length of the cylinder in the Fe map of (b).
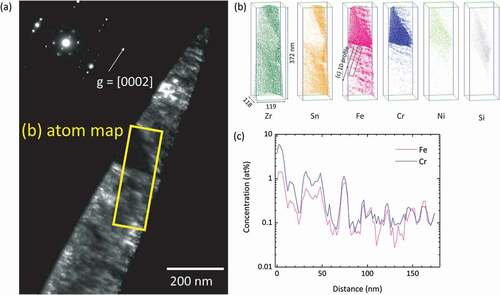
Figure 9. Distribution of alloying element atoms in M-Fe Zry after six irradiation cycles.
3.3. Cluster analysis
Fe and Fe–Cr clusters were detected with the use of the maximum separation method [Citation9]. The average DG, or cluster size, increased with increasing neutron fluence, as shown in . We found no influence of the Fe content on cluster size at fluences up to 6 × 1025/m2, which is the maximum fluence for L-Fe Zry. The cluster sizes in the H-Fe Zry and M-Fe Zry after four irradiation cycles were also similar. After six irradiation cycles, the cluster sizes increased in H-Fe Zry but did not change in M-Fe Zry. The number density of the clusters is shown in as a function of neutron fluence. No notable differences were found between the specimens. The number density increased with fluence up to four irradiation cycles and tended to a constant value of approximately (3 ± 2) × 1023/m3 between four and six irradiation cycles.
Figure 10. Average Guinier diameter (DG) of clusters in the matrix as a function of neutron fluence. Error bars show the standard error.
Figure 11. Number density of clusters in the matrix as a function of neutron fluence.
shows the solute concentration of Fe, which was estimated as the concentration of Fe in the matrix exclusive of clusters. Fe was already dissolved in the matrix at a low fluence of 0.3 × 1025/m2 and increased to 0.1 at% above 2 × 1025/m2. Excess Fe atoms likely formed Fe clusters or concentrated at grain boundaries.
Figure 12. Concentration of Fe in the matrix, excluding Fe (and Cr) clusters, as a function of neutron fluence.
4. Discussion
The formation of Fe and Fe–Cr clusters has been observed in irradiated specimens from three different BWRs, including those found in this study and two previous studies [Citation8,Citation11]. Together, these results suggest that the formation of Fe and Fe–Cr clusters is a general phenomenon occurring in Zr alloys irradiated in a BWR. A comparison between TEM images and APT atom maps () reveals that the planarly arranged Fe clusters corresponded to the corduroy contrast caused by aligned <a> loops. Thus, we concluded that Fe clusters were formed in or around <a> loops, although a detailed Fe distribution was not observed in this study because of insufficient spatial resolution of APT. Fe clusters were widely distributed in the matrix. In contrast, Fe–Cr clusters were observed only along grain boundaries and around Zr(Fe,Cr)2 SPPs. The strain field around grain boundaries and SPPs would attract dissolved Cr atoms [Citation11].
The number density of Fe and Fe–Cr clusters increased with increasing fluence up to four irradiation cycles. Thereafter, the number density remained at an almost constant value of (3 ± 2) × 1023/m3. The same APT cluster analysis was performed on a high-burnup Zircaloy-2 cladding [Citation11]. A previous study reported that the number densities of Fe and Fe–Cr clusters were of the same order of magnitude; however, their actual values were a little higher than those of our results, possibly because of differences in their analysis parameters. The number density of <a> loops saturated at a low fluence, 2–4 × 10²²/m3 [Citation12], which is one order of magnitude smaller than the number densities of Fe and Fe–Cr clusters. However, the minimum DG of the clusters was 1.3 nm in our analysis and the minimum diameter of the <a> loop was 2 nm [Citation12]. Furthermore, because the mean size of Fe and Fe–Cr clusters was smaller than that of the <a> loops, several clusters might be crowded at a single <a> loop. Thus, if Fe and Fe–Cr clusters form at <a> loops, their number density will depend on that of the <a> loops.
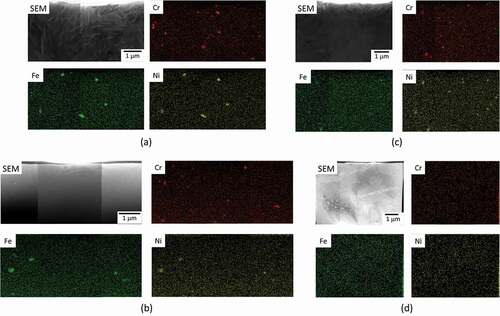
Fe was almost completely dissolved from the SPPs after six irradiation cycles [Citation6]. The amount of Fe dissolution was estimated to be greater in H-Fe Zry than in M-Fe Zry. Our APT results revealed the following dissolution behaviors of Fe under neutron irradiation: formation of Fe clusters, Fe concentration at grain boundaries, and Fe solid-solution into the matrix. For this dissolution behavior, we confirmed a notable difference in the cluster size (). We concluded that the number of Fe atoms attracted to <a> loops increased with increasing Fe dissolution because the clustering sites were limited to <a> loops. shows elemental maps of the H-Fe Zry and M-Fe Zry obtained by energy-dispersive X-ray spectrometry. Zr2(Fe,Ni) SPPs contained Fe in the H-Fe Zry after six irradiation cycles. In contrast, a small amount of Fe was detected in Zr2(Fe,Ni) SPPs in M-Fe Zry after four irradiation cycles. Fe dissolution was minimal in M-Fe Zry between four and six irradiation cycles. Consequently, the cluster size changed very little.
Figure 13. Summary of EDS elemental maps for Zr alloys: (a) H-Fe Zry after four irradiation cycles, (b) H-Fe Zry after six irradiation cycles, (c) M-Fe Zry after four irradiation cycles, and (d) M-Fe Zry after irradiation cycles.
The solubility of Fe in Zr and Zr alloys has been measured by several methods, and the solubility range is 0.006–0.03 wt% (0.01–0.05 at%) [Citation13–Citation15]. The cluster analysis in this study estimated that the solute concentration of Fe was approximately 0.1 at%. The metastable state of Fe atoms in the radiation field or the interaction of Fe atoms with point defects are considered to be possible reasons for the higher Fe concentration in the matrix.
After six irradiation cycles, the differences in the Fe distribution were confirmed to be in terms of the cluster sizes of H-Fe Zry and M-Fe Zry. The cluster number density and the solubility of Fe were similar. However, the SPPs survived in the H-Fe Zry and almost disappeared in the M-Fe Zry after six irradiation cycles [Citation6]. We assumed that the total volume of clusters and SPPs influenced the hydrogen absorption in the H-Fe Zry and M-Fe Zry after six irradiation cycles. The high-laser energy used in this study prevented analysis of hydrogen distribution by APT; however, our future work will examine alternative ways of determining hydrogen distribution.
5. Conclusion
We examined the atomic distribution in Zr alloys irradiated in a BWR using APT and TEM examinations. Fe dissolved into the matrix from Zr(Fe,Cr)2 SPPs at low fluence and from Zr2(Fe,Ni) SPPs at high fluence. The dissolved Fe formed Fe clusters in the matrix or concentrated at grain boundaries. The Cr in Zr(Fe,Cr)2 SPPs also dissolved into the matrix and formed Fe–Cr clusters around grain boundaries and Zr(Fe,Cr)2 SPPs. These irradiation behaviors were observed in all the Zr alloy specimens, implying that this dissolution is a general phenomenon in Zr alloys irradiated in BWRs. The cluster distribution coincided with the corduroy contrast seen in specimens treated at high fluence. These results indicate that the Fe and Fe–Cr clusters were arranged in or around <a> loops aligned with the basal plane of the Zr alloys. In the specimen with the highest Fe content, the cluster size increased with increasing fluence. Conversely, the Fe content in the Zr alloys did not appear to influence the number density of Fe and Fe–Cr clusters. The number density increased at low fluence and tended to a constant value at high fluence. The solute concentration of Fe in the matrix was estimated to be approximately 0.1 at%. Insoluble Fe formed Fe and Fe–Cr clusters or concentrated at grain boundaries.
Acknowledgments
We would like to thank Global Nuclear Fuel – Japan Co., Ltd. for providing the zirconium alloy samples.
Disclosure statement
No potential conflict of interest was reported by the authors.
References
- Garzarolli F, Schumann R, Steinberg E. Corrosion optimized Zircaloy for Boiling Water Reactor (BWR) fuel elements. In: Zirconium in the nuclear industry: tenth international symposium, ASTM STP 1245; 1994. p. 709–723.
- Rudling P, Wikmark G, Lehtinen B, et al. Impact of second phase particles on BWR Zr-2 corrosion and hydriding performance. In: Zirconium in the Nuclear Industry: Twelfth International Symposium, ASTM STP 1354; 2000. p. 678–706.
- Tägtstrom P, Limbäck M, Dahlbäck M, et al. Effects of hydrogen pickup and second-phase particle dissolution on the in-reactor corrosion performance of BWR claddings. In: Zirconium in the Nuclear Industry: Thirteenth International Symposium, ASTM STP 1423; 2002. p. 96–118.
- Ishimoto S, Kubo T, Kubota O. Development of new Zirconium alloys for higher burnup fuel. Proceedings of ENS TopFuel 2003 Conference; 2003 Mar 16–19; Würyburg (Germany).
- Ishimoto S, Etoh Y, Matsumoto T, et al. Improved Zr alloys for high burnup BWR fuel. Proceedings of ENS TopFuel 2006 Conference; 2006 Oct 22–26; Salamanca (Spain).
- Takagawa Y, Ishimoto S, Etoh Y, et al. The correlation between microstructures and in-BWR corrosion behavior of highly irradiated Zr-based alloys. In: Zirconium in the Nuclear Industry: Fourteenth International Symposium, ASTM STP 1467; 2004. p. 386–403.
- Sawabe T, Sonoda T, Kitajima S, et al. Analysis of atomic distribution in as-fabricated Zircaloy-2 claddings by atom probe tomography under high-energy pulsed laser. J Nucl Mater. 2013 Nov;442:168–174.
- Sawabe T, Sonoda T, Kitajima S. Distribution of alloying elements in irradiated Zircaloy-2 by atom probe tomography and transmission electron microscopy. Proceedings of WRFPM 2014; 2014 Sep 14–17; Sendai (Japan), Paper No. 100139.
- Vaumousse D, Cerezo A, Warren PJ. A procedure for quantification of precipitate microstructures from three-dimensional atom probe data. Ultramicroscopy. 2003 May–Jun;95:215–221.
- Griffiths M. A review of microstructure evolution in zirconium alloys during irradiation. J Nucl Mater. 1988 Oct;159:190–218.
- Sundell G, Thuvander M, Tejland P, et al. Redistribution of alloying elements in Zircaloy-2 after in-reactor exposure. J Nucl Mater. 2014 Nov;454:178–185.
- Northwood DO. Irradiation damage in zirconium and its alloys. At Energy. 1977 Dec;15:547–610.
- Yilmazbayhan A, Delaire O, Motta AT, et al. Determination of the alloying content in the matrix of Zr alloys using synchrotron radiation microprobe X-ray fluorescence. J Nucl Mater. 2003 Sep;321:221–232.
- Kruger RM, Adamson RB, Brenner SS. Effects of microchemistry and precipitate size on nodular corrosion resistance of Zircaloy-2. J Nucl Mater. 1992 Jul;189:193–200.
- Motta AT, Erwin KT, Delaire O, et al. Synchrotron radiation study of second-phase particles and alloying elements in Zirconium alloys. ASTM STP. 2002;1423:59–79.