
 ?Mathematical formulae have been encoded as MathML and are displayed in this HTML version using MathJax in order to improve their display. Uncheck the box to turn MathJax off. This feature requires Javascript. Click on a formula to zoom.
ABSTRACT
Although treatment policies for debris from Fukushima Daiichi Nuclear Power Station have not been decided yet, they may include medium-and long-term debris storage. Dry storage may be desirable in terms of cost and handling, but before implementation, it is necessary to assess hydrogen generation that occurs during storage due to the radiolysis of the water accompanying the debris. Herein, Al2O3, SiO2, ZrO2, UO2, and cement paste pellets were prepared as simulated debris with various porosities and pore size distributions. The weight changes of the wet samples were measured at various drying temperatures (100°C, 200°C, 300°C, and 1000°C) via thermogravimetry under helium gas flow (50 cc/min) or reduced pressure conditions (rate: 200 Pa in 30 min), and the resulting drying curves were evaluated. All ceramic pellets exhibited similar drying characteristics in this experiment, indicating that cold ceramics could be used for predicting the drying behavior of ceramic debris. In compariosn with ceramic pellets, cement paste pellets exhibited different behavior and a longer drying time even under 1000°C. In conclusion, it is necessary to decide a standard level for the dry state of molten core concrete interaction (MCCI) products that accompany concrete.
1. Introduction
On 11 March 2011, the Great East Japan Earthquake triggered a severe nuclear accident in the Fukushima Daiichi Nuclear Power Station (1F). In the mid-and long-term roadmaps toward 1F decommissioning developed by the Ministry of Economy, Trade and Industry (METI) [Citation1], a policy that addresses fuel debris retrieval will be decided in the near future. So, debris management and defueling should be discussed together. Medium- or long-term debris storage is among the several desirable options being considered after defueling from the viewpoint of cost [Citation2]. One such example is the cleanup after the Three Mile Island Unit 2 (TMI-2) accident [Citation3]. While dry storage may be desirable, it would result in hydrogen generation because of the radiolysis of water accompanying the debris during storage. To minimize the amount of this water, drying is considered an effective pretreatment method. Therefore, the drying process and an assessment of hydrogen production are required to prevent hydrogen explosions during dry storage. For the drying process, it is important to understand the drying behaviors of the debris and any residual water. This knowledge will contribute to the design of an appropriate facility and equipment to be used in the drying process. Drying processes for damaged fuels have been studied worldwide [Citation4,Citation5]. However, debris in 1F includes materials that are more complicated, and information on their drying behavior is considerably limited.
There are various forms of debris, for example, dense, porous, and fine debris as well as debris with cracks. The presence of cracks and pores in debris is important when the drying behavior and the amount of residual water present in the debris are evaluated. For example, in the case of porous debris, it is unclear how the water inside the pores evaporates (equilibrium water content). It is also unknown whether the amount of time required by water to dry inside the pores is more than that required by water dry outside the pores when complete drying is possible. Moreover, it is necessary to consider whether complete drying is possible depending on the type of materials. On the contrary, information regarding the drying rate and time is required, but the absolute values of these parameters depend on the water content and the applied heat. Herein, we apply the same water content and heat during each run and compare the drying rates and times. In this manner, we obtain information on whether it is always possible to maintain a high drying speed or whether a long drying time is required at low drying rates. To assess a low drying rate, drying characterizations, such as the time at which the drying rate starts to decrease (critical water content) and the falling rate period with a low drying rate, are evaluated. Finally, the temperature setting and the drying method are the most important parameters for debris drying facility as well as the equipment used in the drying process. Therefore, we determine the effects of the internal conditions of the debris (porosity, pore size, and material) and external conditions (temperature and drying method) using simulated debris to systematically understand the drying behavior of debris through drying characterizations (critical water content, falling rate period, drying rate and time, and equilibrium water content). In fact, an understanding the drying behavior of simulated debris enables us to predict the drying behavior of the actual debris.
2. Drying kinetics for porous materials
When a wet porous solid is heated from an external source, the liquid in the porous solid is lost due to evaporation at the surface during the drying process. The drying of wet sample surfaces proceeds as follows:
Heating of the materials via conduction, convection, and radiation
Heat transfer inside the materials
Water flow and evaporation and vapor diffusion inside the materials
Vapor diffusion and its removal from the material surfaces
presents a drying curve and shows the change in the drying rate (−dw/dt) with the water content (W or mg) due to the weight change of a wet porous solid during evaporation. From the perspective of the changing drying rate, the drying process in the drying curve comprises three periods:
Figure 1. Theory of drying curves.
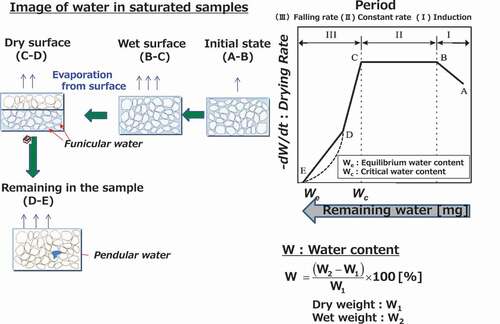
(1) Induction period (Period I in )
In general, because the initial temperature of the materials is lower than that of the heating medium at the start of the drying process, the temperature of the materials increases to become equal to that of the heating medium. Thus, the drying rate increases rapidly (A-B).
(2) Constant period (Period II in )
After the induction period, as long as the surfaces of the samples are covered with water, the temperature of materials remains constant. During this period, the drying rate is constant; therefore, the residual water decreases with the drying time. The heat received by materials from the heating medium is consumed as latent heat and used for the evaporation of water on the surface of the materials. Realizing a constant drying rate depends on the condition of the heating medium and not on the material itself. This period lasts for as long as the evaporation quantity is in equilibrium with the water supply from inside the samples (B-C).
(3) Falling rate period (Period III in )
When water supply from inside a sample becomes less than the water evaporated from the surface of the sample, it is impossible for water to continue covering the entire sample surface. Some parts of the surface on materials are exposed to the heating medium. On the dried parts of the material surface, the heat from the heating medium is consumed as both latent heat for evaporation and sensible heat for samples. As a result, the sample temperature increases, while the drying rate decreases gradually (C-E). Finally, the minimum water content during drying is the equilibrium water content (E) and drying ends at this point. The critical water content is defined as the transition point (C) from the constant-rate period to the falling rate period. The falling rate period is mainly affected by the transportation rate of heat and water inside the samples; hence, the physical forms and compositions of samples may be more important than the condition of the heating medium. It should be noted that the drying curve proceeds from right to left along the horizontal axis. The drying curve is generally recognized as a standard ‘scale’ employed to determine the drying characteristic of various materials [Citation6].
3. Experimental
3.1. Samples
Al2O3, SiO2, ZrO2, UO2, and cement paste pellets (10φ × 10 mm) were prepared as simulated debris with various porosities and pore size distributions to cover a wide range of conditions. The samples’ porosities were almost open porosities because they were adjusted by pore formers that evaporated during their manufacture. Al2O3 and SiO2 pellets were used because their porosity and pore size distribution values can be controlled easily during their manufacture. Moreover, SiO2 is also a component of concrete. ZrO2 and UO2 are the main components of debris [Citation7]. In some cases, the surrounding concrete was mixed with molten core concrete interaction (MCCI) products, which were removed from the concrete basement under the reactor. In particular, it was difficult to completely dry concrete, which was originally in a canister owing to the bound water included in cement when investigating the drying of TMI-2 debris [Citation8,Citation9]. Therefore, the behavior of cement paste, which includes bound water, was investigated during the drying process.
Porosities were measured using the Archimedes’ method, and pore size distributions were obtained through mercury porosimetry, except for UO2 pellets. With respect to the UO2 pellets, the porosities were obtained by subtracting the volume measured using a true density meter (SHIMADZU, AccuPyc 1330) from the volume calculated based on the pellet dimensions. The pore size distributions were obtained from a scanning electron microscopy (SEM) image (KEYENCE, VE-8800).
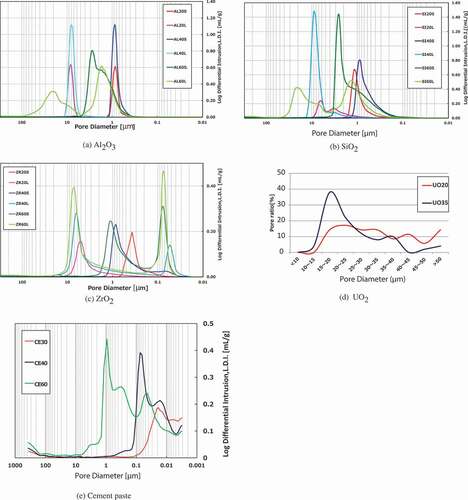
Pictures of the samples are shown in , and the samples’ notations and experimental parameters (porosities: 20–60%; pore size distributions: 0.01–50 μm; temperature: 100–1000°C; atmospheric conditions) are listed in . The selected SEM images of the samples are shown in , and the pore size distributions are shown in .
Table 1. Sample notations and experimental parameters
Figure 2. Appearances of samples.
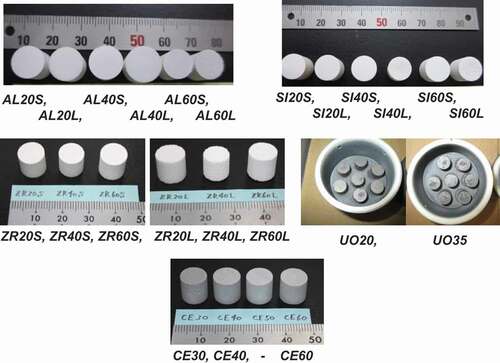
Figure 3. Scanning electron microscopy (SEM) images of samples: (a) AL60L, (b) SI60L, (c) ZR60L, (d) UO35, and (e) CE60.
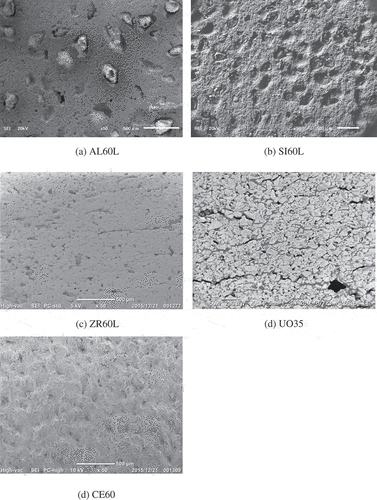
Figure 4. Pore size distributions of (a) Al2O3, (b) SiO2, (c) ZrO2, (d) UO2, and (e) cement paste.
3.2. Procedure
After the samples were dried once, the weight changes of the wet samples due to water evaporation were measured using thermogravimetry, and the drying curves were obtained.
3.2.1. Measurements of dry weights
The ceramics pellets (Al2O3, SiO2, ZrO2, and UO2) were subjected to ultrasonic cleaning using water for the removal of fine raw material, and they were dried at 110°C ± 5°C under −0.08 MPa for 100 min in accordance with the Japanese Industrial Standards (JIS R2205–1992). In contrast, the cement paste pellets were subjected to ultrasonic cleaning using NovecTM 7200(C4F9OC2H5) to prevent hydration. They were then dried at a relative humidity of 11% ± 4% in a container. After drying, the weights of the dried samples (W1) were measured.
3.2.2. Absorption of water
Water was infused into the samples using a vacuum method in accordance with the Japanese Industrial Standards (JIS R2205–1992). After measuring the dry weights of the samples, they were placed into a stainless-steel container, and the pressure in the container was reduced to ~20 kPa for 15 min. Degassed water was injected until the samples were fully immersed. Then, the pressure in the container was returned gradually to atmospheric pressure. The samples were retrieved from the container 30 min later, and water droplets were wiped off with a wet cloth. Finally, the weights of the wet samples (W2) were measured. The water content (W%) was determined using EquationEquation (1)(1)
(1) :
3.2.3. Thermogravimetry measurement
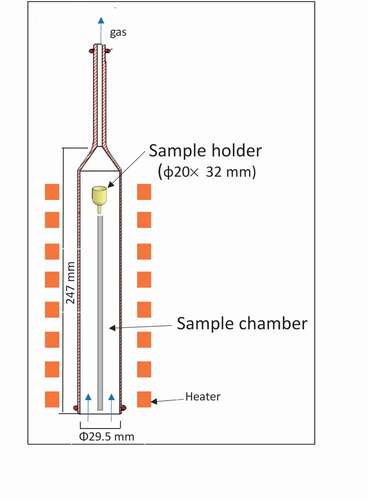
The weight changes of the wet samples were measured at various drying temperatures (100°C, 200°C, 300°C, and 1000°C) for 100 min under a helium gas flow (50 cc/min) or reduced pressure (rate: 200 Pa in 30 min; ) via thermogravimetry (NETZSCH, STA449F3 Jupiter). Detailed information on this method is presented in and .
Table 2. Specifications of thermogravimetry
Figure 5. Schematic of thermogravimetry.
Herein, the reduced pressure condition depends on the performance of an experimental device. The maximum temperature of the ceramic pellets was 300°C with reference to the treatment of the TMI-2 debris. With respect to the cement paste pellets, to sufficiently evaporate the bound water, the maximum temperature was set to 1000°C in order to be sufficiently higher than the decomposition temperature. This was because CaCO3 showed the highest decomposition temperature in a temperature range below the melting temperature of cement [Citation10]. The drying rates were derived from the weight changes according to:
where dW represents the weight changes of the wet samples, dt is the drying time, and S is the geometric surface area of samples.
The method of drying under reduced pressure was adopted during the drying of debris for TMI-2 and Paks [Citation8,Citation11]. We evaluated the drying curve parameters (critical water content, falling rate period, drying rate and time, and equilibrium water content) based on the results.
4. Results
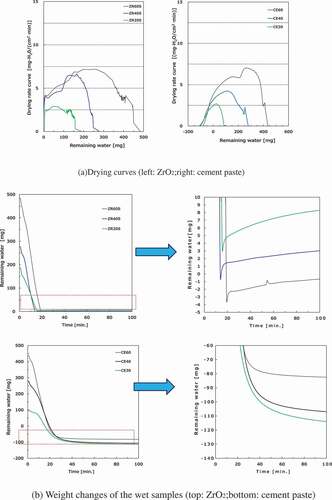
4.1. Ceramic pellets under helium-gas flow
The drying curves of the ceramic pellets are shown in . It should be noted that the water content is affected by the density of samples [EquationEquation (1)(1)
(1) ]. Even if the water amount and porosity are the same for two different types of materials, the weights of the two wet materials are not equal. Therefore, the remnant water is then sorted by weight (mg) in order to compare the samples of different materials; only the equilibrium water content is evaluated using EquationEquation (1)
(1)
(1) .
Figure 6. Drying curves of different ceramic pellets.
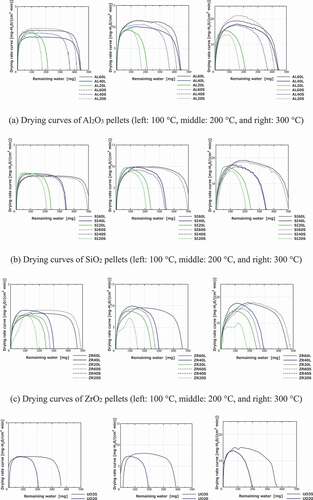
The induction, constant rate, and falling rate periods (including the equilibrium water content and critical water content) are observed in most samples; however, there is no constant rate period in low-porosity samples at 200°C and at 300°C in the drying curves (e.g. AL20S at 200°C and AL60L at 300°C). The degree of evaporation and the injection heat reaches equilibrium during the constant rate period. This indicates that under a high drying temperature or low porosity, which corresponds to low water content, the water on the sample surface evaporates rapidly during the induction period because the evaporation rate on the surface may be higher than the rate at which water is supplied from inside of the sample to its surface. During the drying process, there is no remarkable difference in the drying curves among the ceramic pellets under any internal/external conditions. Nevertheless, some ceramic pellets exhibit small distinguishing behaviors (e.g. drying rate), which are considered to be affected by wettability and thermal conductivity.
Some weight changes of wet samples are shown in . With the exception of UO2 pellets, the weight variations were within the identification limit (<0.5 mg) for 10–40 min under all temperature conditions, and the equilibrium water content values have an error of 0.5/W1 × 100%.
Figure 7. Weight changes of the wet samples.
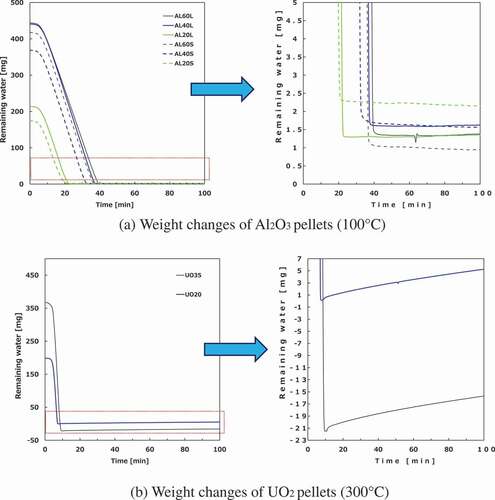
With respect to the UO2 pellets, the weight increases to ~5 mg owing to oxidation from residual oxygen in the reactor after the weight has been reduced once. Therefore, the equilibrium water content has an error of 5/W1 × 100%. The equilibrium values of weight changes vary more than the other samples. UO2 pellets were examined via thermogravimetry inside a glove box. On the contrary, the weights of the wet samples were measured outside the glove box, and re-saturated samples were preliminarily placed into the glove box for thermogravimetry. This re-saturation process and evaporation during handling also result in measurement errors.
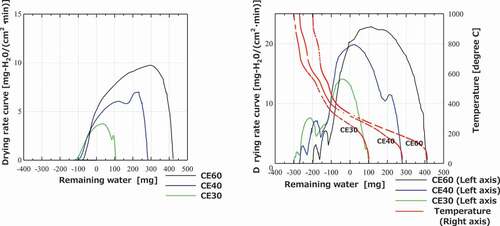
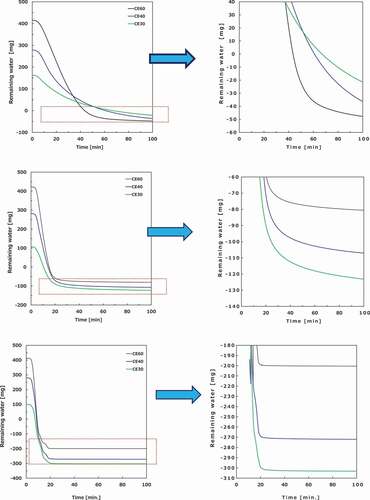
4.2. Cement paste pellets under helium gas flow
The drying curves of the cement paste pellets are shown in . The drying rates decrease even if the values for the remaining water become negative. This means that the components of cement paste decompose beyond absorbed water. It is presumed that some parts of the hydrates belonging to the bound water, for example, ettringite (3CaO·Al2O3 · 3CaSO4 · 32H2O), evaporate with free water (absorbed water) in the cement paste pellets. In addition, the drying curves do not have a constant rate period, even under low-temperature or high-porosity conditions, unlike the case wherein they were observed in the ceramic pellets, and the gradual decrease in the drying rate continues after reaching the maximum value. It should also be noted that free-water evaporation and heat injection reach equilibrium during the constant rate period, but the injection heat is consumed not only due to evaporation but also due to the decomposition of the bound water in the cement paste pellets. The drying rate increases at 450°C and 650°C result from the decomposition of Ca(OH)2 and CaCO3 along with the decomposition of the CSH phase as well [Citation10], respectively, as shown in the drying curves of the cement paste pellets at 1000°C. During the drying process, the remarkable effects of porosities and pore size distributions are not confirmed.
Figure 8. Drying curves of the cement paste pellets (left: 200°C; right: 1000°C).
The weight changes of the wet samples are shown in . With respect to the cement paste pellets, the values of the remaining water continue to decrease after 100 min at 100°C and 200°C due to decomposition of the bound water. Thus, the equilibrium water content values are not determined. At 1000°C, the weight changes of the wet samples are within the identification limit after ~20 min. Therefore, the equilibrium water content with an error of 0.5/W1 × 100% is obtained. However, the loss of bound water changes the value of W1 compared to that before heating.
Figure 9. Weight changes of the cement paste pellets (top: 100°C, middle: 200°C, and bottom: 1000°C).
4.3. Reduced pressure condition
Some drying curves and weight changes of the wet samples under reduced pressure are shown in . In terms of the drying rate, the gas flow condition is more advantageous than the reduced pressure condition. Under gas flow, heat transfer is convective and radiative, as opposed to the reduced pressure condition wherein heat transfer is radiative. The drying rate can be reversed by changing the position of the heat source. In addition, the gas flow rate and the vacuum degree affect the removal speed of water vapor, indicating that the drying rate can be also reversed. However, in this experiment, only relative values of the drying rates under various conditions are discussed as distinct from their absolute values. Consequently, the influence on the drying characteristics is estimated to be small, with the exception of the drying rate, caused by the difference in the heat transfer. The equilibrium water content of ZrO2 pellets has an error of 6/W1 × 100% because of a weight change of ~6 mg caused due to the pressure fluctuation in the reactor, and the equilibrium water content of the cement paste pellets is not determined, as previously mentioned. It is worth noting that the error value is confirmed via some baseline measurements of the thermogravimetry. In addition, the baseline fluctuates by ±6 mg at maximum under the reduced pressure condition.
Figure 10. Drying curves and weight changes of the wet samples under reduced pressure at 200°C.
5. Discussion
The relations between the drying temperatures and the entire drying times, defined as the time taken until the water content becomes 1% or less, are shown in . The entire drying times of the ceramic pellets converged at ~10 min for the 300°C condition. This means that the drying times were not strongly affected by the internal conditions. In comparison with the ceramic pellets, the entire drying times did not shorten even at 1000°C for the cement paste pellets owing to the decomposition of the bound water.
Figure 11. Relations between drying temperatures and the entire drying times.
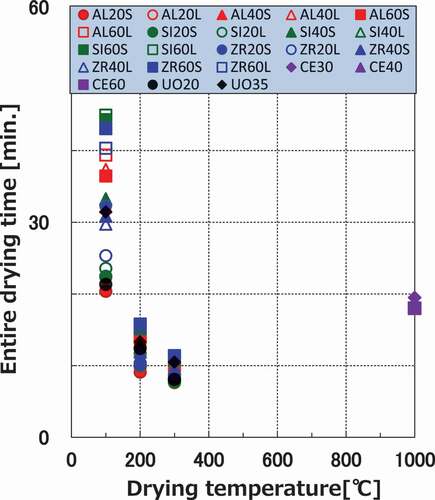
In addition, all ceramic pellets generally show similar drying curves in terms of drying characterizations (critical water content, falling rate period, drying rate and time, and equilibrium water content) under any experimental conditions. Therefore, cold ceramic pellets could be used as simulated debris for predicting the drying behaviors of ceramic debris, and the prediction of the drying behaviors of actual debris is described using the drying curves obtained herein. In contrast, the drying curves of the cement paste pellets are clearly different from those of the ceramic pellets. Additionally, the drying process takes longer time than ceramic pellets, even under the 1000°C condition. Consequently, it is necessary to determine a standard level of the dry state for drying MCCI products.
6. Conclusion
With respect to ceramic pellets, regardless of the drying method employed in this study, internal conditions, such as porosities and pore size distributions, did not affect the critical water content, falling rate period, and drying rate and time, making the drying process difficult. Therefore, the equilibrium water content could be below the detection limit. Furthermore, there was no remarkable difference between the drying curves of the different types of ceramic pellets under any internal/external conditions. Consequently, we proposed that cold ceramic pellets may be used as simulated debris to predict the drying behaviors of ceramic debris. Furthermore, the prediction of the drying behaviors of actual debris was described using the drying curves obtained herein. The cement paste pellets exhibited different behaviors compared to the ceramic pellets, and the drying time was longer than ceramic pellets, even under the 1000°C condition. Hence, the standard level of the dry state for drying MCCI products must be determined.
Acknowledgments
The authors would like to express their appreciation to Mr. S. Yamada, Mr. Y. Kano, Mr. S. Syoji, Mr. H. Miyata, Mr. M. Morita, Mr. T. Yagi, and Mr. M. Sekikawa for their invaluable help during the experiments conducted in this study.
This paper includes the results obtained under the research program entrusted to the International Research Institute for Nuclear Decommissioning, including the Japan Atomic Energy Agency, by the Agency for Natural Resources and Energy, Ministry of Economy, Trade and Industry (METI) of Japan.
Disclosure statement
No potential conflict of interest was reported by the authors.
References
- Nuclear Emergency Response Headquarters Council for the Decommissioning of TEPCO’S Fukushima Daiichi Nuclear Power Station. Mid-and-long-term roadmap towards the decommissioning of TEPCO’s Fukushima Daiichi Nuclear Power Station Units 1-4. Japan: Nuclear Emergency Response Headquarters Council for the Decommissioning of TEPCO’S Fukushima Daiichi Nuclear Power Station; 2017.
- Washiya T, Yano K, Kaji N, et al. Study of treatment scenarios for fuel debris removed from Fukushima Daiichi NPS. Proceeding of ICONE-23; 2015 May 17–21; Chiba (Japan).
- Reno HW, Schmitt RC, Quinn GJ, et al. Preparations to load, transport, receive, and store the damaged TMI-2 reactor core. Idaho Falls (ID): Idaho National Engineering Laboratory, EG&G Idaho, Inc; 1986. ID 83415.
- IAEA. Management of damaged spent nuclear fuel. Austria: IAEA; 2009. (IAEA nuclear energy series, No. NF-T-3.6).
- Carlsen B, Fillmore D, McCormack R, et al. Damaged spent nuclear fuel at U.S. DOE facilities, experience and lessons learned. Idaho Falls (ID): Department of Energy Assistant Secretary for Environmental Management Under DOE Idaho Operations Office (US); 2005. (INL/EXT-05-00760).
- Green Don W, Perry Robert H. Perry’s chemical engineers’ handbook. 8th ed. New York: McGraw-Hill companies; 2007. p. 12–29.
- Takano M, Nishi T. High temperature reaction between sea salt deposit and (U, Zr)O2 simulated corium debris. J Nucl Mater. 2013;443(1–3):32–39.
- Joseph Palmer A. Drying testes conducted on Three Mile Island fuel canisters containing simulated debris. Idaho Falls (ID): Lockheed Martin Idaho Technologies; 1996 (ID 83415-3765 (208) 526-8700).
- Idaho national engineering laboratory U.S. department of energy Idaho operations office. Environmental assessment test area north pool stabilization project. Idaho Falls (ID): Idaho National Engineering Laboratory, Department of Energy Idaho Operations Office (US); 1996. DOE/EA-1050.
- Schneider U, Diederichs U, Ehm C. Effect of temperature on steel and concrete for PCRV’s. Nucl Eng Des. 1982;67(2):245–258.
- Smirnov V, Komarov S, Amosov S, et al. Experience in preparation of spent nuclear fuel including damaged for shipment. IAEA Technical Meeting on Lessons Learned in Spent Fuel Management; 2014 Jul 8–10; Vienna (Austria).