
 ?Mathematical formulae have been encoded as MathML and are displayed in this HTML version using MathJax in order to improve their display. Uncheck the box to turn MathJax off. This feature requires Javascript. Click on a formula to zoom.
ABSTRACT
U3Si2 has been explored as an alternative nuclear fuel material for increased accident tolerance. However, scatter has been reported in the thermal properties possibly because of the pores and impurities within the samples. In the present study, we prepared a polycrystalline U3Si2 bulk sample with high density and without impurity, and evaluated its thermal and mechanical properties. The sample was synthesized by arc melting and spark plasma sintering, followed by annealing. The density of the U3Si2 pellet was 96% of the theoretical density. The heat capacity was measured and compared with the calculation data. In addition, the measured data were used to evaluate thermal conductivity of U3Si2. The measurement data of elastic properties were compared with the theoretical calculation and agreed well. A high thermal conductivity and hardness compare to UO2make it favorable to anticipated as alternative nuclear fuel.
1. Introduction
The Fukushima accident in Japan highlighted the need for the development of accident tolerant fuel (ATF) and has become a primary focus for nuclear research. Several candidates such as U3Si2, U3Si, and UN have been explored as new nuclear fuels within the framework of ATFs. These materials have attracted attention primarily because they have higher uranium density and thermal conductivity than UO2, the current nuclear fuel for light water reactors. A higher density of uranium increases the fissile density, which compensates for the neutronic inefficiency of advanced cladding materials without increasing enrichment limits [Citation1]. Higher thermal conductivity will improve the heat removal efficiency, reducing thermal stress when the reactor loses the coolant [Citation2,Citation3]. To utilize these candidates as alternative nuclear fuels, an accurate understanding of their thermal and mechanical properties is important to fabricate on a commercial manufacturing scale. Thus, the basic physical properties of these materials have been actively studied over the last several years [Citation4–Citation6].
The thermal conductivities of U3Si2, U3Si, and UN are 8.5, 13.5, and 13.0 W/mK at 300 K, respectively, and increase with temperature. Since the thermal conductivity of UO2 (9.8 W/mK at 300 K) decreases with temperature, U3Si2, U3Si, and UN show significantly higher thermal conductivity than UO2 at elevated temperature [Citation7,Citation8]. In addition, U3Si2, U3Si, and UN possess high uranium densities of 11.3, 14.7, and 14.3 g-U/cm3, respectively, which are higher than that of UO2 (9.7 g-U/cm3) [Citation7]. However, U3Si swells considerably under irradiation, and a phase transition occurs above 1000 K [Citation9,Citation10]. Furthermore, it was reported to be technically difficult to fabricate a high density UN pellet due to its high melting point (3078 K) [Citation11]. In addition, U3Si2 is susceptible to chemical reaction. From this perspective, U3Si2 is likely the most promising candidate due to its favorable properties.
U3Si2 has a tetragonal structure (P4/mbm space group), a melting point of 1887 K, and useful properties as a nuclear fuel such as thermally stability at high temperatures as well as high corrosion and oxidation resistance [Citation12]. For this reason, several groups have investigated the thermal properties of U3Si2 [Citation7,Citation13–Citation17]. However, there is a distinct scatter in the reported values. For example, the thermal conductivity has been reported as 8.5–25.1 W/mK from 300 to 1770 K for sintered samples [Citation7], 9.7–21.3 W/mK from 300 to 1400 K for arc casted samples [Citation17], and 8.2–12.3 W/mK from 300 to 1121 K for induction casted samples [Citation17]. The heat capacity value used to obtain the thermal conductivity also varies depending on the research group: from 160 to 180 J/molK over the temperature range 300–700 K [Citation15] and from 140 to 166 J/molK over the temperature range 300–1300 K [Citation7,Citation16]. Furthermore, the linear thermal expansion coefficient (LTEC) reported by White et al. [Citation7] abruptly decreased at 1100 K while others reported an almost constant value over the same temperature range [Citation13,Citation14]. The discrepancies observed for the thermal properties may be due to impurities, as observed in White’s (USi and UO2) [Citation7] and Taylor’s (USi3) [Citation15] studies, or voids in the measured samples, such as the low density of the specimen reported by Shimizu (92% T.D) [Citation17]. Recently, Metzger et al. reported the Vickers hardness and fracture toughness of U3Si2 [Citation18]. However, the sample they used for measurement contained USi and U3Si5 impurity phases, which could have greatly influenced the measured values.
Thus, in the present study, we report the thermal and mechanical properties of U3Si2. To obtain reliable data, we synthesized a dense polycrystalline U3Si2 sample without impurity. We evaluated thermal properties such as the thermal expansion coefficient, thermal conductivity, and heat capacity as well as mechanical properties such as the Debye temperature, elastic moduli, and hardness. We also calculated the heat capacity based on the lattice vibrations, thermal expansions, and electrical contribution and compared this estimate with the experimental values. Lastly, the experimental values obtained in the present study were compared with the available literature values regarding the properties of U3Si2.
2. Experimental procedure
The nominal composition of U3Si2 was prepared from natural uranium (Nuclear Fuel Industries, Ltd.) and silicon, 11N (KT’s craft Co., Ltd.) by arc melting in an Ar atmosphere. A 2 wt % excess Si was added to compensate for the evaporation of Si during arc melting. The ingot obtained was sealed into a SiO2 tube and annealed at 1073 K for 24 h under vacuum. The produced ingot was then crushed into fine powder by ball milling at 200 rpm for 2 h with tungsten carbide vials and balls. The sample was prepared in a glove box under an Ar atmosphere to prevent oxidation. The obtained powder was sintered using spark plasma sintering (SPS) used carbon dye (size: 10 mm) at 1123 K under a pressure of 75 MPa for 10 min (Dr. Sinter SPS-515A, Sumitomo Coal Mining Co., Ltd.). Ar flow was maintained during the sintering process.
The crystal structures of the powder samples were analyzed by X-ray diffraction (XRD) using Cu-Kα radiation with a Rigaku Ultima IV X-ray diffractometer equipped with a scintillation counter. The lattice parameter dependence on temperature was measured by high temperature XRD (HT-XRD). Measurements were conducted in a He flow atmosphere from 300 to 1073 K. The lattice parameters were evaluated from the XRD peak positions using a least square method with NIST Si for angular calibration. The theoretical density was calculated from the lattice parameters, and the relative density was calculated by comparing the theoretical and measured densities obtained from the measured weight and dimensions of the sample. The thermal expansion coefficient was quantified based on the a and c axes of the lattice parameters measured by HT-XRD. The sample microstructures were observed using field emission scanning electron microscopy (FE-SEM, JEOL, JSM-6500F), and chemical compositions were determined by energy dispersive X-ray (EDX) spectroscopy of which results are shown in . The thermal expansion coefficient was also evaluated using a dilatometer (Bruker AXS, TD5000SA) from 300 to 1200 K. An Al2O3 reference sample was used for calibration. Heat capacity was measured using a differential scanning calorimeter (DSC, Jupiter, Netzsch) apparatus from 300 to 1200 K under Ar flow. This measurement was calibrated using a sapphire standard sample.
Table 1. Composition of the U3Si2 bulk sample after annealing, as analyzed by SEM/EDX
The thermal conductivity (λ) was calculated from the thermal diffusivity (D), specific heat capacity (Cp), and density (ρ). Thermal diffusivity was measured by the laser flash (LF) method using a LFA-457 (Netzsch) apparatus. Thermal diffusivity measurements were repeated three times at each temperature, and the standard error of measurement was found to be less than 3%. In addition, the temperature-dependent thermal diffusivity of the graphite standard sample was measured from 300 to 1073 K and compared to the literature value (NMIJ RM 1201-a) [Citation19]. The deviations between the literature and measured values were also less than 3%. The longitudinal and shear sound velocities were measured using the ultrasonic pulse-echo method using a sing around ultrasonic instrument (ULTRASONIC ENGINEERING CO., LTD. UVM-2) to evaluate the elastic properties and Debye temperature. The longitudinal sound velocity of an iron standard sample was measured and compared with literature values [Citation20]. The deviation between these values was less than 0.4%. Measurements were performed three times, and the standard error of the velocity was calculated and listed as uncertainties in . The Vickers indentation test was performed using a Vickers hardness tester (Akashi, hardness tester). The applied load was 9.8 N with a loading time of 10 s, and a series of 11 indentations were placed on the surface. The standard error for the Vickers hardness and fracture toughness are shown in as uncertainties.
Table 2. Sample characteristics and thermophysical properties of U3Si2, UO2, and UN [Citation5,Citation26,Citation30,Citation33,Citation35,Citation36,Citation38,Citation39,Citation48,Citation49]
Table 3. Vickers hardness and fracture toughness of U3Si2 at 9.8 N together with the diagonal average (a) and c/a ratio
3. Results and discussion
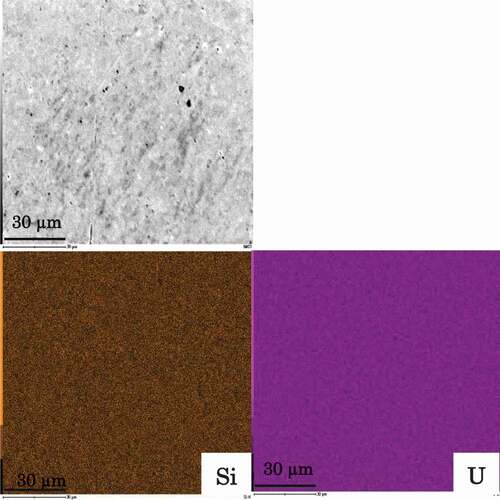
The XRD patterns of the powder U3Si2 after arc melting, SPS, and annealing, along with the literature data are shown in . All peaks were indexed on a tetragonal C11b-structured U3Si2 [Citation21]. The lattice parameters of U3Si2 were evaluated from XRD patterns of the annealed sample and found to be 0.7321 ± 0.0014 nm for the a-axis and 0.3894 ± 0.0011 nm for the c-axis, which agreed with previously reported data [Citation22]. The relative density of the prepared sample exceeded 96% of the theoretical density. To confirm the U and Si elemental distributions and the composition of the annealed sample, quantitative EDX analysis was performed, and the results are shown in and . The analysis confirmed that U and Si were distributed uniformly. The determined mole fractions were 0.61 for U and 0.39 for Si, which are quite close to the theoretical value of U3Si2. Based on these results, we concluded that a dense sample with a single phase of tetragonal C11b-structure U3Si2 was obtained.
Figure 1. XRD patterns of the U3Si2 powder together with the literature data for tetragonal structured U3Si2 [PDXL. (No: 01–075-1941).].
![Figure 1. XRD patterns of the U3Si2 powder together with the literature data for tetragonal structured U3Si2 [PDXL. (No: 01–075-1941).].](/cms/asset/5677db73-e97f-4e33-ad66-930c4a104e03/tnst_a_1480431_f0001_b.gif)
Figure 2. Microstructure of U3Si2 from field emission scanning electron microscopy (FE-SEM) and energy dispersive X-ray analysis.
The temperature-dependent lattice parameters are shown in . The lattice parameters of both axes increase linearly with increasing temperature. The lattice parameters for the a and c axes were fit using the following linear expressions:
Figure 3. Lattice parameters a and c of U3Si2 as a function of temperature. The solid line is the fitting line expressed in Eqs. Equation(1)(1)
(1) and Equation(2)
(2)
(2) .
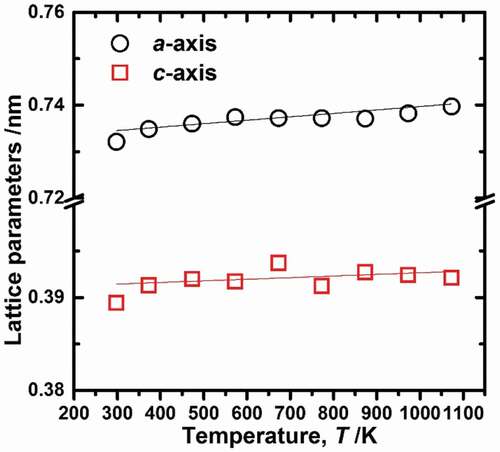
where T is temperature in Kelvin. The fitted results are shown in as solid lines.
The volumetric thermal expansion coefficient (β) can be defined from the temperature-dependent lattice volume V. The corresponding relationship is as follows [Citation23]:
where V0 is the lattice volume at 300 K. The volumetric thermal expansion coefficient is β = 3αl where αl is the LTEC. Using this relationship, the average LTEC measured by HT-XRD was found to be 15.8 ± 1.3 × 10⁻⁶ K−1 from 300 to 1073 K. In addition, we measured the thermal expansion of U3Si2 using a dilatometer. The thermal expansion (L-L0)/L0 is shown in ) where L is the measured sample length and L0 is the length of the sample at 300 K. The LTEC can be defined as follows:
Figure 4. (a) Specimen length change and linear thermal expansion coefficient (LTEC) of U3Si2 as a function of temperature. (b) LTEC as a function of temperature together with previously reported data.
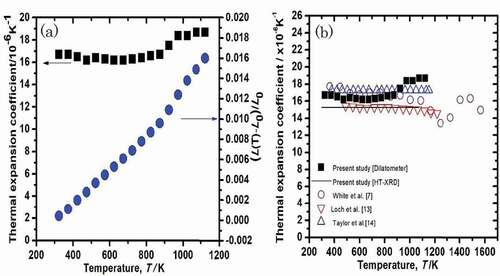
(4) The values of αl calculated using Eq. (4) are plotted in (a). The LTEC measured by dilatometer is almost constant from 300 to 873 K; however, over 873 K, the value slightly increased. The average LTEC was found to be 16.4 ± 0.2 × 10⁻⁶ K−1 (dilatometer) from 300 to 873 K, and 15.8 ± 1.3 × 10⁻⁶ K−1 (HT-XRD) from 300 to 1073 K, as listed in .
The LTECs obtained from the HT-XRD and dilatometer were plotted together with literature values in (b). For the HT-XRD and dilatometer data, although the temperature dependencies of the LTECs are slightly different, the mismatch is quite small. The thermal expansion coefficient measured in the present study (HT-XRD and dilatometer) and shown in (b) agreed with literature values reported by other groups [Citation7,Citation13,Citation14].
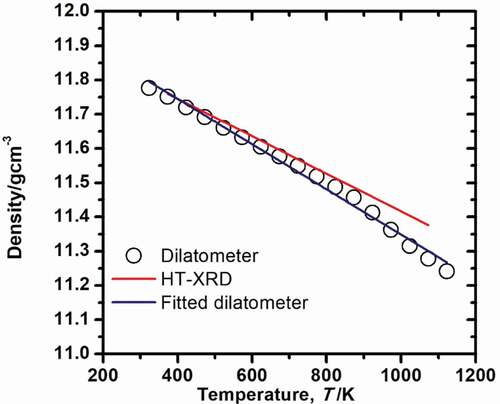
Given that the thermal expansion coefficient is constant, the density of U3Si2 as a function of temperature can be calculated from the following:
where T0 is 300 K and ρ0 is the density at T0 (11.79 g/cm3), αl is the LTEC obtained by HT-XRD and dilatometry. The calculated density as a function of temperature is shown in . The temperature-dependent density calculated from LTEC obtained by HT-XRD (ρHT-XRD) is expressed as a linear function, and that obtained by dilatometer (ρdilatometer) was shown by data points which are fitted by a linear function. The functional forms are given by:
Figure 5. Density as a function of temperature. The black open solid symbols are the values obtained from dilatometry and the red line is from the high temperature X-ray diffraction analysis.
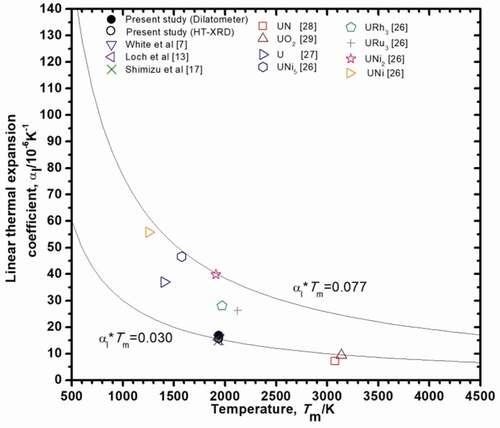
Based on Lindemann melting rule, LTEC is inversely proportional to the melting temperature, Tm [Citation24], i.e.:
where C is a constant. It has been reported that C is 0.03 for fluorite type oxides [Citation25] and 0.077 for uranium intermetallic compounds [Citation26]. For uranium metal, C was found to be 0.05 in the present study using the literature data [Citation27]. The relationship between the melting temperature, Tm, and average LTEC, αl, for U3Si2 [Citation7,Citation13,Citation17] together with the other uranium containing compounds [Citation26–Citation29] is shown in . The melting point for U3Si2 was taken from the literature [Citation30] and is listed in . shows that the value of C for U3Si2 is quite close to 0.03, which is the same as fluorite type oxides, such as UO2. This result may suggest that atomic bonding in U3Si2 is more similar to that in UO2, compared to those in other uranium intermetallic compounds.
Figure 6. Relationship between the LTEC and melting point for U3Si2 and related compounds.
The elastic constants for Young’s modulus (E), shear modulus (G), bulk modulus (B), Poisson’s ratio (v), and Debye temperature (D) can be estimated from the longitudinal sound velocity (VL) and shear sound velocity (VS) as follows [Citation31,Citation32]:
where h is Plank’s constant, kB is Boltzmann’s constant, NA is Avogadro’s constant, M is the molecular weight, and n is the number of atoms in the molecule. We used our experimentally measured data for longitudinal sound velocity VL and shear sound velocity VS which were 3772 ± 26 and 2310 ± 2 m/s, respectively. The determined elastic modulus and Debye temperature are presented in together with those obtained by density functional theory) calculations [Citation33]. The shear modulus, Young’s modulus, bulk modulus, Poisson’s ratio, and Debye temperature obtained in the present study nearly agreed with the theoretically calculated values [Citation33]. In , the elastic modulus of U3Si2 is shown together with the previously reported UO2 and UN data [Citation28,Citation34,Citation35]. The elastic modulus of U3Si2 was lower than that of UO2 and UN.
The heat capacity of U3Si2, as measured by DSC, is shown in ). An empirical equation for the heat capacity of U3Si2 can be represented as follows:
Figure 7. (a) Specific heat capacity of U3Si2 as a function of temperature. (b) Calculation of specific heat capacity together with experimental data. The highlighted lines indicate the mechanisms that contribute to the ultimate value.
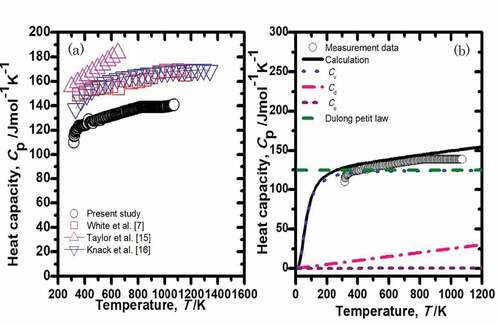
The experimental values measured in the present study disagreed with the experimental data of Knacke et al. and White et al. over the entire temperature range [Citation7,Citation16]. In addition, the data of Taylor et al. were higher than those reported by the other groups [Citation15]. The reasons for the discrepancies are unclear, since the porosity and impurities will not significantly affect the specific heat capacity. However, we believe our data are more reliable because they are in better agreement with theoretically estimated values, as discussed below.
The theoretically calculated heat capacity is shown in (b) together with the experimental data. The heat capacity is commonly composed of dilation, lattice, and electronic components. Heat capacity at constant pressure, Cp, is calculated by [Citation26]:
where Ce is the electronic term, Cd is the dilation term, and Cv is the harmonic lattice vibration term. The dilation term is expressed as:
where β is the volumetric expansion coefficient (the value measured by the dilatometer was used here), V is the molar volume, and KT is the isothermal compressibility which was calculated from the bulk modulus, B, using the following relationship, KT = 1/B. The electronic term of heat capacity for metallic materials can be expressed as:
where η is the electronic specific heat coefficient. White et al. used 52.0 mJ/mol·K2 [Citation7] for the η value of U3Si2. The harmonic lattice vibration term is expressed using the Debye temperature as follows:
We used the data obtained in this study for θD. The summation of Cv, Ce, and Cd components of heat capacity produces the total heat capacity, Cp, shown as the black line in (). The calculated Cv values agreed with the Dulong Petit Law value above the Debye temperature. The calculated data for Cp agreed with the measured values, which indicates that our data are reliable.
From the results of the volumetric thermal expansion (β), bulk modulus (B), and specific heat capacity (Cv), the Grüneisen parameter () can be calculated as [Citation36]:
where β is the volumetric thermal expansion coefficient of U3Si2 (dilatometer), B is the bulk modulus, Vm is the molar volume, and Cv is the calculated lattice vibration heat capacity value at 300 K from EquationEq. 19(19)
(19) . The calculated data are shown in together with those previously determined for UN and UO2 [Citation37,Citation38]. The Grüneisen parameters of U3Si2, UN, and UO2 are similar, which means that there is no significant difference in the inharmonicity of the bonding in these materials.
The temperature dependence of the thermal diffusivity of U3Si2 is shown in ). The thermal conductivities were calculated from the thermal diffusivity measurements using the following relationship:
Figure 8. (a) Temperature dependence of the thermal diffusivity. (b) Temperature dependence of the thermal conductivity of U3Si2 together with previously reported data. (c) Temperature dependence of the total thermal conductivity, electrical thermal conductivity, and lattice thermal conductivity of U3Si2.
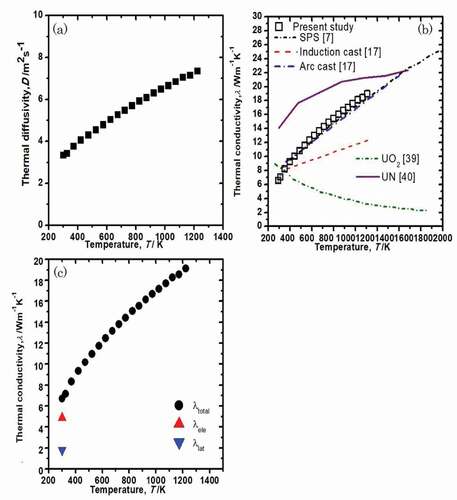
where D is the measured thermal diffusivity, ρ is the calculated sample density, and Cp is the specific heat capacity measured using DSC. The temperature dependence of the thermal conductivity of U3Si2 is shown in (b) along with previously reported values. The thermal conductivity increases with increasing temperature from 6.7 W/mK at 300 K to 19.1 W/mK at 1230 K. The thermal conductivity increases with increasing temperature. Our data, which were obtained from a sintered sample, are close to the value reported [Citation7], which were also obtained from a sintered sample. Shimizu fabricated U3Si2 specimens by induction casting and arc casting [Citation17]. Although the thermal conductivity of the arc casted U3Si2 agrees well with our data, that of the induction casted U3Si2 is much lower, possibly due to cracking. The thermal conductivity of U3Si2 was compared with that of UO2 and UN [Citation39,Citation40]. The thermal conductivity of U3Si2 was similar to that of UO2 at approximately 400 K but is significantly higher than that of UO2 at temperatures above 500 K since the thermal conductivity of UO2 decreases with increasing temperature. On the other hand, the thermal conductivity of UN shows the same trend with that of U3Si2 as they both increase with temperature [Citation40].
Thermal conduction consists of lattice and electronic contributions. The total thermal conductivity can be represented as follows:
where λele is the electronic thermal conductivity, and λlat is the lattice thermal conductivity. The value of λele is expressed by the Wiedemann–Franz law [Citation41]:
where L is the Lorenz number (2.45 × 10⁻⁸ W·Ω·K−2), and σ is the electrical conductivity. Taylor et al. reported the value of electrical conductivity only at 300 K, which was 6.67 × 10⁵ Sm−1 [Citation14]. The calculated electronic thermal conductivity and lattice thermal conductivity are shown in ). At 300 K, the λele is 4.9 W/mK, which is larger than λlat (1.80 W/mK) indicating that electronic contribution is dominant. Since the lattice thermal conductivity tends to decrease with increasing temperature due to the phonon–phonon scattering effect, the electronic contribution is more dominant at higher temperature. Thus, the increase in the temperature-dependent thermal conductivity of U3Si2 can largely be ascribed to the electronic contribution.
The hardness, HV, of the sample was measured by a diamond pyramid type indenter and defined by [Citation42]:
where F is the applied load, and a is the diagonal average of the indentation. The corresponding indentation fracture toughness, KIC, of U3Si2 can be estimated from the following equation [Citation43]:
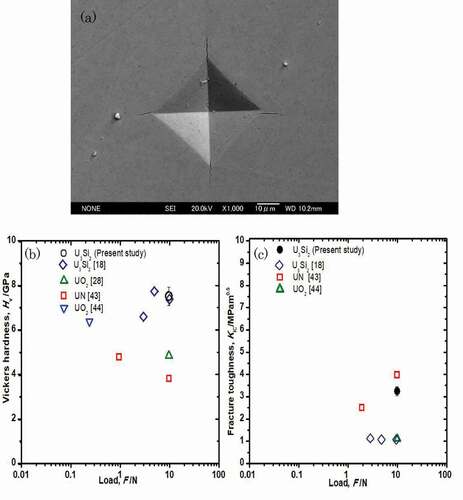
where c is the average length of four cracks generated from the vertex of the indentation, and A is a constant with a value of 0.016. E and HV are the Young’s modulus and hardness calculated in the present study, respectively. The impressions and cracks in the indents were characterized using FE-SEM and are shown in (a). The average diagonal a, c/a ratio, Vickers hardness, and fracture toughness are summarized in . The Vickers hardness and fracture toughness of U3Si2 were found to be 7.51 ± 0.41 GPa and 3.25 ± 0.20 MPa·m1/2, respectively, which are plotted together with the previously reported values for U3Si2, UN, and UO2 [Citation18,Citation29,Citation44,Citation45] in (b, c) as a function of the indentation load. The Vickers hardness value of U3Si2 obtained in this study is in good agreement with the literature data reported [Citation18]. (b) shows that U3Si2 possesses higher hardness than UN and UO2. In contrast, the fracture toughness for U3Si2 obtained in this study is 58% higher than that reported by Metzger et al. (0.86 MPa·m1/2) [Citation18]. They also reported that USi and U3Si5 were present in their U3Si2 sample based on EDX analysis. Since precipitates at grain boundaries could deteriorate toughness [Citation46,Citation47], secondary phases such as USi and U3Si5 might affect the measured fracture toughness, which would account for the differences between Metzger’s data and those reported herein.
Figure 9. (a) The Vickers indentation fracture pattern of U3Si2 at 9.8 N imaged by FE-SEM. (b) Vickers hardness as a function of indentation load for U3Si2. (c) Fracture toughness as a function of indentation load for U3Si2.
4. Conclusion
A dense U3Si2 sample was fabricated, and its thermal and mechanical properties were measured. We successfully synthesized a dense sample with a single phase of U3Si2. The average LTEC s determined by HT-XRD and dilatometer were 15.8 ± 1.3 × 10⁻⁶ and 16.4 ± 0.2 × 10⁻⁶ K−1, respectively. The measured specific heat capacity was slightly lower than the literature values, but our data are in good agreement with the theoretical values calculated by the summation of phonon, electron, and volume expansion terms, which indicates our data are reliable. The obtained thermal conductivity was 6.7 W/mK at 300 K, and increases with temperature. At 1230 K, the value reached 19.1 W/mK. The mechanical properties measured in the present study are the first such reported data. The elastic moduli and Debye temperature were evaluated at 300 K, which agreed well with the values obtained by theoretical calculations. The Vickers hardness and fracture toughness of U3Si2 were 7.51 ± 0.41 GPa and 3.25 ± 0.20 MPa.m1/2, respectively, which are higher than those of UO2. Based on the higher fracture toughness and higher thermal conductivity of U3Si2 compared to UO2, it is expected that U3Si2 would be more tolerant to pellet cracking caused by thermal stress.
Disclosure statement
No potential conflict of interest was reported by the authors.
References
- Brent JL, Onder EN, Prudil AA. Fundamentals of nuclear engineering. 1st ed. Chichester: John Wiley & Sons Ltd; 2017. p. 177–180.
- Pickman DO. Design of fuel elements. Nucl Eng Des. 1972;21:303–317.
- Lopes DA, Uygur S, Johnson K. Degradation of UN and UN–u3Si2 pellets in steam environment. J Nucl Sci Technol. 2017;54:405–413.
- Bragg-Sitton S. Development of advanced accident-tolerant fuels for commercial LWRs. Nucl News. 2014;83–91.
- Ortega LH, Blamer BJ, Evans JA, et al. Development of an accident-tolerant fuel composite from uranium mononitride (UN) and uranium disilicide (U3Si2) with increased uranium loading. J Nucl Mater. 2016;471:116–121.
- Harp JM, Lessing PA, Hoggan RE. Uranium silicide pellet fabrication by powder metallurgy for accident tolerant fuel evaluation and irradiation. J Nucl Mater. 2015;466:728–738.
- White JT, Nelson AT, Dunwoody JT, et al. Thermophysical properties of U3Si2 to 1773 K. J Nucl Mater. 2015;464:275–280.
- Fink JK. Thermophysical properties of uranium dioxide. J Nucl Mater. 2000;279:1–18.
- Bethune B. Structural transformations in U3Si. J Nucl Mater. 1969;31:197–202.
- Hastings IJ, Stoute RL. Temperature-dependent swelling in irradiated U3Si fuel elements. J Nucl Mater. 1970;37:295–302.
- Metroka RR. Fabrication of uranium mononitride compacts. Lewis Research Center NASA Cleveland; 1970, NASA TN D-5876.
- Hofman GL. A short note on high density dispersion fuels. Internal Report Argonne National Laboratory. Lemont (IL): Argonne National Laboratory; 1996.
- Loch LD, Engle GB, Snyder MJ, et al. Survey of refractory uranium compounds. Battelle Memorial Institute; August 1956, Tech. Rep. BMI-1124.
- Taylor KM, McMurtry CH. Synthesis and fabrication of refractory uranium compounds. Carborundum Company; February 1961, Tech. Rep. ORO-400.
- Taylor RE, Cape JA. Thermal properties of refractory materials. Atomics International; April 1961, Tech. Rep. AD-255894.
- Knacke O, Kubaschewski O, Hesselmann K. Thermochemical properties of inorganic substances. Berlin Heilderberg: Springer; 1991. p. 1–2541.
- Shimizu H. The properties and irradiation behavior of U3Si2. Atomics International; July 1965, Tech. Rep NAA-SR-10621.
- Metzger KE, Knight TW, Roberts E, et al. Determination of mechanical behavior of U3Si2 nuclear fuel by microindentation method. Prog Nucl Energy. 2017;99:147–154.
- National Metrology Institute of Japan. Certificate of analysis standard reference material NMIJ RM 1201-a-isotrophic graphite for thermal diffusivity measurement. Tokyo: AIST; 2010.
- Lide DR. CRC handbook of chemistry and physics. 71 ed. Boston (MA): CRC Press. 2016;1990–1991.
- PDXL. (No: 01-075-1941).
- Remschnig K, Bihan TL, Noël H, et al. Structural chemistry and magnetic behavior of binary uranium silicides. J Solid State Chem. 1992;97:391–399.
- James JD, Spittle JA, Brown SGR, et al. A review of measurement techniques for the thermal expansion coefficient of metals and alloys at elevated temperatures. Meas Sci Technol. 2000;12:3.
- Lindemann FA. Uber die Berechnung mlekularere Eigenfrequenzen. Physik. Z. 1910;11:609–612.
- Uitert LGV, O’Bryan HM, Lines BME. Thermal expansion-an empirical correlation. Mater Res Bull. 1977;122:61–268.
- Yamanaka S, Yamada K, Tsuzuki T, et al. Mechanical and thermal properties of uranium intermetallic compounds. J Alloys Compd. 1998;271–273:549–556.
- Katz JJ, Rabinowitch E. The chemistry of uranium. 1st ed. New York: McGraw-Hill Book Company, Inc.; 1951. p. 137.
- Hayes SL, Thomas JK, Peddicord KL. Material property correlations for uranium mononitride. J Nucl Mater. 1990;171:262–270.
- Yamada K, Yamanaka S, Katsura M. Mechanical properties of (U,Ce)O2. J Alloys Compd. 1998;271–273:697–701.
- Ugajin M, Itoh A. Experimental investigations on the chemical state of solid fission-product elements in U3Si2. J Alloys Compd. 1994;213:369–371.
- Anderson OL. A simplified method for calculating the Debye temperature from elastic constants. J Phys Chem Solids. 1963;24:909–917.
- Screiber E, Anderson O, Soga N. Elastic constants and their measurements. New York: McGrawHill; 1973.
- Wang T, Qiu N, Wen X, et al. Du S First-principles investigations on the electronic structures of U3Si2. J Nucl Mater. 2016;469:194–199.
- Fritz IJ. Elastic properties of UO2 at high pressure. J Appl Phys. 1976;47:4353–4358.
- Whaley H, Fulkerson W, Potter R. Elastic moduli and Debye temperature of polycrystalline uranium nitride by ultrasonic velocity measurements. J Nucl Mater. 1969;31:345–350.
- Watanabe T. Thermal transport properties of uranium dioxide by molecular dynamics simulations. J Nucl Mater. 2008;375:388–396.
- White GK, Sheard FW. The thermal expansion at low temperatures of UO2 and UO2/ThO2. J Low Temp Phys. 1974;14:445–457.
- Moore JP, Fulkerson W, McElroy DL. Thermal conductivity, electrical resistivity, and Seebeck coefficient of uranium mononitride. J Am Ceram Soc. 1970;53:76–82.
- White JT, Nelson AT. Thermal conductivity of UO2+x and U4O9-y. J Nucl Mater. 2013;443:342–350.
- Muta H, Kurosaki K, Uno M, et al. Thermal and mechanical properties of uranium nitride prepared by SPS technique. J Mater Sci. 2008;1043:6429–6434.
- Jonson M, Mahan GD. Mott’s formula for the thermopower and the Wiedemann-Franz law. Phys Rev B. 1980;21:4223–4229.
- Gong J, Wu J, Guan Z. Examination of the indentation size effect in low-load Vickers hardness testing of ceramics. J Eur Ceram Soc. 1999;19:2625–2631.
- Anstis GR, Chantikul P, Lawn BR, et al. Critical evaluation of indentation techniques for measuring fracture toughness. J Am Ceram Soc. 1981;64:533–538.
- Adachi J, Kurosaki K, Uno M, et al. Mechanical properties at sub-microscale and macroscale of polycrystalline uranium mononitride. J Nucl Mater. 2009;384:6–11.
- Sengupta AK, Basak CB, Jarvis T, et al. Effect of titania addition on hot hardness of UO2. J Nucl Mater. 2004;325:141–147.
- Ravichandran KS. Fracture resistance of structural alloys. In: ASM handbook: fatigue and fracture, vol. 19. Materials Park (OH): ASM International; 1996. p. 381–392.
- Campbell FC. Fatigue and fracture: understanding the basics. Materials Park (OH): ASM International. US; 2012.
- Yamashita T, Nitani N, Tsuji T, et al. Thermal expansions of NpO2 and some other actinide dioxides. J Nucl Mater. 1997;245:72–78.
- Yamada K, Yamanaka S, Nakagawa T, et al. Study of the thermodynamic properties of (U, Ce)O2. J Nucl Mater. 1997;247:289–292.