
 ?Mathematical formulae have been encoded as MathML and are displayed in this HTML version using MathJax in order to improve their display. Uncheck the box to turn MathJax off. This feature requires Javascript. Click on a formula to zoom.
ABSTRACT
This study focuses on the in-vessel phase of severe accident management (SAM) strategy for a hypothetical 1000 MWe pressurized water reactor (PWR). To examine the effectiveness of SAM strategy, it is necessary to identify and assess epistemic and aleatory uncertainties. The selected scenario is a station blackout (SBO) and the corresponding SAM strategy is reactor coolant system (RCS) depressurization followed by water injection into the reactor pressure vessel (RPV). The analysis considers the depressurization timing and the flow rate and timing of in-vessel injection for scenario variations. For the phenomenological uncertainties, the core melting and relocation process is considered to be the most important phenomenon in the in-vessel phase of SAM strategy. Accordingly, sensitivity analyses are carried out to assess the impact of the cutoff porosity related to the flow area of core node (EPSCUT), the critical temperature (TCLMAX) and the minimum fraction of oxidized Zr (FZORUP) for cladding rupture, and the flag to divert gas flows in the core to the bypass channel (FGBYPA) on the core melting and relocation process. In this study, the effect of injection time on the integrity of RPV has been examined based on the quantification of the scenario and phenomenological uncertainties.
Introduction
Severe accident mitigation is an important design feature for new nuclear power plants (NPPs). Unlike design basis accidents (DBAs), both scenario variations and phenomenological uncertainties are important in severe accidents. To remedy uncertainty issues, Theofanous [Citation1] developed the risk-oriented accident analysis methodology (ROAAM). ROAAM is a consensus approach to resolve phenomenological uncertainties using bounding scenarios. However, the bounding scenario concept has its limitation in severe accident management (SAM) evaluation since various severe accident phenomena should be considered in SAM. As an extension of ROAAM, ROAAM+ framework [Citation2] was proposed and used in the SAM evaluation of the Nordic boiling water reactor (BWR) conducted by the Royal Institute of Technology (KTH) in Sweden.
Within the ROAAM+ approach, the analysis should consider both epistemic (phenomena) and aleatory (scenarios) uncertainties. The processes involved in severe accidents can be divided into in-vessel and ex-vessel phases. In this study, ROAAM+ approach is used to examine the in-vessel phase of SAM strategy for a 1000 MWe PWR. Specifically, we aim to derive the successful strategies for maintaining the integrity of the reactor vessel and detailed information regarding the core melting and relocation under this condition.
Globally, there has been a growing interest to have 1000 MWe range NPPs with better severe accident mitigation capabilities. Examples of 1000 MWe range NPPs are AP-1000 [Citation3], VVER-1000 [Citation4] and ATMEA1 [Citation5]. In this study, we envision a Korean 1000 MWe pressurized water reactor (PWR) based on the proven OPR1000 [Citation6] design with APR1400’s [Citation7] safety systems as an advanced NPP.
This study examines the evolution of plant response to the SAM strategy of reactor coolant system (RCS) depressurization and water injection into the reactor pressure vessel (RPV). The event of station blackout (SBO) is chosen as the reference case based on the APR1400 probabilistic risk assessment (PRA) results [Citation8]. The RCS depressurization is performed by opening the pilot-operated safety relief valves (POSRVs). For the RPV injection, an external pump is assumed available given that all NPPs in Korea have implemented the diverse and flexible coping strategies (FLEX) in the wake of the Fukushima Daiichi NPP accident.
The plant response is simulated using the computer code MAAP5. To consider the effect of scenario variation on SAM, the timing of POSRVs opening and both the flow rate and timing of external injection are varied. For the phenomenological uncertainties, four MAAP5 parameters are considered: EPSCUT, which is the cutoff porosity below which the flow area and hence the hydraulic diameter of a core node are zero; TCLMAX, which is the temperature that will lead to cladding rupture; FZORUP, which is the minimum fraction of oxidized Zr for cladding rupture; and FGBYPA, which is the flag to divert gas flows in the core to the bypass channel. According to the MAAP5 manual [Citation9], these four parameters affect the core melting and relocation process, which is an important phenomenon for the evaluation of the in-vessel phase of SAM. In this process, information on core melting and relocation is derived, to be used as an initial condition for the ex-vessel phase of SAM evaluation such as the external reactor vessel cooling (ERVC) strategy in the future.
Analysis methodology
The analysis of this study is based on the information and assumptions in this section. First, the target plant for analyzing the in-vessel phase of SAM is described. The ROAAM+ framework used in Nordic BWR is a full scope with all of each severe accident phenomena, but this study focuses on only one phenomenon which is the core melting and relocation. The scope of ROAAM+ approach used in this study is therefore addressed. The process for selecting the initial event and the representative sequence is also described. Finally, the case studies are discussed according to the selected SAM strategies.
Target plant
The plant is a 1000 MWe PWR based on the proven OPR1000 design. It is envisioned that the latest safety systems of APR1400, including severe accident mitigation features [Citation6], are implemented. New design feature improvements such as no-leakage reactor coolant pump (RCP) seal [Citation10] and FLEX equipment are assumed to be adopted as well.
Scope of ROAAM+ approach
The ROAAM+ approach, which is an extension of the original ROAAM, decomposes severe accident progression into a set of causal relationships represented by respective surrogate models and connected through initial conditions. It can provide an overall framework for SAM evaluation by asserting whether or not an adequate level of safety has been achieved for any given plant [Citation2]. Deterministic and probabilistic analyses are integrated in ROAAM+ framework to address the uncertainties associated with both phenomena (epistemic) and scenarios (aleatory).
This study is focusing on the in-vessel phase of SAM strategy. It means the ex-vessel phenomena and strategies such as the ERVC are beyond of the task scope in this study. Therefore, this study analyzes the core melting and relocation, which is one set of various severe accident sets that the ROAAM+ framework constitutes. The relation between ROAAM+ and this work is that although the analysis category is limited to one severe accident phenomenon in the framework unit, both epistemic and aleatory analyses are performed to satisfy the analysis methodology in ROAAM+ approach.
MAAP model and nodalization
In this study, MAAP5 version 5.04 released in 2016 is used [Citation9]. The RCS for the target plant was simulated with the nodalization for CE-type plants already provided in MAAP5. The core model is modeled using 7 rings (channels) and 13 rows as shown in .
Figure 1. Core nodalization.
Initial event and representative sequence
The initial event and scenario is based on the PSA results of APR1400 [Citation8] because there is no PSA report for the target plant. The target plant has the only change for the power output and the size of equipment such as steam generators but the rest design including all the latest safety equipment of the APR1400 is almost same. Based on the PSA results of APR1400, SBO is selected as the initial event with the highest cumulative Core Damage Frequency (CDF) as shown in [Citation8].
Table 1. CDF contribution by initiating events (APR1400) [Citation8]
With a SBO as the initiating event, a conservative accident sequence has been set assuming that all safety-related functions fail. Thus, the representative sequence considers the failure of alternative alternating current (AAC) power source, the failure of secondary heat removal with Turbine-Driven Auxiliary Feed Water Pumps (TDAFWPs), no RCP seal leakage, and the failure of offsite power recovery within 72 h as shown in .
Figure 2. Event tree for the representative sequence.
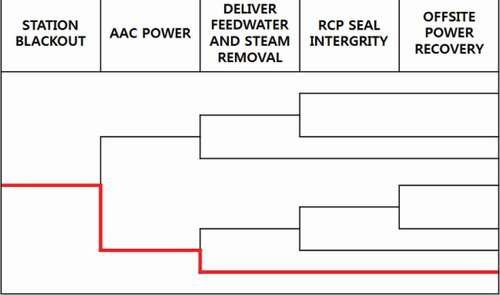
It should be noted that the Westinghouse’s KSB type F RCP seal has been commercialized recently. It is designed to maintain the integrity for 72 h even in a high-temperature and high-pressure environment of 573 K (572 °F) and 16 MPa (2335 psia), respectively. This seal has been applied to the latest APR1400 design [Citation10], and it is therefore assumed that this RCP seal is applied to the target NPP and as such no RCP seal leakage is assumed in this analysis.
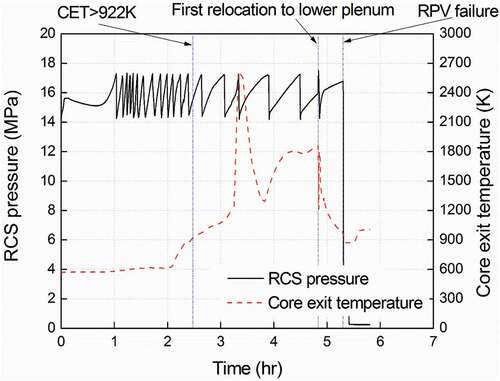
An analysis was performed to obtain the baseline information of the accident progress for the representative sequence. shows the RCS pressure and core exit temperature for the representative case without implementation of any SAM actions. As shown in the figure, the SAM phase starts at 2.5 h. The SAM entry condition is activated when the core exit temperature is higher than 922 K (1200 °F) in accordance with the Severe Accident Management Guidelines (SAMG) of APR1400 [Citation11,Citation12]. According to the model, the first relocation, a phenomenon in which the melt inside the core slumps to the lower plenum of RPV, occurs at 4.8 h, and the failure of the RPV is predicted to occur at 5.3 h.
Figure 3. Pressure and core exit temperature for the representative case without SAM actions.
Model assumptions and case studies
Following the SAM strategy, intentional RCS depressurization is first implemented followed by in-vessel injection. RCS depressurization is achieved by the opening of the POSRVs [Citation11]. For the representative scenario, the battery can be used for 16 h, and the power cannot be recovered until 72 h. Therefore, it is assumed that external primary side injection is achieved using the FLEX portable pumps [Citation13] .
Through the above SAM strategy and assumptions, the effects of depressurization timing as well as the effect of timing and flow rate of the in-vessel external injection are examined. Furthermore, four key MAAP5 parameters affecting the core relocation, namely, EPSCUT, TCLMAX, FZORUP, and FGBYPA are selected. Sensitivity analyses are performed to examine the effect of the variation of those parameters on the results.
Impact of depressurization timing
The depressurization timing is varied on a 30-min time interval, starting from 3 h to 5 h. The starting point is determined by considering the entry of SAM (2.5 h) with the operator’s action time margin of 0.5 h for opening the POSRVs. The impact of depressurization timing is assessed by analyzing a total of five cases (A01 to A05) because the vessel failure occurs after 5 h, which corresponds to the POSRV opening time of A05.
Impact of injection timing and flow rate
The injection timing may be started from the SAM entry point all the way to the reactor vessel failure. The fastest injection is initiated 1 hour following the SAM entry, to account for the time margin required to open the POSRV, confirm the RCS depressurization, and align the FLEX portable pump for the external injection.
To determine the ranges of injection flow, Equationequation (1)(1)
(1) is used to calculate the flow rates in consideration of the heat removal by the vaporization, the saturation, and the subcooling of the injected water, respectively [Citation14].
where W is the water injection flow rate, Q̇0 is the decay power level before shutdown, t is the time elapsed since shutdown, cPw is the water specific heat, ∆Tsub is the difference between the saturation temperature at the RPV pressure and the water injection temperature, and h is the enthalpy of gas (g) and fluid (f), respectively.
The temperature of the injected water is assumed to be 311 K (100 °F) as the initial condition. For the minimum flow rate, the injected water is assumed to change completely to vapor. If the subcooling of the incoming water in Equationequation (1)(1)
(1) is ignored, about 10 kg/sec is determined as the minimum required value. Alternatively, if only sensible heat removal is allowed (ignoring the enthalpy change term in Equationequation (1)
(1)
(1) ), 30 kg/sec is required to cool the core by single-phase flow. For sufficient subcooling margin, 50 kg/sec is considered as the maximum flow rate in this analysis. NEI report [Citation15] proposes the use a commercial pump that can supply up to 50 kg/sec for the in-vessel injection using FLEX strategy.
It is assumed that the on-site water resources are available for each flow rate during the implementation of the in-vessel injection strategy.
Assessment of phenomenological uncertainties
The most important phenomenon during the in-vessel phase is the core melting and relocation process given their potential impact on reactor vessel integrity. Therefore, it is necessary to examine the uncertainty about the parameters affecting these phenomena. The MAAP5 manual [Citation9] suggests that users adjust 30 parameters to evaluate the impact of the uncertainties in the phenomena after the core damage for the level 2 PRA sequence analysis. The details for these parameters are addressed in Appendix A. Among these parameters, four parameters are selected considering the importance in the core melting and relocation process as followings.
EPSCUT, which is the cutoff porosity below which the flow area and the hydraulic diameter of a core node are zero.
TCLMAX, which is the temperature that will lead to cladding rupture.
FZORUP, which is the minimum fraction of Zr that must be oxidized to keep the cladding intact if the cladding is at TCLMAX.
FGBYPA, which is a flag to divert gas flows in the core to the bypass channel when an entire axial row in the core is completely blocked.
MAAP5 simulates the melting process as a progression across five different configurations (types 1 to 5), each having a characteristic shape, porosity, and surface area as shown in . As the type number increases, the porosity and the flow area decrease. While type 1 denotes an intact fuel rod, type 2 denotes a collapsed fuel rod, type 3 denotes a thickened fuel rod due to downward relocation, type 4 is no longer considered a fuel rod nor penetrable, and type 5 means the debris has completely molten.
Figure 4. Types of solid core geometry during melt progression [Citation9].
![Figure 4. Types of solid core geometry during melt progression [Citation9].](/cms/asset/7429de26-8bef-475d-8c84-cfaa2bfc4d1f/tnst_a_1483844_f0004_b.gif)
When the core melting begins, the mass of each core node moves gradually to the bottom (candles down). When the porosity of the core node becomes 0.1, which is the default value obtained by benchmarking the TMI accident in MAAP5, the node becomes a block node, which is no longer mass transferable, as type 4 [Citation16]. Therefore, changing this cutoff porosity value (EPSCUT in MAAP5) can affect the core melting and relocation process. The default value of EPSCUT is 0.1, the minimum value is 0, and the maximum value is 0.25 according to MAAP5 manual.
The clad rupture also affects the core melting and relocation process. When the clad temperature reaches 2500 K, clad rupture occurs. After clad rupture, relocation to the vessel lower plenum through the bypass region or downcomer occurs radially in the blocked node as shown in .
Figure 5. Breach of side crust of molten pool [Citation9].
![Figure 5. Breach of side crust of molten pool [Citation9].](/cms/asset/75780eef-2be6-4d5a-a8e1-de814f1dddeb/tnst_a_1483844_f0005_b.gif)
TCLMAX is the threshold temperature used to initiate the cladding rupture in MAAP5. The default value of this variable is 2500 K, the minimum value is 2200 K, and the maximum value is 2700 K.
FZORUP is the minimum fraction of Zr that must be oxidized to keep the cladding intact if the cladding is at TCLMAX. The increase in the fraction represents the fact that the oxide layer strength decreases as its temperature increases. The cladding will rupture if the cumulative damage fraction is greater than 1 and the fraction of Zr that has oxidized does not meet the minimum required by FZORUP and the temperature factor. The default value of FZORUP is 0.7, the minimum value is 0.0, and the maximum value is 1.0.
FGBYPA is a flag to divert gas flows in the core to the bypass channel when an entire axial row in the core is completely blocked. When FGBYPA = 1, all channel gas flows are diverted to the bypass channel if all of the fuel channels are blocked due to a core melt progression. Once the gas is diverted, it flows up through the bypass without reentering the fuel channels. This mitigates the amount of hydrogen that is generated in the core due to steam upflow. When FGBYPA = 0, all channel gas flow will reappear above the blocked axial location if all of the fuel channels are blocked due to core melt progression. Upon reentering the fuel channels above the blocked row, the gas continues to travel upward through the channels. This increases the amount of hydrogen that is generated in the core due to steam upflow. The default value of FGBYPA is 1.
A sensitivity study is therefore conducted to estimate the impact of these four parameters on the model predictions.
Results
The results are largely classified into three categories. The first is the result of the depressurization timing, and then determines the best scenario to perform the in-vessel injection strategy. The second is the result of considering the scenario variations of the flow rate of the injection timing of the in-vessel injection. Here we set the success criteria for the in-vessel injection strategy and obtain the core melting and relocation information under these conditions. The third is the parameter sensitivity analysis. In the first and second, we confirm the uncertainty of the scenario variations, and finally confirm the phenomenological uncertainty.
Effect of depressurization time on core relocation behavior
As discussed earlier, the depressurization timing is an important parameter affecting the relocation behavior. A sensitivity analysis was therefore conducted using MAAP5 code to assess the impact of this parameter on the model predictions. summarizes the key findings for different depressurization timing. The first column indicates the SAM entry, TSA. The second column is the timing of depressurization, TDP, using POSRVs with an interval of 0.5 h. The third column shows the injection time, TSI, of the safety injection tank (SIT). The fourth column lists the first core relocation time, TRL, slumping to the lower plenum of the RPV. Comparing the SIT injection time to the time of first relocation, it can be seen that the SIT flow alone cannot prevent the first core relocation, which reflects the loss of core integrity. Columns seven and eight represent the molten mass in the core, MCR, and lower plenum, MLP, respectively.
Table 2. Analysis results according to depressurization timing
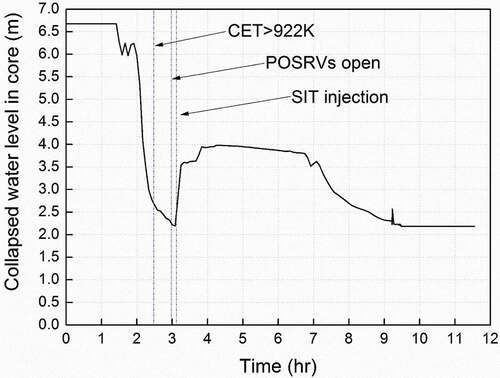
For case A01, depressurization is carried out at 0.5 h after SAM entry. The model predicts the time of the first relocation to the lower plenum of the RPV to be 8.2 h and the vessel failure to be 11.1 h. This case marks the slowest accident progression in terms of the first relocation and vessel failure. Additional cooling water injection is required since the recovery of core water level due to SIT injection is incomplete as shown in .
Figure 6. Water level in core for A01 case.
A02 to A05 cases are depressurized at 1 h to 2.5 h, with 0.5-h interval after SAM entry. For these cases, SIT injection time is delayed and the time to cool the core is insufficient as the depressurization is performed later. Accordingly, the progression of the accident is faster for these cases.
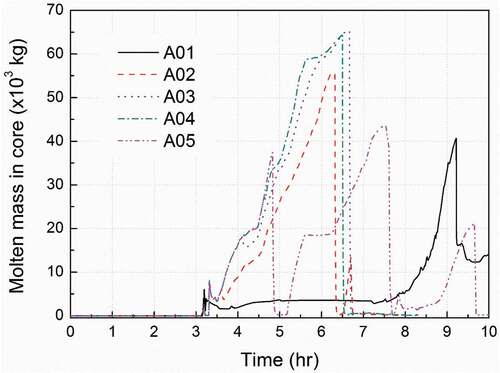
The sixth column in is the maximum mass of the melt produced in the core, MCR. With delayed depressurization, the maximum mass of melt produced in the core increases from ~ 40 × 103 kg for case A01 to ~ 66 × 103 kg for case A03 and then decreases to ~ 43 × 103 kg for case A05. shows the molten mass inside the core over time but there is no consistent trend.
Figure 7. Molten mass in core for cases A01 to A05.
The seventh column is the total mass of melt accumulated in the lower plenum of the RPV, MLP, due to the failure of the core bottom plate or the sidewise relocation until the vessel fails. Again, the smallest value is predicted for case A01; however, no specific trend can be inferred from the simulated cases.
The eighth and ninth columns indicate the time of the first relocation and the vessel failure measured from SAM entry. The late opening of POSRV shortens the time available for operators to take action and also increases the amount of melt in the RPV lower plenum, which is disadvantageous from a coolability perspective. It could be inferred from these results that the early depressurization is desirable because it can delay the first relocation. Therefore, it is recommended to open the POSRVs within 30 min after SAM entry.
Effect of in-vessel injection on core relocation
Core relocation may also be impacted by the amount and timing of in-vessel injection. A sensitivity analysis is therefore conducted using A01 as a base case. Three injection flow rates of 10, 30, and 50 kg/sec are examined. The effect of injection timing is investigated for each of the aforementioned flow rates. First, 10 kg/sec injection cases are examined (B series). For case B01, it is assumed that the injection can begin 1 h into SAMG entry or 30 min after the depressurization condition. The injection timing is then increased by 1 h for cases B02 to B05 and by 30 min for cases B06 to B12. shows the results of the analysis for the injection flow rate of 10 kg/sec.
Table 3. Analysis results according to in-vessel injection timing with flow rate of 10 kg/sec
When a flow rate of 10 kg/sec is injected before the first relocation in A01, the first relocation slumping to the lower plenum of RPV does not occur for 72 h. As the core materials begin to melt inside the core, the molten mass gradually increases. For cases B01 to B06, the maximum amount of melt accumulated in the core is less than 8 × 10³ kg. Most of the molten material resolidified and only 1.4 × 10³ kg or less of the melt is present in the core at 72 h. shows the amount of the melt generated in the core with 10 kg/s injection rate initiated at different timings, but before the first relocation to the lower plenum. B07 and B08 cases show that larger amount of the melt is generated in the core (50.5 × 10³ kg and 67.9 × 10³ kg, respectively) compared to other cases (B01 to B06) for which only 6 × 10³ kg to 8 × 10³ kg are predicted.
Figure 8. Molten mass in core for cases B01 to B08 (with in-vessel injection before the first relocation to lower plenum).
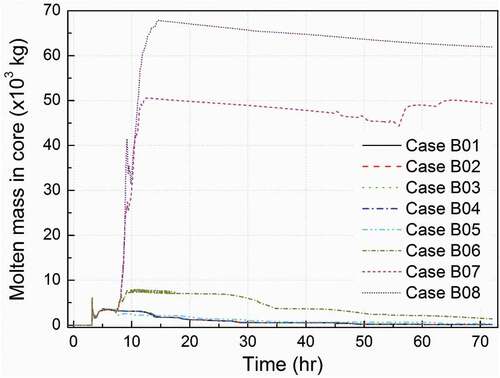
This is attributed to the prediction (or the lack of) type 5 nodes in the core. According to MAAP5, existence of type 5 core node indicates a fully molten mass. The sooner the in-vessel injection is implemented, the less likely it is that a type 5 node will occur (cases B01–B06).
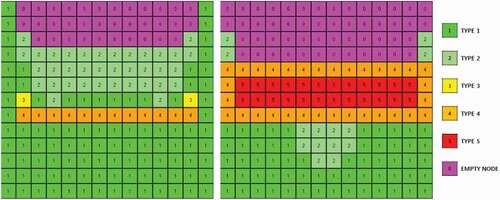
shows the configurations of the core node at 72 h for cases B05 and B08. In contrast to case B05, for B08 with late in-vessel injection, the molten mass is relatively large with a number of completely melted (type 5) nodes.
Figure 9. Core node map at the end of simulation for case B05 (left) and case B08 (right).
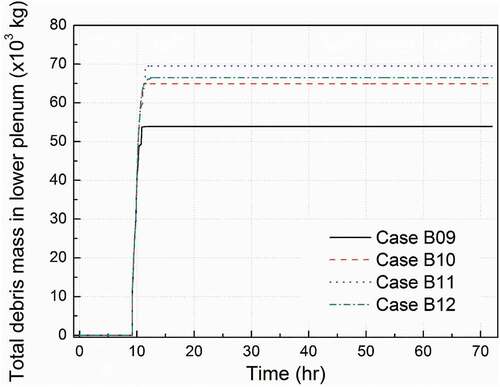
In contrast, B09 to B12 cases, where the in-vessel injection is deployed after the occurrence of the first relocation, exhibit lesser amount of melt accumulation in the core (40.7 × 10³ kg). This is attributed to the fact that some of the molten material created in the core had already been relocated to the RPV lower plenum. shows the melt accumulated in the lower plenum and retained for 72 h without further change.
Figure 10. Total debris mass in RPV lower plenum for cases B08 to B11 (in-vessel injection after the first relocation to lower plenum).
and show the results of 30 kg/sec (C series) and 50 kg/sec injection rates (D series), respectively. As the injection flow increases, the melt cooling becomes more effective, so the maximum mass of melt accumulated in the core becomes less as depicted by C07, C08, D07, and D08. The total debris mass accumulated in the lower plenum also decreases as depicted by C09 to C12 and D09 to D12 cases.
Table 4. Analysis results according to in-vessel injection timing with flow rate of 30 kg/sec
Table 5. Analysis results according to in-vessel injection timing with flow rate of 50 kg/sec
Comparison for the molten mass in the RPV lower plenum
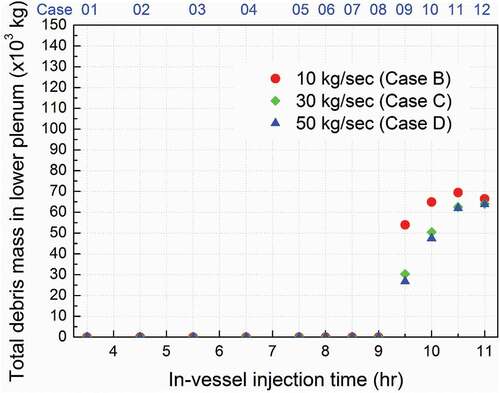
The molten masses accumulated in the RPV lower plenum for all cases of the in-vessel injection analysis are summarized in . No relocation is predicted for cases B01 to B08. Melt relocation is observed for cases B09 to B12 with much delayed injection. For these latter cases, the lowest injection flow rate yields a maximum mass of about 70 × 103 kg of melt, while about 64 × 103 kg is observed for C and D cases with higher injection rates.
Figure 11. Total debris mass accumulated in lower plenum as a function of timing for different in -vessel injection flow rates.
Input parameter sensitivity analysis
A sensitivity analysis is performed to assess the impact of model input parameters on the amount of melt accumulated in the RPV lower plenum and the occurrence of reactor vessel failure. EPSCUT, TCLMAX, FZORUP, and FGBYPA, as representative variables affecting the core melting and relocation process, are examined. For B01 to B12 cases, sixteen sensitivity analyses are conducted by changing EPSCUT from 0.00 to 0.25 with a step of 0.05, keeping other parameters at the default values. TCLMAX has been varied from 2200 K to 2700 K with a step of 100 K and FZORUP has been varied from 0.0 to 1.0 with a step of 0.25. Additionally, FGBYPA has been varied from the default value of 1 to 0, keeping other parameters at the default values since it is a flag-type parameter. The sensitivity of the debris mass accumulated in the RPV lower plenum to these parameters is shown in . The accumulated mass generally increases as the in-vessel injection timing is delayed; however, the spread can be significant for different uncertainty parameter values. Unlike the base cases, the sensitivity study predicts the first relocation to the lower plenum for B06, B07, and B08. In accordance with the base case, B01 to B05 exhibit no relocation to the lower plenum irrespective of the values of EPSCUT, TCLMAX, FZORUP, and FGBYPA. No specific tendency can be derived but the results show the phenomenological uncertainty.
Figure 12. Debris mass changes in sensitivity analysis.
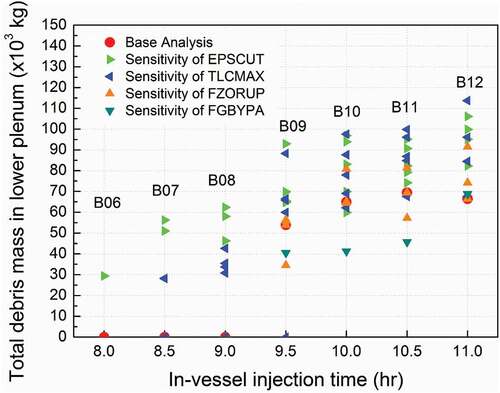
Considering those uncertainties, it is necessary to initiate the in-vessel external injection within 7.5 h (5.0 h after entry of a severe accident) to maintain the RPV integrity without the first relocation to the lower plenum.
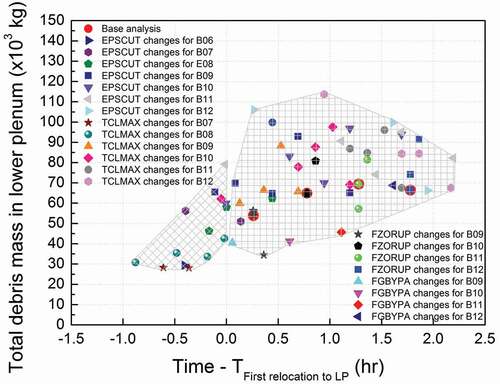
The success region for the external injection flow rate and timing is shown in . It is given that the POSRVs are opened within 30 min after the entry to SAM. The first relocation to the RPV lower plenum is not observed if injection is initiated within 5.0 h after the entry to SAM at flow rates ranging from 10 to 50 kg/sec. The phenomenological uncertainties considered indicate that 1.5 h of uncertainty regions of the core relocation.
Figure 13. Success region for in-vessel injection without the first relocation to the RPV lower plenum.
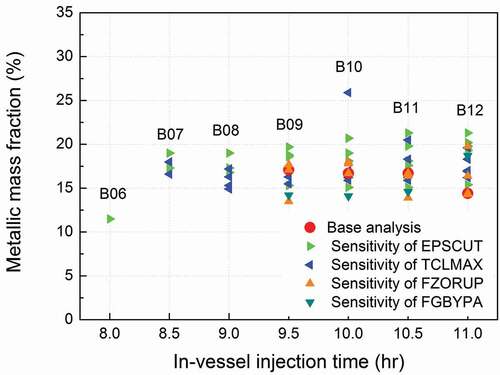
The mass fraction of metallic layer in the RPV lower plenum is shown in . It ranges from 14% to 22% in general.
Figure 14. Metallic layer mass fraction in RPV lower plenum.
Changing the sensitivity parameters changes the time of the first relocation to the RPV lower plenum. is another representation of the data presented in . shows the total debris mass in the lower plenum as a function of the time of the first relocation, taken the uncertainty parameters into consideration. If the in-vessel injection is initiated before the first relocation, the total debris in the lower plenum ranges from 28 × 103 kg to 80 × 103 kg. On the other hand, if the in-vessel injection is initiated after the first relocation, the debris mass in the lower plenum ranges from 34 × 103 kg to 114 × 103 kg. The original total mass of core material remaining in core is 121 × 103 kg, and the maximum 94.2% of core material can be melted inside core considering 114 × 103 kg of molten debris.
Figure 15. Total debris mass as a function of the time of the first relocation.
Summary and conclusions
In this study, a sensitivity study is performed to the in-vessel phase of SAM for a Korean 1000 MWe NPP using ROAAM+ framework. The selected scenario is SBO with RCS depressurization followed by in-vessel external injection. The impacts of injection timing and flow rate as well as the uncertainties associated with the core melting and relocation process have been examined. The main conclusions that could be drawn from this work are summarized as follows:
In order to implement the in-vessel phase of SAM strategy, it is recommended to open the POSRVs within 30 min after the entry of a severe accident.
If the external injection with the flow rate of more than 10 kg/sec into the vessel performed within 5.0 h after the entry of a severe accident, the molten mass is retained in the core. The first relocation to the RPV lower plenum has not occurred.
When the reactor vessel integrity is maintained by the in-vessel injection within 5.0 h, the maximum amount of melt accumulated in the RPV lower plenum is about 114 × 103 kg.
The derived in-vessel injection strategy and the information on core melting and relocation may be used as the initial conditions for the next phase of SAM evaluation such as ERVC and the ex-vessel phase in the future.
Acknowledgments
This study was supported by the 2017 research fund of the KEPCO International Nuclear Graduate School (KINGS), Republic of Korea.
Disclosure statement
No potential conflict of interest was reported by the authors.
References
- Theofanus TG. On proper formulation of safety goals and assessment of safety margins for rare and high-consequence hazards. Reliability Eng Syst Saf. 1996;54:243–257.
- Kudinova P, Galushina S. A framework for assessment of severe accident management effectiveness in nordic BWR plants. PSAM 12; 2014 June; Hawaii (USA).
- Westinghouse. Status report 81 - Advanced Passive PWR (AP 1000). IAEA; 2011.
- Gidropress. Status report 93 - VVER-1000. IAEA; 2011.
- AREVA NP & Mitsubishi Heavy Industries. Status Report - ATMEA1TM. IAEA; 2015.
- KEPCO & KHNP. Status Report 103 – Advanced Power Reactor (APR1000). IAEA; 2011
- KEPCO & KHNP. Status report 83 - Advanced Power Reactor 1400 MWe (APR1400). IAEA; 2011.
- KEPCO & KHNP. Chapter 19 Probabilistic Risk Assessment and Severe Accident Evaluation. NRC; 2014.
- Fauske & Associates, LLC. Transmittal document for MAAP5 code revision MAAP 5.04. EPRI; 2016.
- Westinghouse Electric Company, “APR 1400 RCP seal design and ELAP capability,” APR1400-A-M-EC-14002-NP, 2014.
- KHNP. Severe accident management guidelines for shin-kori 3&4. KHNP; 2011.
- Yun J, Kim T, Kim J. Verification of SAMG entry condition for APR1400. Ann Nucl Energy. 2015;75:404–412.
- Nuclear Energy Institute. Diverse and flexible coping strategies (FLEX) implementation guide. NEI; 2015.
- EPRI. Severe accident management guidance technical basis report. EPRI; 2012.
- Engineering and Research, Inc. B.S.b phase 2 & 3 submittal guideline. NEI; 2006.
- EPRI. Modular accident analysis program (MAAP) – MELCOR crosswalk. EPRI; 2014.