
 ?Mathematical formulae have been encoded as MathML and are displayed in this HTML version using MathJax in order to improve their display. Uncheck the box to turn MathJax off. This feature requires Javascript. Click on a formula to zoom.
ABSTRACT
We developed an all-sky Compton camera for the detection of sub-MeV gamma rays emitted by radioactive cesium in high-dose environments. The camera consisted of six NaI (Tl) scintillators with a diameter of 1/2 in (1.3 cm) placed symmetrically at the vertexes of an octahedron. Irradiation tests with a point-like source at a high-dose irradiation facility confirmed that the camera can measure the arrival directions of sub-MeV gamma rays and visualize a gamma-ray source distribution in environments of up to 1 mSv/h. Due to the symmetrical geometry of the camera, the directional variance of its acceptance fell within
23% (full width) of the average value. The camera capability to detect gamma rays in high-dose environments, in which multiple and/or extended sources exist, was verified in environments of up to
0.2 mSv/h by tests at the Fukushima Daiichi nuclear power plant. The imaging capability was confirmed also in lower dose environments such as 1
Sv/h for a reasonable observation time of 2 h, indicating that the developed camera is adequate for practical use in environments with a wide dynamic range of dose rate (
200 times), i.e. from 1
Sv/h to 0.2 mSv/h.
1. Introduction
The Fukushima Daiichi nuclear power plant (hereinafter referred to as ‘1F’) was seriously damaged in 2011 by the Great East Japan Earthquake. Its decommissioning is ongoing and scheduled to be completed in 30–40 years. However, the dose rate within the plant is still high after 7 years. Even in its surroundings, the dose rate ranges between 1 Sv/h and
0.1 mSv/h.Footnote1 Therefore, the working time for the staff of the plant is limited. Presently, the high radiation levels are mainly due to the radioactive cesium isotopes
Cs and
Cs from the nuclear power plant itself; their long half-lives (30 and 2 years, respectively) represent a problem. Decay of these isotopes produces gamma rays at sub-MeV energies (0.662 MeV by
Cs, 0.605 and 0.796 MeV by
Cs). If the arrival directions of sub-MeV gamma rays from all directions could be measured simultaneously even under high-dose environments, it would be possible to decrease the radiation exposure. In the presence of significant radiation from nearby sources, i.e. when the distance from the detector is less than the scattering length in air of gamma rays emitted by radioactive cesium,Footnote2 the location of the different sources around a measurement position can be identified at one time, accelerating the decontamination. Alternatively, if the distance of these sources from the detector is comparable to or greater than the scattering length, scattered gamma rays are expected to be dominant, resulting in a featureless continuum spectrum. Even in such a case, measuring the directions of scattered gamma rays provides useful information for decreasing the radiation exposure due to these scattered gamma rays, e.g. by shielding against them, and decontamination policy. Thus, we developed an all-sky sub-MeV gamma-ray camera that can work in environments where the dose rate can range from 1
Sv/h to
0.1 mSv/h.
We selected a Compton camera (e.g. [Citation1–Citation4]) because it allows the measurement of the gamma-ray distribution over a wide field of view without any heavy shielding or collimator as required in pinhole cameras (e.g. [Citation5–Citation7]) and coded aperture gamma cameras (e.g. [Citation8-Citation10]); this helps to reduce the detector weight. Its working principle relies on Compton scattering [Citation11], which is dominant in the range between a few hundred keV and several MeV in most of materials.
Some Compton cameras have been reported as all-sky Compton cameras, such as the spectroscopic imager for -rays [Citation12]. The imaging system is a conventional two-layer Compton camera that utilizes a double-sided segmented planar germanium detector; the detection efficiency largely varies according to direction especially in the equatorial plane. Lee et al. (2011) [Citation13] designed a Compton camera consisting of six CsI (Na) planar scintillators arranged in a cubic shape; each scintillator consisted of 20
20 pixels, each one 2
2
5 mm in size, and was coupled to a multi-anode photomultiplier tube (PMT). They did not discuss the directional variation of the acceptance in the article. Another type of all-sky Compton camera is the Polaris-H imaging system, which uses a pixelated CdZnTe (CZT) detector [Citation14]. The interaction depth is determined by the drift time of the electron cloud and/or by the cathode to anode signal amplitude ratio, which results in a three-dimensional position-sensitive detector. However, because of its geometry, the detection efficiency at 0.662 MeV varies by less than a factor of two in all directions. A directional variation of the acceptance within 20–30% would be preferable for a detailed directional comparison of radiation intensities.
In this article, we describe the development of an all-sky Compton camera, called ‘I octahedron’ for high dose, with an almost isotropic acceptance and based on our previous study [Citation15] of a Compton camera using inexpensive CsI (Tl) inorganic scintillator cubes. The detection capability for gamma rays in high-dose environments was verified by tests at a high-dose facility and under various dose-rate environments, including 1F.
2. Materials and methods
2.1. Compton camera
A Compton camera typically includes scatterers in the first layer and absorbers in the second layer as shown in ).
Figure 1. Schematic view of a Compton camera. (a) A typical Compton camera includes scatterers in the first layer and absorbers in the second layer. These scatterers and absorbers can measure the energies of recoil electrons and photoelectrons. Most of the incident gamma rays are reflected by Compton scattering in the first layer and then absorbed by photoelectric effect in the second layer, or vice versa in the case of backscattering. (b) Our designed Compton camera. Six scintillators are placed symmetrically at the vertexes of an octahedron to obtain uniform acceptance and angular resolution in all directions with a small number of elements.
These scatterers and absorbers can measure the energies of recoil electrons and photoelectrons. Most of the incident gamma rays are reflected by Compton scattering in the first layer and then absorbed by photoelectric effect in the second layer. If we measure the energy depositions of both interactions, we can use Compton kinematics [Citation11] to calculate the scattering angle of the incoming gamma rays as follows:
where , and
denote the energy of the recoil electron in the scatterer, the energy of the scattered gamma-ray photon in the absorber, the scattering angle, the electron mass, and the speed of light, respectively. The location of the radiation source is then derived by backprojection using a smeared ring with the angular resolution of the detector. In the case of a single source, the position of the radiation source can be determined by accumulating at least three reconstructed rings.
2.2. Concept of an all-sky camera for high-dose environments ( I octahedron for high-dose)
In a previous study, we developed a Compton camera using inexpensive CsI (Tl) inorganic scintillator cubes with a side of 3.5 cm to achieve low-cost high-sensitive measurements of low-level contamination (i.e. below 30 Sv/h) [Citation15]. The functioning of such camera in higher dose-rate environments is prevented by signal pileups in the crystals due to the slow scintillation decay of CsI (Tl) crystals. We thus replaced these crystals with NaI (Tl) scintillator cylinders, whose decay time is a quarter of that of CsI (Tl). A smaller diameter, 1/2 in (1.3 cm), was also adopted to allow operation in environments with a dose rate up to
0.1 mSv/h. Six NaI (Tl) crystals were placed symmetrically at the vertexes of an octahedron as shown in ). This geometry facilitates uniform acceptance and angular resolution in all directions even with just a few scintillators, reducing the detector size, weight, and cost. The side length of the octahedron was set at 4.5 cm to obtain a moderate angular resolution of
12° and a reasonable sensitivity along with a reduced observation time. In summary, the major differences from the previously designed camera [Citation15] are (1) the capability to visualize gamma rays in higher dose-rate environments (between 30
Sv/h and
0.1 mSv/h) and (2) a wider field of view (from
30
to all directions).
2.3. Scintillation detector and electronics
The scintillation photons produced in each scintillator are measured with a PMT assembly (H11432-100; Hamamatsu Photonics K. K.) having a Cockcroft–Walton high-voltage power supply installed inside it. A PMT and a scintillator are connected using optical coupling grease (EJ-550; ELJEN Technology, Sweetwater, TX, USA). The scintillation counters are shielded from external light with black sheets. The PMT output is charge integrated, amplified, and differentiated by an operational amplifier (AD8009; Analog Devices, Norwood, MA, USA) with a voltage gain of 30 and shaped to
3
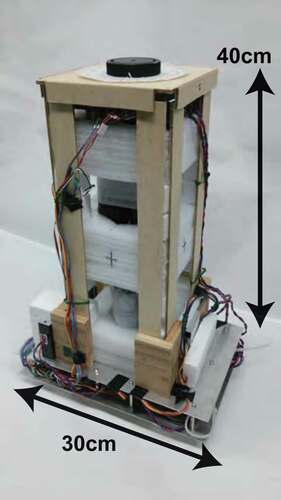
s. Then, the signals are fed into a 16-channel flash analog-to-digital converter (ADC) board with SiTCP technology [Citation16] (developed by the KEK Open-It project) to digitize their waveforms (sampling speed of 2.5 MHz), which are successively sent to a field-programmable gate array (FPGA). When two or more hits are above some threshold coincidently, a gate signal is generated and the waveform data stored in the FPGA registers are transferred to a PC via Ethernet. Power for the PMTs and the electronics is supplied by a lithium battery after DC–DC conversion with a noise-reduction circuit. shows a picture of the designed camera (30 cm
20 cm
40 cm, 2.5 kg).
Figure 2. I octahedron high-dose camera.
2.4. Calibration and analysis method
We first measured the electrical noise for each detection counter (typically 1 keV) by random triggers, which are triggers generated randomly to obtain their amplitudes unbiasedly, and set a trigger threshold for each counter. Then, we performed the energy calibration by using gamma-ray lines from radioactive cesium. shows the energy spectra of radioactive cesium contained in the soil collected at Fukushima.
Figure 3. Energy spectra of radioactive cesium in soil collected at Fukushima. The horizontal axis indicates the ADC channels. (A) Raw energy spectrum. (B) Background-subtracted signal estimated using the algorithm of Morhac et al. [Citation17]. The ADC channels corresponding to the energy of the gamma-ray lines are obtained by fitting with triple Gaussian functions. The solid line is the best-fitted curve.
![Figure 3. Energy spectra of radioactive cesium in soil collected at Fukushima. The horizontal axis indicates the ADC channels. (A) Raw energy spectrum. (B) Background-subtracted signal estimated using the algorithm of Morhac et al. [Citation17]. The ADC channels corresponding to the energy of the gamma-ray lines are obtained by fitting with triple Gaussian functions. The solid line is the best-fitted curve.](/cms/asset/ab757823-0a24-487e-be27-828dcc9df9ef/tnst_a_1485598_f0003_b.gif)
The background was subtracted from the raw spectra using the algorithm of Morhac et al. [Citation17]. The calibration factors were obtained by fitting with triple Gaussian functions corresponding to three gamma-ray lines from radioactive cesium. The energy resolutions () of our counters were 4 keV and 25 keV for 32 keV X-rays and 0.662 MeV gamma rays, respectively.
Then, we calculated the timing of the signal peaks to reduce accidental coincident events; first, we selected the events with two hit counters, which in this case are the candidate events in which a gamma ray undergoes a Compton scattering in a crystal and subsequent photo-absorption in a different crystal within the online time window. The distribution of the time lag between two counters is shown in .
Figure 4. Distribution of time lag between the signal peak timings of hit counters. The data were obtained at a high-dose facility, where the dose rate at the detector was 300 Sv/h. We selected the on-timing events within
80 ns shown by the solid arrow. The dotted arrows indicate the off-timing regions due to accidentally coincident events, which were used for background subtraction from the on-timing region.
We selected gamma-ray events within a time lag of 80 ns (on-timing region). The flat component (off-timing region), where two hits have no time correlation, should be due to accidentally coincident events. The events from the off-timing region are subtracted as background from the on-timing region during the reconstruction of the arrival directions of the gamma rays. The reconstruction method is described in the last part of this subsection.
The total energy spectrum of Cs is shown in .
Figure 5. Total energy spectrum of Cs obtained with our detector. The energies were obtained by summing the energies deposited in each counter that are above the threshold. Since this analysis was carried out after the timing analysis, the effects of the off-timing events were removed.
The spectral components below the peaks were considered the scattered events. We selected the events around 0.605, 0.662, and 0.796 MeV. When the scattered gamma rays were dominant, such as for 1F as described in Subsection 3.2, we carried out the reconstruction analysis for all of the events.
After the above selection, the gamma-ray events were finally reconstructed by the backprojection method. In this experiment, the geometrical alignment of the scintillators determines the angular resolution of the detector. The maximum angular uncertainty due to the geometrical effect was estimated to be roughly 8. To maintain the angular resolution, we adopted a Gaussian profile with
as the cross-section of a ring for the detector, which is slightly smaller than the above estimation. We verified that this value provides a good angular resolution by performing the analysis using Gaussian profiles with different widths. The on-timing gamma-ray image can be deformed by events with accidentally coincident hits, which correspond to the flat component in . The effect from the flat component included in the on-timing events can be evaluated by the off-timing events because they are randomly produced independently of time. Thus, we can suppress such deformation by subtracting the reconstructed image obtained by the off-timing events from that given by the on-timing events.
3. Results and discussion
3.1. Performance tests at high-dose facility
To investigate the performance of the designed camera in high-dose environments, we carried out irradiation tests at the high-dose irradiation facility of Fuji Electric Co., Ltd., where 0.662-MeV gamma rays were radiated from a single brilliant Cs source. The dose rate at the detector could be adjusted precisely by moving a stage. shows a gamma-ray image from a test with a dose rate of 1 mSv/h at the front of the detector.
Figure 6. A gamma-ray image superimposed on the optical image obtained at the high-dose irradiation facility of Fuji Electric Co., Ltd. The 0.662-MeV gamma rays were radiated from a single brilliant Cs source. The optical image was taken with a RICOH THETA camera (all-sky optical camera). The figure is shown in equirectangular projection. The observation time was 3 min. The red mosaic indicates the gamma-ray distribution over 85% of the peak value, where the mean value over the whole field of view was set to 50%. The dose rate at the front of the detector was 1 mSv/h.
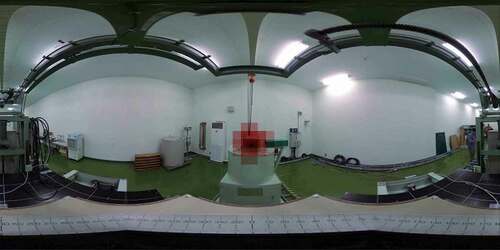
We confirmed that the detector can visualize a gamma-ray source in environments up to 1 mSv/h. In this experiment, the high-dose rate was mimicked by a single, brilliant, point-like radioactive source. When we applied an image sharpening technique based on a filtered backprojection algorithm [Citation18] for a compact source with a high-pass filter of 7
, the angular resolutions (
) for 0.662-MeV gamma rays were measured to be 13
and 12
for the azimuth and elevation direction, respectively. In this technique, the rings used in backprojection smears with a Mexican-hat type (triple Gaussians) profile instead of a single Gaussian, which filters out low frequency, i.e. large-size image, information. Without the filter, the angular resolutions were 33
for both directions.
The directional dependence (non-uniformity) of the acceptance was also determined at the facility as shown in .
Figure 7. Directional dependence (non-uniformity) of the acceptance of our developed camera for 0.662-MeV gamma rays radiated from Cs. The vertical axis shows the number of selected two-hit events at an energy of 0.662 ± 0.040 MeV.
We carried out tests for only part of directions, given the geometrical symmetry of our detector. The number of data points per solid angle required to scan the sphere isotropically is smaller at high elevation angles than at low ones. The average detection efficiency was 0.30 cps/(Sv/h). The directional variance of the acceptance was within
23% (full width) of the average value due to the symmetrical geometry of the detector. The acceptance at large elevation values decreases systematically due to the interactions of gamma rays and the PMTs, which are placed between the scintillators and the gamma-ray sources.
3.2. Verification tests at 1F
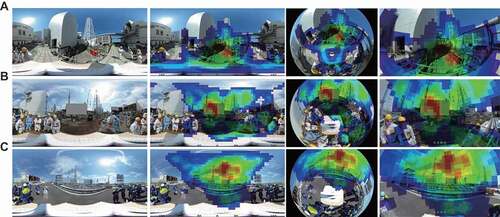
To demonstrate the capability to visualize gamma rays from multiple and/or extended sources, we carried out verification tests at 1F on September 1 and 2, 2016. The gamma-ray images were superimposed on the optical images, as shown in . In this case, we did not use an image filter because the distributions were expected to be extended.
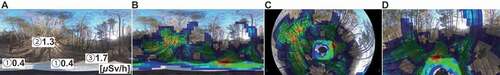
Figure 8. Gamma-ray all-sky images superimposed on optical images of the Fukushima–Daiichi nuclear power plant. The figures in the first column from the left show only the optical images. The figures in the first and second columns from the left use equirectangular projection; those in the third and fourth columns use stereographic projection. The figures in the fourth column are zoomed versions of those in the third column. The observation time was 30 min for each. The 50–70%, 70–85%, and 85–100% levels are shown by the color contours in blue, green and red, respectively, where the mean value over the whole field of view was set to 50%. (A) South of 1F Unit 4, where the average dose rate is 80 Sv/h. There is a known hot spot with a dose rate of 1 mSv/h in the center of the figure. We only used events consistent with the total energies of 0.605, 0.662, and 0.796 MeV. (B) 100 m west from 1F Unit 3, where the average dose rate is 200
Sv/h and the dominant events are scattered gamma rays. Here, we used events in all energies. The 1F Unit 3 building in the optical image is filled with a gray box. (C) 150 m west from 1F Unit 2, where the average dose rate is 70
Sv/h. The same analysis was applied as for (B). The extended emissions in the sky around the units in (B) and (C) are explained by the fact that gamma rays coming from the units are scattered by molecules in the air and/or the buildings’ walls before they reach the detector, which is often referred to as skyshine.
There were three observation points, A, B, and C. The observation time was 30 min for each point. The images with roughly the same spatial distribution were obtained from 3-min data for point A (dead time of 3%) and from 15-min data for points B and C (dead times of 58% and 39%, respectively). The dead times were due to the data transfer speed of the online computer. Point A is somewhere in the south of 1F Unit 4, where the average dose rate is 80 Sv/h. There was a known hot spot 20 m ahead of the detector with a dose rate of 1 mSv/h. We only used events with total energies consistent with
Cs and
Cs, for which the energy range is within
40 keV around each line energy. The energy spectrum is shown in (A).
Figure 9. Gamma-ray energy spectra at observation points A, B, and C at the Fukushima–Daiichi nuclear power plant. The number at the top of each graph is the distance between the detector and the radiation source: (A) a known hot spot; (B) 1F Unit 3; (C) 1F Unit 1 and 2.
To improve the angular resolution, we adopted the energy-constraint technique [Citation15], which is based on the fact that if the energy of the gamma ray is known, the scattering angle of an incoming gamma ray can be determined by Compton kinematics using the energy with the smaller uncertainty of the two measured ones deposited by Compton scattering in a crystal and subsequent photo-absorption in a different crystal. We assume that the total energy deposits were exactly 0.605, 0.662, and 0.796 MeV, as expected from the radioactive cesium. Extended hot spots were clearly detected and the distribution was consistent with the previous surveymeter’s measurements. The image of point B was shot at about 100 m west from 1F Unit 3, where the average dose rate at the detector is 200 Sv/h. This time, we did not use the energy-constraint technique because the gamma-ray lines were not evident, as the scattered gamma rays were dominant, as shown in (B). This is explained by the fact that gamma rays coming from the unit are Compton scattered by molecules in the air and/or the building’s walls; hence, they lose part of their energy before reaching the detector. Normally, in the area contaminated by radioactive cesium, in situ calibration can be carried out anywhere. This time, however, we performed the calibration by
Cs-RI-source data obtained in the laboratory due to the dominant scattered gamma rays in the in situ data collected near the 1F units. The strongest emission comes from 1F Unit 3. Also, there seems to be an extended emission in the sky around this unit, which is due to air scattering and referred to as skyshine (e.g. [Citation19,Citation20]). Since small-angle scatterings are dominant at the energy of
0.662 MeV, the skyshine of the gamma-ray image appears as a halo. Observation point C was at about 150 m west of 1F Unit 2, where the average dose rate is 70
Sv/h. Again, the line was not clear. Thus, the analysis used for the data of point B was applied also to the data of point C. The skyshine is more extended because of the longer distance and seems surrounding Units 1 and 2. There are several reasons why images (B) and (C) are different. One is the ratio of direct versus scattered gamma rays. Since (B) is at a distance of 100 m, which equals the scattering length of gamma rays from radioactive cesium, the intensity of the direct gamma rays would be comparable to that of the scattered ones. Another possibility is multiple scattering events. Since the distance for (C) is greater than that for (B), the number of multiple scattering events would increase, and the apparent separation angle from the building would become larger.
In summary, we confirmed the capability to visualize gamma rays from multiple and/or extended sources at least in environments of up to 0.2 mSv/h; we could not carry out the test in environments with higher dose rates for safety reasons. Thus, the applicable area of the detector is more than 100 m distant from the 1F units. We also found that the dominant radiation at more than 100 m from 1F units is gamma-ray scattered in the air from radioactive cesium inside the units, as supported by the featureless energy spectra and the skyshine in the gamma-ray images.
3.3. Measurements in lower dose environments
We carried out tests in Fukushima Prefecture to examine the imaging capability in lower dose environments such as 1 Sv/h. The resulting gamma-ray images superimposed on the optical images are shown in .
Figure 10. Gamma-ray all-sky images superimposed on optical images of Fukushima Prefecture, where the average dose rate is 1
Sv/h. The observation time was 2 h. The 50–70%, 70–85%, and 85–100% levels are shown by the color contours in blue, green, and red, respectively, where the mean value over the whole field of view was set to 50%. (A) All-sky optical image by equirectangular projection. The dose rates measured with a scintillation-type survey meter are shown for different areas: ① gravelly path covered with fallen leaves, ② mountain slope, and ③ a gully. (B) Gamma-ray all-sky image superimposed on the optical image by equirectangular projection. (C) Image (B) by stereographic projection and (D) its zoomed version.
We verified the detector imaging capability for a reasonable observation time of 2 h. The image with roughly the same spatial distribution was obtained from 1-h data. We confirmed that the detector is adequate for practical use in environments with a wide dynamic range of dose rate (200 times), specifically between 1
Sv/h and 0.2 mSv/h.
4. Summary and conclusion
We have developed an inexpensive all-sky Compton camera for the detection of sub-MeV gamma rays emitted from radioactive cesium in high-dose environments. The camera consists only six low-cost NaI (Tl) scintillators with a diameter of 1/2 in placed symmetrically at the vertexes of an octahedron. The directional variance of the acceptance was measured to be within 23% (full width) of the average value on account of the symmetrical geometry of the detector. We confirmed that the detector can visualize a gamma-ray source in environments with a dose rate up to
1 mSv/h through irradiation tests at a high-dose irradiation facility using a point-like source. The capability of our detector to visualize gamma rays in environments with multiple and/or extended sources was verified by tests at the Fukushima Daiichi nuclear power plant. We found that gamma-ray skyshine appears due to the scattering between the detector and the distant power plant. The shielding between the power units is not sufficient to protect the workers from radiation exposure, but the present gamma-ray camera would help the monitoring of such effects in high-dose environments. Similar applications are required in high-dose environments such as nuclear medicine facilities and high-intensity accelerators. Also, we confirmed the imaging capability in lower dose environments such as 1
Sv/h for a reasonable observation time of 2 h, which indicates that the detector is adequate for practical use in environments with a wide dynamic range of dose rate (
200 times), specifically between 1
Sv/h and 0.2 mSv/h. In general, this gamma-ray camera could be helpful in many different radiation environments.
Acknowledgments
The authors would like to thank Tokyo Electric Power Company Holdings, Inc. (TEPCO) and the members of Fuji Electric Co., Ltd. (Yasunobu Takahashi, Takeshi Suzuki, Masashi Kimura, Kazufumi Yoshida, Hisae Suzuki, and Takanori Honda) for the cooperation in the nuclear power plant and in the high-dose irradiation facility. This study was supported by the Open source consortium of instrumentation (Open-It), Japan. This study was supported by the Ministry of Education, Culture, Sports, Science and Technology [Grant-in-Aid for Scientific Research A/22244019, Grant-in-Aid for Scientific Research B/15H04769], and the Grant for Promoted Research Project from Ibaraki University. This study was supported by Fuji Electric Co., Ltd. as joint research. The authors would like to thank Enago (www.enago.jp) for its English language review.
Disclosure statement
No potential conflict of interest was reported by the authors.
Notes
1. Recent information on the dose rates in the Fukushima Daiichi nuclear power plant can be found at http://www.tepco.co.jp/decommision/news/data/sm/index-j.html.
2. The scattering length of gamma rays emitted by radioactive cesium in air is 100 m (
13 g cm−2).
Related Research Data
References
- Kamae T, Enomoto R, Hanada N. A new method to measure energy, direction, and polarization of gamma rays. Nucl Instruments Methods Phys Res A. 1987 Oct;260:254–257.
- Schoenfelder V, Aarts H, Bennett K, et al. Instrument description and performance of the Imaging Gamma-Ray Telescope COMPTEL aboard the Compton Gamma-Ray Observatory. Astrophysical J Suppl Ser. 1993;86:657–692.
- Takeda S, Harayama A, Ichinohe Y, et al. A portable Si/CdTe Compton camera and its applications to the visualization of radioactive substances. Nucl Instruments Methods Phys Res A. 2015;787:207–211.
- Kataoka J, Kishimoto A, Nishiyama T, et al. Handy Compton camera using 3D position-sensitive scintillators coupled with large-area monolithic MPPC arrays. Nucl Instruments Methods Phys Res A. 2013;732:403–407.
- Guru SV, He Z, Wehe DK, et al. Portable high energy gamma ray imagers. Nucl Instruments Methods Phys Res A. 1996 Feb;378:612–619.
- Durrant PT, Dallimore M, Jupp ID, et al. The application of pinhole and coded aperture imaging in the nuclear environment. Nucl Instruments Methods Phys Res A. 1999 Feb;422:667–671.
- Okada K, Tadokoro T, Ueno Y. Development of a gamma camera to image radiation fields (The 12th international conference on radiation shielding (ICRS-12) and the 17th topical meeting of the radiation protection and shielding division of ANS (RPSD-2012)) – (Accident of Fukushima nuclear power plant and its influence). Progress Nuclear Sci Technol. 2014 Apr 4;14–17. Available from: http://ci.nii.ac.jp/naid/40020091793/
- Byard K, Ramsden D. Coded aperture imaging using imperfect detector systems. Nuclear. Instruments Methods Phys Res. 1994 Mar;342:600–608.
- Gal O, Gmar M, Ivanov OP, et al. Development of a portable gamma camera with coded aperture. Nucl Instruments Methods Phys Res A. 2006;563:233–237.
- Gmar M, Agelou M, Carrel F, et al. GAMPIX: a new generation of gamma camera. Nucl Instruments Methods Phys Res A. 2011 Oct;652:638–640.
- Compton AH, Quantum A. Theory of the scattering of X-rays by light elements. Phys Rev. 1923 May;21:483–502.
- Mihailescu L, Vetter KM, Burks MT, et al. SPEIR: a GE Compton camera. Nucl Instruments Methods Phys Res A. 2007 Jan;570:89–100.
- Lee W, Lee T. 4π FOV compact Compton camera for nuclear material investigations. Nucl Instruments Methods Phys Res A. 2011 Oct;652:33–36.
- Wahl CG, Kaye WR, Wang W, et al. The Polaris-H imaging spectrometer. Nucl Instruments Methods Phys Res A. 2015 Jun;784:377–381.
- Kagaya M, Katagiri H, Enomoto R, et al. Development of a low-cost-high-sensitivity Compton camera using CsI (Tl) scintillators (γI). Nucl Instruments Methods Phys Res A. 2015;804:25–32.
- Uchida T. Hardware-based TCP processor for gigabit ethernet. IEEE Trans Nucl Sci. 2008 Jun;55:1631–1637.
- Morháč M, Kliman J, Matoušek V, et al. Background elimination methods for multidimensional coincidence γ-ray spectra. Nucl Instruments Methods Phys Res A. 1997 Feb;401:113–132.
- Muraishi H, Kagaya M, Katagiri H, et al. Proposal of a new image reconstruction technique for the Compton camera. J Japan Acad Health Sci. 2014 Dec;17(3):159–164. Available from: http://ci.nii.ac.jp/naid/110009899913/
- Sheu RD, Chui CS, Jiang SH. The integral first collision kernel method for gamma-ray skyshine analysis. Radiat Phys Chem. 2003 Dec;68:727–744.
- Yoshida S, Murata I, Nakagawa T, et al. Analysis of the propagation of neutrons and gamma-rays from the fast neutron source reactor YAYOI. J Nucl Mater. 2011 Oct;417:1345–1347.