
ABSTRACT
In the operation of the sodium-cooled fast reactor, the accident caused by the leakage and combustion of liquid sodium is common and frequent in sodium-related facilities. In this paper, an experiment Harbin Engineering University-Sodium Columnar Fire 4 (HEU-SCF4) is carried out to focus on the combustion characteristics in a discontinuous columnar flow. Liquid sodium (250°C) with the flux of about 1.0 m3/h was injected into a 7.9 m3 stainless steel cylindrical test chamber twice to shape the sodium fire in a columnar flow with discontinuous injections. The temperature, pressure data, and heat release rate in the test chamber were acquired and analyzed. It is found that each injection would cause a peak of space temperature, and it takes much shorter time to reach temperature peak in the second injection than the first injection. The peaks of pressure and heat release rate caused by the second injection are much higher than those caused by the first injection. This study is promising to evaluate the combustion characteristics of sodium fire in a columnar flow with different injection forms in the sodium-related facilities.
1. Introduction
The liquid sodium is commonly used as a coolant in sodium-cooled fast reactors (SFRs) for its excellent thermal hydraulic characteristics. However, its high chemical reactivity with the atmosphere could cause a potential sodium fire hazard. A significant portion of oxides of sodium combustion could be in the form of aerosols posing a health hazard to the exposed personnel, and the high temperature may also cause the structural damage to concrete buildings. The leakage and combustion accident of liquid sodium is chosen as a design basis accident of the SFRs due to its high frequency and severe consequence. Although facility operators has put great effort into preventing the leakage of sodium and fire control safety, frequent sodium leakages and fire accidents have a large negative effect on the development of SFRs, such as PHENIX fast reactor in France, BN-600 fast reactor in Russia, and MONJU fast reactor in Japan. Therefore, extensive studies of sodium fire have been actively carried out in France, Japan, Russia, etc. There have been a number of experimental and numerical studies on combustion behavior of liquid sodium by Hilliard, Newman, Yamaguchi, and Takata et al. [Citation1–Citation7]. Most of the above studies are concerning the spray and pool fires.
However, the realistic leak pattern is the columnar flow, which was really observed in the sodium fire test that was performed to investigate the ‘Monju’ sodium leak accident [Citation8,Citation9]. Japan has studied the sodium columnar fire for about 10 years. Himeno, Miyahara, and Ohno et al. [Citation10–Citation12] have carried out extensive experimental studies to research the columnar fire. They found that the burning of sodium droplet generated by the splashing behavior on the floor is the dominated factor of columnar fire, and the burning rate of columnar leak depends upon leak height and leak rate, but the burning process and characteristics are not mentioned. Recently, Zhang et al. [Citation13–Citation20] reported the combustion characteristics of sodium fire in a columnar flow and droplet forms. However, the combustion characteristics of sodium fire in a columnar flow with discontinuous injections have been not studied in the available literatures.
In the present study, the Harbin Engineering University-Sodium Columnar Fire 4 (HEU-SCF4) experiment was conducted in order to clarify the combustion characteristics of the sodium fire in the discontinuous columnar flow injections such as the relationship of temperature, pressure, and the heat release rate distributions between two injections. The liquid sodium of 250°C is injected into a cylindrical test chamber with two independent injections to shape a sodium fire in a discontinuous columnar flow. The combustion characteristics of the sodium fire in a columnar flow with discontinuous injections are discussed by analyzing the temperature fields and pressure in the chamber and the heat release rate, and comparing with those in a columnar flow with continuous injections.
2. Experimental apparatus and procedure
2.1. Experimental apparatus
The experimental apparatus of sodium fire in a columnar flow consists mainly of the sodium supply tank, the test chamber, data acquisition system, ventilation and water washing system and ISO9705 standard fire experiment platform, as shown in [Citation20].
Figure 1. Experimental apparatus.
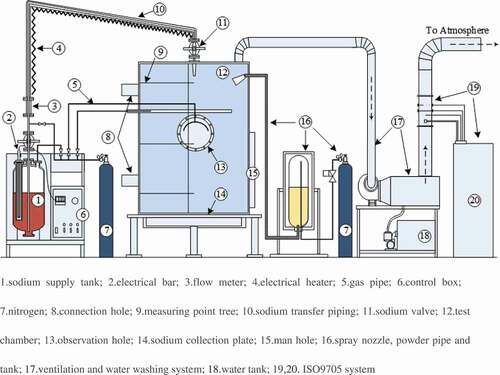
(1)The sodium supply tank is made of stainless steel and connected with the test chamber by the sodium transfer pipe. The top of the sodium supply tank is equipped with the sodium transfer piping, electrical bar, nitrogen connection, pressure gage, sodium flow meter, pressure control valve, etc. The tank is installed in an incubator packed with thermal insulation materials for reducing the heat loss from the tank to external environment
(2)The test chamber is structured by a stainless steel cylinder with a height of 2.5 m and inner diameter of 2.0 m. The interlayer of the cylinder is packed with thermal insulation materials for an accurate detection of the experimental temperature and the safety for experimenters. A heavy gauge observation hole and manhole is equipped for observation and maintenance, and the sodium nozzle is installed on the top to connect with sodium pipes and the supply tank.
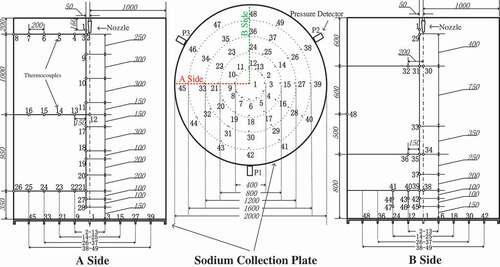
(3)The data acquisition system consists of 3 pressure sensors, 48 thermocouples (T1–T48) distributed in space and 49 thermocouples (Td1–Td49) distributed in the sodium collection plate, and the multi-channel temperature acquisition apparatus and the ISO9705 fire experiment platform attached on the ventilation pipe. The K-type armored thermocouples and the diffused silicon pressure sensors are adopted in the experiment. The precisions of thermocouples and pressure sensors are ±2.5°C and 0.5% FS, respectively. The distributions of measuring points for thermocouples are shown in in detail. For the convenient data analysis, the thermocouples distributed in the space and sodium collection plate are distinguished by using the marks ‘T’ and ‘Td,’ respectively. Forty-eight measuring points (T1–T48) in the space locate on two mutually perpendicular planes (A and B side). The sodium nozzle lies over the measuring point Td1 both on the centerline of the test chamber.
Figure 2. Distributions of measuring points in the test chamber space and the sodium collection plate (unit: millimeter).
(4)The ventilation and water washing system is connected with the top of the test chamber via a smoke tube. During the experiment, the system with the fan and water pump could discharge and clean the aerosols inside the test chamber, and then it will discharge the washed gas into the ISO9705 standard fire experiment platform.
(5)The ISO9705 standard fire experiment platform can calculate the heat release rate in the chamber based on the oxygen consumption method[Citation21]. After being sampled and analyzed by the gauges, the washed gas would be released to the atmosphere.
2.2. Experimental procedure and phenomena
During the experiment, the solid metal sodium of 16.9 kg in the sodium supply tank was steadily heated up to the liquid sodium with the initial temperature of 250°C by the electrical bar. Then the liquid sodium was pressed into the test chamber in discontinuous flow through the sodium transfer piping via a nozzle by the nitrogen of 0.2 MPa. The discontinuous flow in this paper consisted of two injections. The first injection released 16.5 kg sodium into the chamber from 0 to 66.5 s. The second injection started after the first injection was finished and the temperature in chamber space almost became stable again, when was from 465 to 466.6 s, and released 0.4 kg sodium, which was much less than the first injection, to research the influence of mass on the combustion characteristics of columnar fire by comparing two injections.
The main stream of the liquid sodium flowed in a columnar form when the injection began. Hundreds of burning liquid sodium particles spurted from mainstream during the injection, then a great deal of sodium aerosol generating in the test chamber obstructed the observation. Except the bright light of orange color, the inside of the test chamber could not be observed. The temperature and pressure of the sodium tank and flux of the liquid sodium were monitored when the liquid sodium was ejected. The experimental data were gathered in real time through the acquisition system, which lasted for 1.3 h.
3. Experimental results and analysis
3.1. Characteristics of space temperature
shows the temperature distributions at the different heights of longitudinal measuring point tree (direction: T1–T28) at a distance of 0.05 m from the central line. The distributions of space temperature are similar to those in a continuous columnar flow [Citation13,Citation16–Citation18,Citation20] except the peaks. It could be observed that there are two temperature peaks appeared during the experiment, while there is only one peak observed in previous sodium columnar fire experiment with continuous flow. The values of these two temperature peaks are very closed, reaching 1081°C and 1034°C, respectively, but the mass of ejected sodium in the first injection is much more than that in the second injection, which illustrates that the mass of liquid sodium has little influence on temperature peak of columnar combustion. It takes 109 s from the beginning of first injection to reach peak temperature, while it becomes 6 s for the second. After the first injection, liquid sodium does not start burning at once because of the low air temperature (about 12°C) in the chamber space, and the temperature variations of these measuring points have marked difference, such as measuring point T28, it starts to rise at about 20 s, but some others like T3 and T9 do not have obvious rise until 100 s; compared with the first injection, the air temperature in test chamber space has become higher (about 162°C) during the second injection, and the heat loss of the liquid sodium flow by convection is much smaller than that in the first injection, so that the combustion of liquid sodium takes place in a short time after the injection, and the temperatures of measuring points in the typical longitudinal line start to rise at a high rate of speed almost at the same time. Moreover, the time of two temperature peaks appearing is corresponding with that of two injections, so it can be inferred that each injection would cause a space temperature peak, which indicates that the atomization and disturbance caused by the injection are the main factors of temperature peak, rather than the space temperature or injection mass.
Figure 3. Temperature distributions in the typical longitudinal line in the Side A (T1–T28).
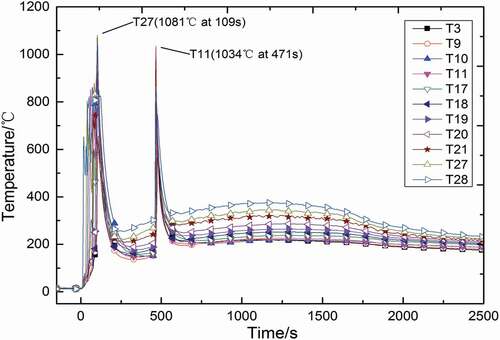
In addition, it could be observed that after the first injection, the columnar fire has finished, but space temperature gets a slight rise at about 250 s, and the measuring point closer to the collection plate reaches higher temperature. This is because a large amount of liquid sodium accumulates on the ground forming a sodium pool fire, and it releases a lot of heat into chamber space mainly by convection and radiation, so that the space temperature would get a slight rise after the columnar fire finished. A similar phenomenon could be observed after the second injection.
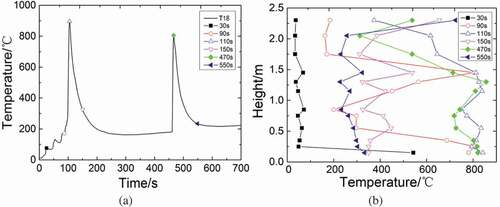
shows the temperature values at different heights of longitudinal measuring point tree (direction: T1–T28) at a distance of 0.05 m from the central line at various times. Take the temperature curve of T18 as a reference to choose some typical time points (30, 90, 110, 150, 470, and 550 s), which can represent the average trend of temperature distribution of measuring points on the central line. The temperatures of measuring points at different heights keep relatively low at 30 s except 0.15 m (T28). At 90 s, besides the measuring points below 0.5 m (T21, T27, and T28) whose temperatures reach about 700°C ~ 800°C, the temperatures of the region between 1.15 ~ 1.45 m (T11, T12, and T17) also rise obviously. Then, almost all of the measuring points at longitudinal heights reach peak temperatures at 110 s. The temperatures of the region below 2.05 m exceed 600°C; however, the temperature of T3 at 2.30 m only reaches approximately 400°C. Forty seconds later, the temperatures of the measuring points at longitudinal heights drop to about 400°C except T3 (2.30 m) and T11 (1.45 m). Because of the second injection, most of the measuring points reach the second temperature peaks at 470 s, except the top two measuring points whose temperatures are lower than those at 150 s. At 550 s, most of measuring points are cooled down to about 300°C. It can be found that during the first injection, liquid sodium starts to combust at the region below 0.25 m, while it starts to combust at the region below 2.0 m in the second injection, which verified that the liquid sodium starts to combust earlier in the second injection.
Figure 4. Temperature distributions at longitudinal heights (direction:T1–T28) in the test chamber space at various times.
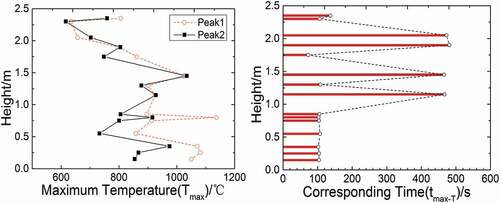
shows the maximum temperature (Tmax) values and corresponding time (tmax-T) values at different longitudinal heights (direction: T1–T28) in the test chamber space. It can be observed that Tmax values decrease gradually with the increase in the height, because the space atmosphere at the lower region would absorb the heat released by pool fire on the collection plate. Moreover, except the measuring point T10 at 1.75 m reaching up to Tmax at 78 s, the time when other measuring points reach Tmax is near the time points of two temperature peaks in , namely about 109 and 471 s. In the region below 1.0 m, all of Tmax values appear near the first temperature peak (109 s), and in the region between 1.0 and 2.2 m, most of Tmax values appear around the second temperature peak (471 s). It could be inferred that there is an ignition delay time after the first injection so that the sodium does not combust sufficiently until reaching lower region, but during the second injection, the delay time becomes much shorter to make sodium combust violently in higher region. Therefore, the combustion during the second injection is sufficient and more violent in higher region, and releases more heat to ambient space to make space temperature higher in the region between 1.0 and 2.2 m, so that Tmax values in higher region appear in the second injection. As for Tmax in the lower region, the sodium mass in the second injection is only 0.4 kg, and most of liquid sodium has been consumed in higher region, so that the heat that combustion releases is less, and the temperature of lower region in the second injection would be lower.
Figure 5. Tmax and corresponding tmax-T at different longitudinal heights (direction:T1–T28) in the test chamber space.
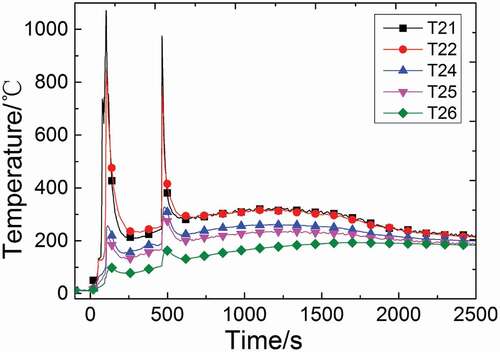
The temperature distributions of radial measuring points T21–T26 are shown in . It can be seen that the temperature decreases sharply with the increasing distance from the center axis and all these curves tend to stabilize at around 200°C at last, which is similar to that in a continuous columnar flow [Citation13,Citation16–Citation18,Citation20]. Measuring points T24–T26 are far from the central line of test chamber space, but the time they reach the peaks are approximately the same with those of measuring points on the central line. Compared the temperature distributions of these measuring points in two injections, it can be found that the first peaks of T21 and T22 are higher than the second, but the first peaks of T24–T26 are lower than the second ones. T21 and T22 are in the lower region near the central line, so that the second peaks are higher according to previous analysis. However, the temperature rises of T24–T26 are caused by convection and radiation heat transfer. Compared with the first injection, the space temperature and the heat released during the second injection is much higher, so that the measuring points of T24–T26 could get more heat and reach higher temperature. Moreover, the space temperature that is far away from the center axis is higher compared with the previous experiments in a continuous flow because of the two injections.
Figure 6. Temperature distributions of radial measuring points T21–T26 in the test chamber space.
3.2. Surface temperature of sodium collection plate
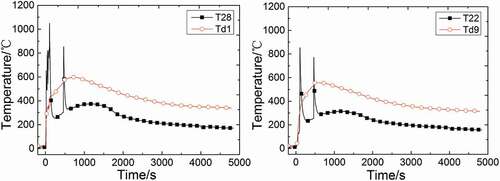
shows the temperature distributions of measuring points T28, Td1, and T22, Td9. The measuring point T28 is installed at 0.15 m above the sodium collection plate, 0.05 m far from the central line while Td1 is in the center of the sodium collection plate, so that these two measuring points are very close. The temperature of Td1 has been almost always 200°C higher than T28 when T28 does not get to peak temperature. Compared with the violent variation of temperature in test chamber space, the slope of Td1 is much smaller and the temperature changes slowly. Soon after the second injection, the temperature of Td1 starts to decrease, while T28 keeps going up and lasts for a long time (about 600 s). The measuring point T22 and Td9 are also very close, and their distributions are similar to T28 and Td1. Therefore, it illustrates that even if the measuring point in space is very close to that at the collection plate, the temperature distributions of these two points differ greatly.
Figure 7. Temperature distributions of measuring points T28 and Td1.
shows the average temperature distributions of all measuring points on different radii in the sodium collection plate in discontinuous injection. The temperatures of measuring points within the radius of 400 mm start to drop down in a short time after the injection, which are earlier than those of measuring points at the radius of 600 and 800 mm. It indicates that the region within the radius of 400 mm is the heat source. The heat-generating rate cannot make up the rate that heat transfer to the outside because the burning rate gets down after the injection, so that the temperature in this region could drop down quickly. However, the region among 400 and 800 mm is not in the heat source and the rise of temperature is decided by the heat transfer process, so that the decline of temperature has a delay and the peak is lower than that in region within the radius of 400 mm.
Figure 8. Average temperature distributions of all measuring points on different radii in the sodium collection plate.
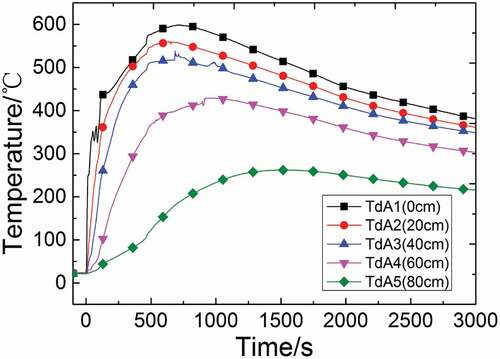
Compared with the previous experiments about sodium fire in a continuous columnar flow[Citation13], it could be found that the radial temperature change in the sodium collection plate always has a significant stratification, and the value of peak temperature is always around 500°C ~ 600°C. However, the temperatures of TdA4 and TdA5 rise faster and the peaks appear earlier in this experiment. This is because that there are two injections in this experiment, which causes higher space temperature and bigger heat release rate, so that the measuring points at the region between 600 and 800 mm would get more heat by convection and radiation.
3.3. Pressure and heat release rate
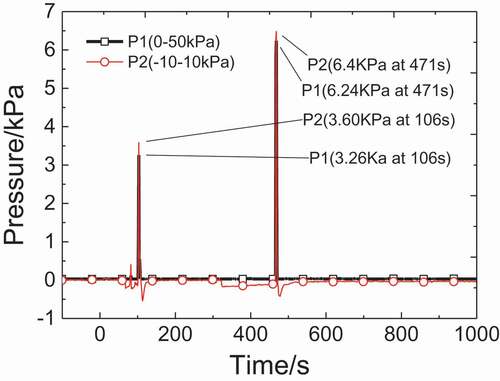
shows the pressure distributions in the test chamber space. The trends of curves that two pressure sensors measured are consistent. Both of two detectors get two pressure peaks during combustion. The time of these two pressure peaks is almost the same with that of two temperature peaks as shown in . Therefore, it can be inferred that the injection makes space temperature rise rapidly, and the air in combustion chamber would be heated and expand, which causes a pressure rise. It can be seen that the second pressure peak is much higher, about 1.8 times of the first one. However, the mass of ejected sodium in the second injection is much less than that in the first injection, which illustrates that the mass of liquid sodium has little influence on the value of pressure. In second injection, it costs much shorter time for space temperature to reach the peak, so that the combustion during the second injection would be more violent and the heat release rate would be higher. Therefore, the air in chamber space would expand much quicker than the first injection, and the second pressure rise would be higher.
Figure 9. Pressure distributions in test chamber space.
shows the curve of the heat release rate of sodium fire in a columnar flow with discontinuous injections. There are three obvious peaks of the heat release rate on the curve, and the first two peaks appear around the time of two temperature peaks as shown in , so that it could be inferred that the first two peaks are caused by two injections. But between the first two peaks, the heat release rate has an obvious rise from 227 to 395 s. This is because a sodium pool has formed on the collection plate after the first injection, and the sodium pool fire would release a large amount of heat to space in chamber. Therefore, the second peak of heat release rate is the summation of the heat release rate caused by pool fire and the second columnar fire, and that is why the second peak of heat release rate is 2.4 times higher than the first one, while the first injection consumes 16.5 kg sodium and the second injection consumes only 0.4 kg. Another cause for the phenomenon is that it costs much shorter time for space temperature to reach the peak in the second injection, which means the combustion is more violent and more heat is released within the same time frame. The third peak appears at 720 s when the columnar fire has finished, so that it is caused only by pool fire on the collection plate.
Figure 10. Heat release rate of sodium fire in a columnar flow with discontinuous injections.
4. Conclusion
A sodium fire experiment was carried out to focus on the combustion characteristics in a discontinuous columnar flow. Compared with the results of the sodium fire experiment in a continuous columnar flow, the conclusions are summarized as follows:
(1) Each injection of the liquid sodium would cause a peak of space temperature. The value of two peaks are close, but it costs much shorter time to reach the second peaks because of the relatively high space temperature, which is caused by the first injection and the pool fire on the collection plate. The distributions of space temperature are similar to those in a continuous columnar flow except the peaks, but the space temperature far away from the center axis is higher because of the two injections.
(2) In the space with a high temperature (above 100°C), even a very small amount of sodium ejected would cause significant rises of temperature, pressure, and release rate, because of the atomization and the disturbance caused by the injection. However, the small mass of sodium has limited influence on the pool fire maybe because the sodium has been consumed in the space, so that the temperature distributions on the collection plate are similar to those in a continuous columnar flow.
(3) Each injection would cause a peak of pressure and heat release rate. The second peaks were both much higher than the first one, because the higher space temperature causes more violent combustion during the second injection. The heat release rate has a third peak, which appears after the columnar fire has finished, so that it is caused only by pool fire on the collection plate, and it is much lower than the first two peaks caused by columnar fire.
Acknowledgments
The authors thank the National Natural Science Foundation of China [grant number 51476040], Project of Nuclear Energy Development, and Fundamental Research Funds for the Central Universities of China for the financial support.
Disclosure statement
No potential conflict of interest was reported by the authors.
References
- Hilliard RK, Mccormack JD, Postma AK. Aerosol behavior during sodium pool fires in a large vessel–CSTF test AB1 and AB2. (Report no. HEDL-TME 79-28 UC-79). Hanford (WA): Hanford Engineering Development Laboratory; 1979. p. 79.
- Newman RN. The ignition and burning behavior of sodium metal in air. Prog Nucl Energy. 1983;12:119–147.
- Yamaguchi A, Tajima Y. Numerical investigation of mass and heat transfer in sodium pool combustion. Numer Heat Transfer. 2002;A41:697–709.
- Takata T, Yamaguchi A, Maekawa I. Numerical investigation of multidimensional characteristics in sodium combustion. Nucl Eng Des. 2003;220:37–50.
- Subramani A, Jayanti S, Shet USP, et al. Dynamics of liquid sodium pool spreading under sodium fire conditions. Nucl Eng Des. 2009;239:1354–1361.
- Bae JH, Ahn DH, Kim YC, et al. An experimental study on the characteristics of sodium fires. J Korean Nucl Soc. 1994;26:471–483.
- Ho D, Rd W, Wj H. The experimental research on the sodium spray fire. At Energy Sci Technol. 2011;31:41–47. Chinese.
- Kawata K, Teraoku T, Ohno S et al. Investigation for the sodium leak Monju-sodium fire test-I. (Report no. PNC-TN941097-036). Japan: O-arai Engineering Center; 2000.
- Uchiyama N, Takai T, Nishimura M et al. Investigation for the sodium leak Monju-sodium fire test-II. (Report no. JNC-TN9400 2000-090). Japan: O-arai Engineering Center; 2000.
- Himeno Y, Miyahara S, Morii T, et al. Development and demonstration of sodium fire mitigation system in the SAPFIRE Facility. IAEA/IWGFR Specialists’ Meeting on Sodium Fire; 1988 Jun 6–9. Obninsk:USSR.
- Himeno Y, Miyahara S, Morii T, et al. Engineering scale test on sodium leak and fire accident and its consequences in auxiliary building of fast breeder reactors.In: The 4th International Conference on Liquid Metal Engineering and Technology; 1988 Oct 17–21; Avignon, France.
- Ohno S, Uchiyama N, Kawata K, et al. Sodium columnar fire test and code development at PNC. IAEA/IWFGR TCM on Evaluation of Radioactive Materials Release and Sodium Fires in Fast Reactors; 1996 Nov 11–14; Oarai, Japan.
- Zhang ZG, Peng KW, Huo Y, et al. Experimental study on combustion characteristics of sodium fire in a columnar flow. J Nucl Sci Technol. 2014;51(2):166–174.
- Peng KW, Zhang ZG, Guo M, et al. Experimental study on sodium column fire of sodium-cooled fast reactor. In: Proceedings of the 21st International Conference on Nuclear Engineering (ICONE21); 2013 Jul 28–Aug 2; Chengdu, China.
- Wand C, Zhang ZG, Peng KW, et al. Simulation research on combustion of liquid sodium droplet. In: Proceedings of the 21st International Conference on Nuclear Engineering (ICONE21); 2013 July 28-Aug 2; Chengdu, China.
- Guo M, Zhang ZG, Tang YX, et al. Experimental study on sodium fire combustion in a columnar flow. In: Proceedings of the 22nd International Conference on Nuclear Engineering (ICONE22); 2014 Jul 7–11; Prague, Czech Republic.
- Tang YX, Zhang ZG, Guo M, et al. Experimental study on burning process and characteristic of sodium columnar fire. In: Proceedings of the 22nd International Conference on Nuclear Engineering (ICONE22); 2014 July 7–11; Prague, Czech Republic.
- Li JK, Zhang ZG, Huo Y, et al. Experimental study on sodium fire combustion in a columnar flow. Proceedings of the 23rd International Conference on Nuclear Engineering (ICONE23); 2015 May 17–21; Chiba, Japan.
- Zhang ZG, Sun SB, Liu CC, et al. Experimental study on oxidation and combustion characteristics of sodium droplets. At Energy Sci Technol. 2015;49(4):667–673. Chinese.
- Huo Y, Zhang ZG, Li JK, et al. Experimental study on combustion and suppression characteristics of sodium fire in a columnar flow using extinguishing powder. J Nucl Sci Technol. 2017;54(6):716–723.
- Parker WJ. Calculations of the heat release rate by oxygen consumption for various applications. J Fire Sci. 1984;2(5):380–395.