
 ?Mathematical formulae have been encoded as MathML and are displayed in this HTML version using MathJax in order to improve their display. Uncheck the box to turn MathJax off. This feature requires Javascript. Click on a formula to zoom.
ABSTRACT
Measurement of the temperature and flow rate at each fuel subassembly outlet is an effective way for a liquid metal fast breeder reactor to detect a loss of coolant accident or reactivity-initiated accident in the early stage and to understand the reactor’s thermal hydrodynamic performance. Japan Atomic Energy Agency has developed the eddy current flowmeter in practical use and installed 34 of them in the upper core structure of fast breeder reactor, Monju. This report presents data obtained by using the flowmeters in Monju. We observed high linearity between each of the flowmeter’s signal intensity and the primary sodium’s flow rate under 10–100% flow rate condition. High linearity was also observed in a region of low velocity (approx. 0.25 m/s). The fluctuation of flow rate observed by the flowmeters was below 0.2 m/s which is 5% of the time-averaged velocity under a rated condition. These experimental results show that the eddy current flowmeter is an effective tool to detect the changes in relative flow rate.
1. Introduction
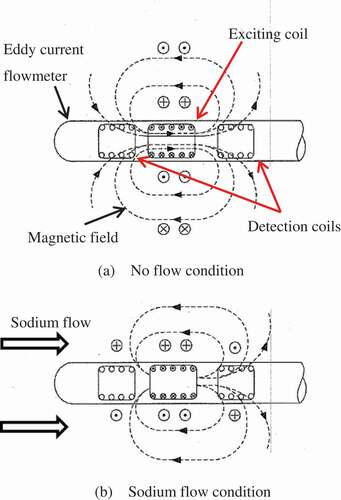
Measurement of the temperature and flow rate at each fuel subassembly outlet is an effective way for a liquid metal fast breeder reactor (LMFBR) to detect a loss of coolant accident or reactivity-initiated accident in the early stage and to understand the thermal hydrodynamic performance of the reactor. Measurement devices installed at the fuel subassembly outlet need to be small enough to fit in a narrow core upper plenum. The eddy current type flowmeter [Citation1–Citation6] is compact; it is suitable for the measurement. The flowmeter can have various configurations in terms of the number of coil. shows a conceptual diagram of the flowmeter with three coils of which the two are symmetrical detection coils and the rest is an exciting coil placed in between the two. The flow rate is measured by detecting the voltage difference between the two detection coils. These three coils generate a symmetric magnetic field in a no-flow condition. Thus, the electromotive forces generated in both detection coils are identical. When there is a sodium flow, eddy currents are generated around the detection coils through an interaction between the magnetic field produced by the exciting coil and the sodium flow. An eddy current around the upstream detection coil is in-phase with the exciting current, while an eddy current around the downstream detection coil is reversed-phase with the exciting current; therefore, the downstream magnetic field is distorted as shown in . Thus, the electromotive force generated by the upstream detection coil decreases. By contrast, the electromotive force generated by the downstream detection coil increases. The velocity can be determined by measuring the difference of the electromotive forces generated by both coils because the difference is proportional to the sodium flow velocity. In 1990, Japan Atomic Energy Agency (JAEA) developed the eddy current flowmeter in practical use and installed 34 of them in the upper core structure of fast breeder reactor, Monju.
Figure 1. Conceptual diagram of eddy current flowmeter.
This study has demonstrated the performance of the eddy current flowmeters in Monju and, in particular, investigated the linearity in a low-velocity region and fluctuation in values measured by the instruments under a constant flow rate condition. The experimental results suggest that the eddy current flowmeter can detect changes in the relative flow rate which means the flow rate at the fuel subassembly outlet normalized by the flow rate in the primary system.
2. Experimental equipment
shows the major plant specifications of Monju [Citation7–Citation9]. The numbers of core fuel subassembly, blanket fuel, and control rod are 198, 172, and 19, respectively. shows schematic views of the reactor vessel and primary cooling system of Monju. The eddy current flowmeters were installed in the upper core structure above the core outlet. A permanent magnet type electromagnetic flowmeter was also used to measure the flow rate in the primary system (hereinafter ‘primary flow rate’). shows the flow rate distribution in the Monju core and installation positions of the eddy current flowmeters. The flow rate identification numbers of the core fuel subassemblies are from 1 to 8, and that of the blanket fuels are from 9 to 11. Two or more eddy current flowmeters were installed in all flow rate regions of the core fuel subassemblies. Two eddy current flowmeters were installed in the blanket fuels of flow rate number 9, which is the innermost region of the blanket fuels. lists the major specifications of the flowmeter. The flowmeter used in this study comprises three coils as shown in . The total length and the outer diameter of the coils are approximately 90 and 12.2 mm, respectively. The outer diameter of the coil casing is 19 mm. The frequency of the exciting coil is 425 Hz. The measurement range of the instrument is 0–7 m/s in consideration of the Monju design value. shows a conceptual diagram of the fuel subassembly and the eddy current flowmeter. It is assumed that the flow field at the fuel subassembly outlet is complex; thus, straightening tubes were installed on the outer sides of all the flowmeters to correctly measure the velocity at the fuel subassembly outlet. The distance between the lower end of the straightening tube and the fuel subassembly outlet is 50 mm. As shown in , a thermocouple is installed on the upstream side of the flowmeter. All eddy current flowmeters were calibrated at a dedicated facility and installed in the core upper plenum of Monju in 1990. The straightening tubes were also simulated in the calibration because the flowmeters are greatly affected by the surrounding environment. The calibration results showed that the accuracy of the eddy current flowmeters was 5% at full scale (7 m/s). The permanent magnet type electromagnetic flowmeter which has
3.5% accuracy at full scale was used as a reference flowmeter in the calibration.
Table 1. Major plant specifications of Monju
Table 2. Major specifications of eddy current flowmeter
Figure 2. Schematic view of reactor vessel and primary cooling system of Monju.
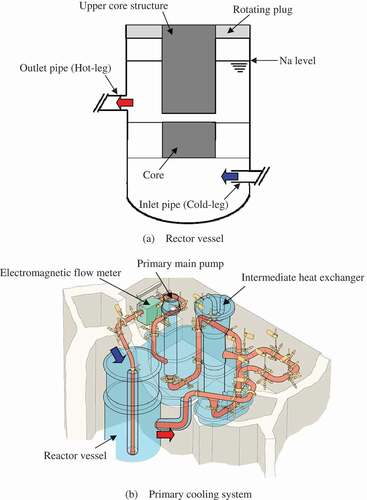
Figure 3. Flow rate distribution in Monju core, and installation positions of eddy current flowmeters.
Figure 4. Conceptual diagram of the fuel subassembly and eddy current flowmeter in Monju.
3. Demonstration test in Monju
3.1. Experimental results of each flow rate region
Before loading the core, the flow rate at the core outlet was measured by using a dummy core that simulates the flow rate distribution in Monju in 1992. The values in represent the design values and the average flow rates calculated from values obtained from each eddy current flowmeter installed in the regions that have the same flow rate numbers. As shown in , the experimental results showed good agreement with the design values. The maximum difference between the experimental result and the design value was 0.27 m/s in flow rate region number 8.
Figure 5. Velocity data of each flow rate region.
The eddy current flowmeter inserted to core position (CP) 4F3 failed after this experiment; thus, the data shown are of the eddy current flowmeters without it.
3.2. Aging variation and performance for linearity
It was confirmed that the readings on the eddy current flowmeters varied with time even though the flow rate conditions remained unchanged. shows a comparison between the velocities obtained from an eddy current flowmeter and the primary flow rate in October 2007 and September 2008. Monju has three loops in the primary coolant system. In this paper, the primary flow rate represents the total flow rate of the three loops. shows the experimental results obtained from the eddy current flowmeter at CP 7F1 which had the largest zero drift. shows the results obtained from the flowmeter at CP 2F1 which had the biggest change in the slope of signal intensity of the flowmeter with the primary flow rate. The flowmeter at CP 7F1 had zero drift (approximately 0.7 m/s); nevertheless, we obtained strong linearity between the signal intensity of the flowmeter and the primary flow rate in both 2007 and 2008. Likewise, the slope of signal intensity of the flowmeter at CP 2F1 changed 5.3% as the primary flow rate increases; nevertheless, we obtained strong linearity in 2007 and 2008.
Figure 6. Comparison between velocity obtained from eddy current flowmeter and primary flow rate in October 2007 and September 2008.
Therefore, we can say that strong linearity was obtained between the signal intensity of each eddy current flowmeter and the primary flow rate, even with zero drift and the varying slope. Since Monju achieved first criticality in 1994, the primary sodium has been constantly flowing to remove decay heat. Therefore, the zero correction of the sensor outputs has never been done under a zero flow condition after the first criticality.
3.3. Performance in low velocity region and linearity after 20 years from installation
The relation between the velocity data of each flow rate region and the primary flow rate was clarified to evaluate the linearity between the signal intensity of each eddy current flowmeter and the primary flow rate. shows the velocity data of each flow rate region analyzed by using the General code [Citation10] to the primary flow rate. The velocity data were normalized by the velocity of flow rate region 1. As shown in , the velocity distributions under 50%, 75%, and 100% flow rate conditions almost overlapped each other except that under 10%. The maximum difference of the normalized velocity was approximately 0.08 in flow rate region 5. This value 0.08 is approximately 0.04 m/s in the absolute value, and approximately 0.6% when divided by the full scale (7 m/s). shows the experimental results of the velocity measurement and deviation from the linearization, obtained in June 2010, in which the velocity data of the innermost fuel subassembly CP 1A1 and the outermost fuel subassembly CP 8D1 are presented. The deviation is the difference from the linearization divided by the full scale. As shown in , the strong linearity between the signal intensity of each eddy current flowmeter and the primary flow rate was obtained under 10–100% flow rate conditions, and the deviations were within 2%. In particular, the deviation was 0.5% under 10% flow rate condition at CP 8D1. Therefore, we can say that the linearity was demonstrated in the low velocity region of approximately 0.25 m/s as well.
Figure 7. Velocity data at each flow rate region analyzed by using the General code.
Figure 8. Velocity and deviation from linearization as of June 2010.
shows the deviations of all eddy current flowmeters except CP 4F3 as of June 2010. The deviations of all eddy current flowmeters were within ± 2%. Therefore, we assume that the strong linearity between the signal intensity of each eddy current flowmeter and the primary flow rate has been maintained for 20 years since the installation of the flowmeters. As shown in the table, the deviations of 10% and the rated primary flow rate were positive in all of the flow rate regions. By contrast, the deviations of 50% flow rate were negative in all of the flow regions except the fuel subassembly CP 8E4. In addition, the deviations of 20% primary flow rate were within ± 0.2%. In other words, all the flowmeters had the same deviation tendency for each primary flow rate. As discussed in Section 4, the difference in the environmental conditions outside of the straightening tube between in the calibration and Monju may affect the readings of the flowmeters.
Table 3. Deviation from linearization as of June 2010
3.4 Fluctuation data
shows the velocity data of the innermost fuel subassembly CP 1A1 and the outermost fuel subassembly CP 8D1 as of June 2010, which indicates the trends in the velocity under 100% rated condition. Normalized fluctuation intensity was defined as follows:
Figure 9. Trends in velocity data under 100% rated condition as of June 2010.
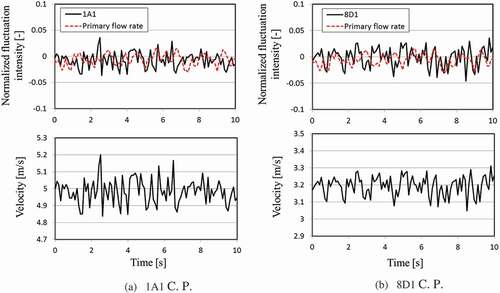
where is the instantaneous value, and
is the average value. The Figures of normalized fluctuation intensity also show the primary flow rate measured with an electromagnetic flowmeter installed on the primary cooling pipe. From the results, it was found that the amplitudes of velocity fluctuation at CPs 1A1 and 8D1 were less than ± 0.2 and ± 0.15 m/s, respectively. In addition, the normalized intensity of the velocity fluctuation at both fuel subassembly outlets was within ± 5%, which was the same as that at the primary flow rate. These results show that the eddy current flowmeter can measure the velocity trend with reasonable accuracy under 100% rated condition.
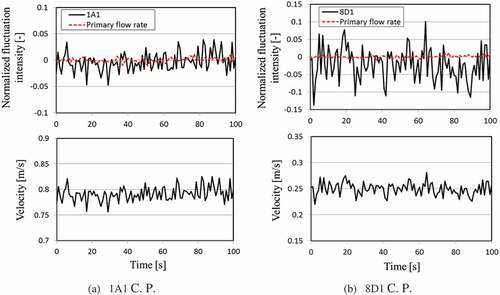
shows the trends of velocity data under the approximately 10% flow rate condition as of June 2010. As shown in the Figure, the amplitudes of fluctuation at CPs 1A1 and 8D1 were less than ± 0.05 m/s. The normalized fluctuation intensity of the primary flow rate under 10% flow rate condition was much smaller than that under 100% rated condition. We considered that the fluctuation amplitude was small because the sodium flow was circulated by a pony motor on a primary pump under 10% flow rate condition. The normalized fluctuation intensity at CP 1A1 was within ± 5%, as with the case of 100% rated condition. By contrast, the absolute value of the maximum intensity of normalized fluctuation at CP 8D1 was 13% owing to the low absolute velocity at CP 8D1.
Figure 10. Trends in velocity data under approximately 10% flow rate condition as of June 2010.
4. Discussion
We confirmed that zero drift and changes in the slope of signal intensity of the eddy current flowmeter occurred at the primary flow rate. However, it should be noted that Monju was operated at approximately 40% thermal output at a maximum; moreover, the total power operation period was only about 40 effective full power days [Citation11]. Therefore, the change of flow rate in each flow rate region was apparently not caused by bowing of the fuel subassemblies. As explained earlier, the eddy current flowmeter relies on the surrounding environment; thus, the zero drift and slope changes could be caused by the changes in the positional relationship between the exciting coil and detection coils owing to the thermal expansion of the coil casing. Although zero drift and slope change occurred, strong linearity was observed between the signal intensity of each eddy current flowmeter and the primary flow rate. Therefore, it can be said that the eddy current flowmeter can detect changes in relative flow rate, although periodic calibration for the flowmeter is needed to measure the velocity accurately. It is important to develop a way of calibrating eddy current flowmeters installed in an upper core structure because it is difficult to calibrate them outside a reactor every time.
We confirmed that the normalized fluctuation intensity of velocity was within ± 5% under 100% rated condition. Reference [Citation12] shows that when local blockage narrows a flow area of fuel subassemblies of a typical LMFBR approximately 50%, the flow rate of the blocked fuel subassembly is reduced 5%. Thus, the eddy current flowmeter was demonstrated its capacity to detect local blockages of more than 50% of flow areas in Monju.
As described in Section 1, the straightening tube was simulated in the calibration for the flowmeters. However, the environment outside of the straightening tubes in the calibration was different from that in the real plant. Concretely speaking, there is a flow of approximately 530°C sodium outside the straightening tubes in Monju, but there was air without the flow outside the straightening tube in the calibration. The attenuation of the electromagnetic field from an eddy current flowmeter is expressed by the following equation [Citation3]:
where
A is the attenuation rate,
is the angle rate (2
),
is the exciting frequency (425 Hz),
is the magnetic permeability,
is the electric conductivity, and
r is the distance from coil surface.
Here, the magnetic permeability of a free space was used for since sodium is non-magnetic material. The value of electric conductivity
was calculated by using the equation shown in Ref. [Citation13]. The value of r was 30 mm, the distance from the coil surface to the outside of the straightening tube. From EquationEquation (1)
(1)
(1) , the electromagnetic field on the outer surface of the straightening tube is approximately 10% of that on the eddy current flowmeter. The different environmental condition outside the straightening tube may affect the readings of the eddy current flowmeters. The flowmeters can be calibrated more accurately by simulating the environmental condition outside of the straightening tube in calibration.
The output voltage of the eddy current flowmeter depends on the temperature of liquid sodium. In the flowmeter calibration, we obtained a correction curve for the temperature. However, this paper only shows the results under a 200°C sodium condition because the data obtained in different temperature conditions were insufficient. Experiments with different sodium temperatures will be conducted to confirm the adequacy of the correction curve in the future.
5. Conclusion
This study has demonstrated the eddy current flowmeter developed by JAEA. We observed the strong linearity between the each of the flowmeter’s signal intensity and the flow rate of primary sodium under 10–100% flow rate conditions. High linearity was also observed in a region of low velocity (approx. 0.25 m/s). The fluctuation of flow rate observed by the flowmeters was below 0.2 m/s which is 5% of the time-averaged velocity under a rated condition. These experimental results show that the eddy current flowmeter can detect changes in the relative flow rate.
Disclosure statement
No potential conflict of interest was reported by the authors.
References
- Sheff JR, Lessor DL. Optimization of eddy current flowmeter performance. Annual Meeting of the American Nuclear Society; 1972 Jun 18–22; Las Vegas. Conf-720607–13.
- Wiegand DE. The eddy-current flowmeter: an analysis giving performance characteristics and preferred operating conditions. USA: Argonne National Laboratory; 1969. ( ANL-7554 Engineering and Equipment).
- Endo A The instrumentation of fast reactor. Japan Nuclear Cycle Development Institute; 2003, JNC TN4400 2002–003. [in Japanese]
- Baker RC. Electromagnetic flowmeters for fast reactors. Prog Nucl Energy. 1977;1:41–61.
- Hemp J. Theory of eddy currents in electromagnetic flowmeters. J Phys D Appl Phys. 1991;24:244–251.
- Veerasamy R, Sureshkumar S, Asokane C, et al. Eddy current flow sensor development and testing for LMFBR sodium pumps. Proceeding of ICONE15; 2007 Apr 22–26; Nagoya (Japan). ICONE15–10213.
- Hori M, Takeda A Development of the FBR as the leading energy source for Japan. Proceeding of Fast Reactor and Related Fuel Cycles (FR’91); 1991 Oct 28-Nov 1; Kyoto (Japan). p. 1–5.
- Akebi M Overview of MONJU project. Proceeding of Fast Reactor and Related Fuel Cycles (FR’91); 1991 Oct 28-Nov 1; Kyoto (Japan). p. 8–1.
- Japan Atomic Energy Agency. The licensing document for the construction permit of the prototype FBR Monju. Japan Atomic Energy Agency; 1980. Revised 2006. [in Japanese].
- Miyakoshi H, Sato K, Shimizu T Development of analysis code for reactor flow distribution. Proceeding of AESJ spring meeting 1994; 1994 Mar 29– 31;Ibaraki (Japan). p. J11 [in Japanese].
- Usami S, Sasaki K, Deshimaru T, et al. Measurement of shielding characteristics in the prototype FBR Monju. J Nucl Sci Technol. 2000;37(Supplement 1):83–88.
- Van Erp JB, Macfarlane DR, Fauske HK. Protection against local core accidents in liquid metal fast breeder reactors. Nucl Eng Des. 1971;15:441–457.
- Sodium Technology Education Committee. Sodium technology handbook. Japan Nuclear Cycle Development Institute; 2005, JNC TN9410 2005–001. [in Japanese]
- Japanese Industrial Standards Committee. Soft magnetic irons. Japanese Industrial Standards Committee; 2000; JIS C 2504: 2000. [in Japanese].