
 ?Mathematical formulae have been encoded as MathML and are displayed in this HTML version using MathJax in order to improve their display. Uncheck the box to turn MathJax off. This feature requires Javascript. Click on a formula to zoom.
ABSTRACT
The self-leveling of debris beds is a critical phenomenon to be clarified in the safety assessment of material relocation and decay heat-removal phases in postulated core-disruptive accidents in sodium-cooled fast reactors. In recent years, we have conducted several series of experiments using simulant materials to develop an experimental database of self-leveling processes in particle beds and proposed an empirical model to predict the bed height during self-leveling. The obtained experimental knowledge and proposed model applicability have been limited to homogeneous particles, although fragmented core debris could be mainly mixtures of fuel and stainless-steel particles with a size distribution. We conducted self-leveling experiments using mixtures of solid particles with different properties to understand the characteristics of self-leveling phenomena under a wider range of conditions. An improved empirical model for transient bed height was developed to correlate the experimental data under various conditions of particle mixtures. The developed model reproduces the self-leveling development of mixed particle beds and those of the homogeneous particle reasonably.
1. Introduction
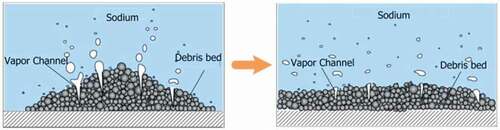
The consequences of postulated core-disruptive accidents (CDAs) have been a major concern for the safety of sodium-cooled fast reactors (SFRs) because mechanical-energy release from a re-criticality event may challenge the integrity of a reactor containment vessel. Therefore, to prevent the penetration of molten fuel through the reactor vessel and to distribute core debris that is formed in the CDA into non-critical configurations, in-vessel retention devices (e.g. the core catcher) have been used in some SFR designs to collect molten fuel on their multiple layers [Citation1,Citation2]. During a CDA, after discharging into the lower inlet plenum of the reactor vessel, molten core materials may be quenched and fragmented rapidly because of fuel-coolant interactions (FCIs). As a result, a multicomponent and multiphase mixture of liquid–gas and solid matter can be formed. The deposition of multicomponent solid matter will lead to the formation of debris beds over debris trays in the reactor vessel. However, coolant boiling that is caused by decay heat in the fuel debris could lead to a leveling-off of the debris bed. This phenomenon, which is termed self-leveling behavior as illustrated in , is of essential importance for the heat-removal capability from debris beds and neutronic characteristics, because debris bed cooling and re-criticality depend strongly on the thickness or height of the bed. Some researchers began experimental studies on this topic once they had noted the importance of self-leveling in debris bed cooling. Hesson et al. [Citation3], Gabor et al. [Citation4], and Alvarez et al. [Citation5], in particular, were pioneers in this endeavor. In separate experiments, Hesson et al. [Citation3] and Gabor et al. [Citation4] reached the same conclusion independently: self-leveling occurs easily, even under conditions of a low heat flux. Gabor et al. [Citation4] identified the potential contribution of boiling inside the particle bed to the onset of this self-leveling behavior. Alvarez et al. [Citation5] evaluated the influence of sub-cooling and power to leveling kinetics, in the form of temporal reposing-angle profiles, of a boiling particle bed by conventional heating.
Figure 1. Illustration of self-leveling behavior.
In recent years, Zhang et al. [Citation6] and Cheng et al. [Citation7–Citation9] conducted several extensive series of experiments to simulate coolant boiling during CDAs by using various bubbling methods, including depressurization boiling [Citation6], conventional pool boiling using electrical heating [Citation6] and gas injection [Citation7–Citation9]. In this study, gas injection was used because it allows the gas flow rate to be more flexibly adjusted than in the boiling method, which usually results in extremely low gas velocities compared with actual reactor conditions. It has been validated that with this system, a driving flow rate up to 10,000 L/min (equivalent to boiling intensities of several tens of W/cm3) is theoretically feasible by regulating the gas-delivery pressure [Citation8]. Because of the complex and uncertain nature of the three-phase flow that was involved in the self-leveling phenomenon, it is valuable to develop an empirical model to predict the self-leveling behavior because of its distinct advantages in calculation efficiency. With an effective empirical model, the experimental database can be expanded (interpolated or extrapolated) to provide useful knowledge for computer-model improvement and validation. By performing dimensional analysis, Cheng et al. derived a set of empirical correlations to estimate the transient behavior of spherical [Citation8] and non-spherical solid particles [Citation9] as an inclination angle of the bed mound. Morita et al. [Citation10] proposed an extensive empirical model and took into account more influential particle characteristic parameters using the characteristic time for self-leveling development and the equilibrium height of the bed. In the field of light water reactors, Basso et al. [Citation11] provided a semi-empirical model for particle mass flow rates to predict the spread of particulate debris. However, thus far, most experimental cases and empirical models in the previously mentioned studies were limited to homogenous spherical and/or non-spherical particles of the same size and density. In reality, fragmented core debris could be mixtures of mainly fuel and stainless steel particles with a size distribution. Mizuta et al. [Citation12] performed a series of experiments to gain information on the fragmentation of molten UO2 when dropped into a bath of liquid sodium. It was concluded in the study that UO2 particles can be assumed to have a particle-size distribution. Therefore, further investigations are necessary to develop an experimental database for inhomogeneous particles or multi-sized and multi-density mixed particles.
In this study, as the first step to examine the self-leveling behavior and characteristics of debris beds with a particle-size distribution, several experimental cases of binary-mixed particles, which include two different components of particles (same-size different-density and same-density different size), were performed. The mixing ratios were set to 25–75%, 50–50%, and 75–25% of each constituent particle in the gross volume. Variations in bed mound height during the self-leveling process over time were measured for various particle mixtures and gas-injection velocities. By using the dimensional-analysis approach, an improved empirical model was formulated to predict the behavior of binary-mixed particle beds consistently. The applicability of the empirical model was validated by comparing the transient bed height between the predictions and the experimental data. These extensive experimental and empirical databases are necessary to develop and validate physical models used by computer codes [Citation13–Citation15] that simulate the self-leveling phenomena under reactor accident conditions.
2. Self-leveling experiments
2.1. Experimental apparatus
shows a schematic diagram of the experimental apparatus used in this study. To visualize the self-leveling behavior of the debris bed, a transparent cylindrical tank with an inner diameter of = 0.31 m and a height of 1.0 m was used as the fundamental experimental domain. A fixed volume of solid particles with a gross volume
= 7.0 L was poured into the water-filled tank to form a conically shaped particle bed. To clarify experimentally the influence of bed diameter and particle volume on the self-leveling behavior of the debris bed, we conducted some experimental runs with
= 0.21 m and
= 3.5 L. These results will be discussed in Section 3.2. The initial water level in the tank was adjusted to 180 mm to mitigate the effect of water convection flow on self-leveling development. The outer quadrate tank was filled with water to improve visual observations inside the cylindrical tank. Water and nitrogen gas were used as simulants for the coolant and the vapor generated by boiling because of decay heat, respectively. Nitrogen gas was supplied from high-pressure gas cylinders and was distributed uniformly through a porous metallic plate before injection into the particle bed. The gas flowrate
was measured by a flow meter at the bed inlet. Overall changes in the particle bed shape were recorded using a video camera. The mound height and inclination angle of the particle bed were measured by image analysis of pictures that were extracted from video recordings at specific time intervals (0, 15, 30, 45, 60, 90, 120, 150, and 180 s). shows the definition of the measured mound height
, the inclination angle
of the particle bed, and the overall bed height
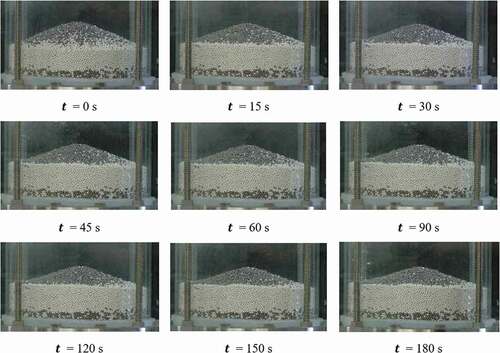
, which is the height measured from the bed bottom to the mound top of the bed. An example of the observed bed-leveling process is provided in , which shows the case for a binary mixture of Al2O3 and stainless steel (SS) particles. During gas injection, small gas bubbles that form in the water pool make the particle bed invisible. Therefore, in our experiments, we used an intermittent gas-delivery method [Citation7] for measurement. Its applicability will be discussed in Section 2.3. A detailed description of the self-leveling experiments using a gas-injection method is presented in our previous studies [Citation7,Citation8]. As discussed in our previous study [Citation10], the injection gas velocity in the experiments is small in comparison with the coolant vapor velocity in the very early stages of heat removal under accident conditions. However, it is comparable with the range of coolant vapor velocity during a long-term heat-removal phase, where the decay heat of the fuel decreases gradually. A general comparison between our experimental cases and typical reactor accident conditions is also discussed in our previous study [Citation10].
Figure 2. Schematic diagram of experimental setup for self-leveling experiments.
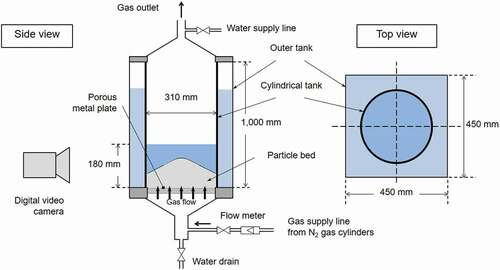
Figure 3. Definition of measured bed mound height.
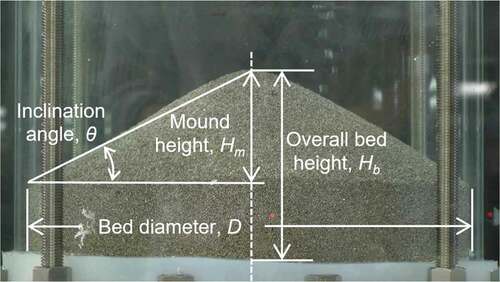
Figure 4. Observed self-leveling behavior of binary-mixed particle bed (Al2O3 (25%) and SS (75%) particles, = 2 mm,
~ 50 L/min,
= 7.0 L,
= 0.31 m).
2.2. Simulant materials
In these experiments, spherical and/or non-spherical particles of alumina (Al2O3), zirconia (ZrO2), zinc (Zn), SS, and copper (Cu) and their binary mixtures were used as debris simulants. Their physical properties are summarized in . The typical size of fragmented fuel debris formed by FCIs is on the order of 0.1–1 mm in diameter [Citation16], and hence the range of particle size in the experimental cases partly cover that in the reactor cases. The measurement of pressure drop in a fixed bed and the use of Ergun’s equation [Citation9] yield the particle sphericity . The pressure-drop-measurement experiment is explained in detail in [Citation9]. In , even though the sphericity is smaller than unity, particles that appear roughly spherical in shape are categorized as spherical particles. The measured porosity of the bed packed with spherical particles ranges from 0.376 to 0.403, which agrees well with the experimental observations of monosized-sphere packed beds in poured random packing mode obtained by pouring spheres into a container (
) [Citation17]. The spherical particle diameter was defined as a volume-equivalent diameter. The particle terminal velocity
was calculated to account for the particle sphericity to represent the effect of irregular particle shape [Citation10]. It is a critical parameter to characterize the leveling behavior because the larger drag force acting on non-spherical particles from surrounding fluids should make particles easier to float on the surface of the bed mound. In contrast, particles with irregular shapes suppress leveling development because of their larger surface area or friction with other particles. The values of
and the corresponding particle Reynolds number
at the terminal velocity in these experiments are given in .
Table 1. Physical properties of particles
2.3. Effect of gas-delivery method
In the intermittent gas-delivery method, gas injection was stopped to make the bed shape visible in the pool for measurement at a specified time. It was restarted and continued until the next measuring time. This treatment simplifies experimental operations and makes the transient measurement practical, although it inevitably suspends the leveling process. We can introduce another method that uses continuous gas delivery. In this method, each experimental run that starts from the beginning and finishes at a specified time is executed repeatedly for the necessary number of measuring times. The continuous gas-delivery method can reproduce the continuous self-leveling process, although we have a heavy load of experimental operations.
The intermittent gas-delivery method that was used in these experiments, may cause a ‘water-piston’ effect of sudden water discharge from the particle bed, which is driven by restarted gas injection. This effect makes the particle beds collapse or self-level more rapidly. To validate the intermittent gas-delivery method, we compared results with those obtained by the continuous gas-delivery approach. shows the mound height obtained by the intermittent and continuous gas-delivery methods for (a) Al2O3 particles with
= 6.01 mm at
= 46 L/min and (b) SS particles with
= 2.00 mm at
= 46 L/min in a cylindrical bed with
= 0.21 m. The particle gross volume was 7.0 L in both cases. An approximately equivalent behavior could be observed regardless of the gas-delivery method. This result shows that the intermittent gas-delivery method can reproduce the continuous self-leveling process under these experimental conditions despite the unavoidable ‘water-piston’ effect.
Figure 5. Comparison of bed mound variation between intermittent and continuous gas-injection methods ( ~ 46 L/min,
= 7.0 L,
= 0.21 m).
3. Experimental results
3.1. Fitting method of experimental data
If particles on the mound slope overcome static forces, such as inter-particle friction, they will start falling off the mound slope. However, as leveling develops, the component of gravity along the slope decreases, decelerates the leveling process and finally, the leveling stops at a certain mound height that is termed the equilibrium mound height . According to our previous study [Citation10] for homogeneous particles, the following equation was proposed for the transient height
of the bed mound, which is defined as in :
where is the reference initial mound height at
= 0 s,
is the equilibrium mound height, and
is the characteristic time constant. In our previous study [Citation10], the values of
and
were correlated to experimental data assuming that they depend on the gas-injection velocity, particle and fluid properties, and the geometrical bed dimensions.
The self-leveling rate or velocity can be found as the time derivative of the transient bed height
where is the time-dependent self-leveling rate and
is the maximum self-leveling rate at
= 0 s. EquationEquation (2)
(2)
(2) indicates that the leveling rate, which is proportional to the square of the leveling potential
, depends on
and
. Therefore, in this study, the empirical correlation of
was formulated by using common parameters with the correlation of
.
In these experiments, because the particles were poured randomly into a cylindrical tank, it was difficult to adjust the same initial bed height for all experimental cases. To overcome this experimental difficulty, we assumed that the self-leveling process occurs at
= 0 s from the same initial bed height
, which was sufficient to cover all ranges of initial bed height in these experiments. The measured times of the experimental data points were adjusted to be consistent with the transient development of this initial bed height according to EquationEquation (1)
(1)
(1) . Its mathematical procedure is described in our previous study [Citation10].
3.2. Effect of bed diameter
compares the mound height between
= 0.31 m (round points) and
= 0.21 m (triangle points) for (a) ZrO2 particles with
= 2.00 mm and (b) SS particles with
= 4.00 mm. Both cases were performed for the particle bed with a gross volume of 7.0 L. The gas flow rate was adjusted in accordance with the bed diameter to achieve the same superficial gas-injection velocity. For example, for
= 0.31 m, the gas flow rate
was 50 and 100 L/min, whereas for
= 0.21 m it was
= 23 and 50 L/min. shows obvious differences in the self-leveling behavior between the cases with
= 0.21 and 0.31 m. The self-leveling process development for
= 0.21 m is faster than that for
= 0.31 m. This occurs because the variation in bed diameter or particle volume leads to changes in the height of the lower part of the bed. As a result, the gas-velocity profile changes before the gas flows into the cone-shaped mound of the bed that affects particle motion.
Figure 6. Effect of cylindrical bed diameter on mound height variation ( = 7.0 L).
3.3. Effect of particle volume
shows the influence of particle volume by comparing between
= 3.5 L (round points) and
= 7.0 L (triangle points) for (a) ZrO2 particles with
= 2.00 mm at
= 23 L/min and (b) SS particles with
= 4.00 mm at
= 46 L/min. The bed diameter was 0.21 m in all cases. At the early stage of self-leveling, particle beds with
= 7.0 L collapse faster than those with
= 3.5 L. A higher lower part of the bed with a larger particle volume may promote a uniform gas distribution over the bed cross section. This suspends the particle bed at the bed surface and leads to a more efficient self-leveling development.
Figure 7. Effect of particle volume on mound height variation ( = 0.21 m).
3.4. Effect of volume mixing ratio
shows the effects of particle properties on the of various binary mixtures with different-density particles of equal size ((a) Al2O3 and SS particles with
= 6.00 mm), the same-density particles of different sizes ((b) SS particles with
= 2.00 and 4.00 mm and (c) ZrO2 particles with
= 1.00 and 2.00 mm), and the same-density particles of different shape ((d) SS particles with
= 2.00 mm, and
= 1.0 and 0.81). In general, there is a common trend that when the volume fraction of heavier/larger or more uneven particles (smaller sphericity) develops, the particle mixtures become more difficult to level off. This may occur because, under such conditions, either the larger inertial resistance that is exerted from the heavier/larger particles or the larger inter-friction between non-spherical particles tends to make particles less susceptible to be moved by gas flow.
Figure 8. Effect of mixing ratio on mound height variation in various particle mixtures ( = 7.0 L,
= 0.31 m).
4. Development of empirical model
In the previous study, we assumed that and
depend on
,
,
,
, the gas viscosity
, the density difference between the solid particle and the liquid
, the gas density
, the surface area of particle
or
, and
. By using the dimensional-analysis method, we proposed the following dimensionless equations to correlate
and
for homogeneously spherical and non-spherical particles:
and
where and
~
(i = 1 and 2 in EquationEquations (3)
(3)
(3) and (Equation4
(4)
(4) ), respectively) are the empirical constants to be determined from the experimental data. The gas Reynolds number
and the gas-phased Archimedes number
for liquid-buoyed solids are defined, respectively, by
However, based on the above discussions on the experimental database in Chapter 3, we found that the self-leveling behavior also depends on and
. Therefore, instead of using the bed height of the cone-shaped mound, we utilized the overall bed height
, which is the height measured from the bed bottom to the top mount of the bed. The relationship between
and
is expressed by the following equation, assuming that a conical bed mound formed:
Therefore, we have
and
where and
are the equilibrium bed height and the predefined initial bed height measured from the bed bottom, and
is the maximum self-leveling velocity of the overall bed height.
We noted that because the bed interstice narrows the gas-injection cross-sectional area significantly, and increases the gas flow rate, the superficial gas-injection velocity , which was used in the empirical model for homogeneous particles, should be modified to take into account the effect of bed porosity on the gas-injection cross-sectional area as follows:
In consequence, in the improved empirical model, we do not consider ε to be one of the correlation parameters because it is already included in the interstitial gas velocity , which is the average velocity that prevails in the pores of the particle bed.
Finally, the following equations are proposed as a new empirical model for and
in EquationEquations (8)
(8)
(8) and (Equation9
(9)
(9) ), respectively:
and
The gas Reynolds number, EquationEquation (6)(6)
(6) , was calculated by replacing the superficial gas-injection velocity
with the bed-averaged interstitial gas velocity
in EquationEquation (10)
(10)
(10) . The mass equivalent density
and volume-equivalent diameter
of the particle mixture are defined as averaged values by the following equations, respectively:
and
where the subscript represents particle component
in the mixture and the number of particle components
is 2 for a binary mixture.
5. Result analysis
5.1. Binary mixtures
To perform the regression analysis for EquationEquations (11)(11)
(11) and (Equation12
(12)
(12) ), we used 62 experimental cases, including 19 cases with spherical particles, 12 with non-spherical particles, and 31 with binary-mixed particles. All cases used in this analysis were those obtained for
= 0.31 m and
= 7.0 L. The binary mixtures include 23 cases with different-density particles of equal size and 8 cases with the same-density particles of different sizes and/or sphericity. shows the experimental cases used to determine the model parameters. The linear regression analysis gives the following results:
Table 2. Experimental cases used to determine model parameters
and
shows the results of the regression analysis for and
. The values obtained for the coefficients of determination
indicate that 85.0% and 87.0% of the variability in the data points for
and
, respectively, can be described by the regression equations. The average and maximum relative RMS errors for
between the predicted and experimental values are 2.48% and 8.00%, respectively, whereas those for
are larger because
is highly sensitive to the transient behavior of the self-leveling process, which may be difficult to determine exactly in these experiments.
Figure 9. Comparison of model parameters between experiments and predictions.
Based on and
that were predicted by the above equations, we performed a transient analysis of the self-leveling behavior over time using EquationEquation (8)
(8)
(8) . A comparison of the transient mound height
between the experimental and predicted values is indicated in . Over the 62 cases with 774 experimental data points, the present empirical model for
and
can predict all data points of the transient bed mound height within a deviation of ±10.0% compared with the experimental results. The average relative RMS error between the predictions and the experimental values is 3.07% with a maximum value of 8.00%.
Figure 10. Comparison of mound height between experiments and empirical model.
shows the effect of volume mixing ratio on overall bed height of various binary particle mixtures. (a) shows that for the binary mixtures of different-density particles with equal size, for example, the binary mixture of spherical Al2O3 and SS particles with
~ 4.00 mm, the model can predict
reasonably. The slower decrease in
can be observed as the fraction of particles with a larger density increases. A similar behavior results for the binary mixtures of spherical Al2O3 and ZrO2 particles with
~ 4.00 mm as depicted in (b). For binary mixtures with the same-density particles of different size, for example, as shown in (c), the model predicts
well for the mixture of spherical SS particles with
= 2.00 and 4.00 mm. As the fraction of larger particles increases in the mixture, it becomes more difficult to level off the particle bed. A good agreement is obtained as shown in (d) for the binary mixture of particles with different shapes, that is, the binary mixture of spherical SS particles with
= 2.00 mm and ϕ = 1.0 and non-spherical SS particles with
= 2.00 mm with ϕ = 0.81. These trends in the self-leveling process predicted by the empirical model for
,
, and
as described in EquationEquations (8)
(8)
(8) , (Equation13
(13)
(13) ), and (Equation14
(14)
(14) ) are consistent with the experimental observations in Section 3.4.
Figure 11. Effect of mixing ratio on transient mound height of various binary particle mixtures ( = 7.0 L,
= 0.31 m).
5.2. Model application to ternary mixtures
To validate the applicability of the empirical model, we applied the model to the self-leveling behavior of a ternary mixture, which contain three components of particles with different sizes. The physical properties of the ternary mixture are shown in . The volume-equivalent density and diameter of the mixture were calculated by EquationEquations (13)(13)
(13) and (Equation14
(14)
(14) ). shows the predicted values of the transient bed height
over time for the ternary mixture using the empirical correlation, EquationEquations (13)
(13)
(13) and (Equation14
(14)
(14) ). The empirical model can predict the tendency in self-leveling behavior of the ternary mixture within an average error of 3.37% and 1.19% for
= 200 and 300 L/min, respectively. These results suggest the potential applicability of the empirical model to mixed particles with a size distribution.
Figure 12. Self-leveling behavior of ternary mixture (spherical SS particles with = 2.00, 4.00, and 6.00 mm;
= 7.0 L;
= 0.31 m).
6. Concluding remarks
A series of self-leveling experiments using a gas-injection method was performed for mixed particles with different properties mixtures to develop an extensive experimental database for self-leveling processes of particle beds in a cylindrical system. An improved empirical model was developed to correlate the experimental data for homogeneous particles with different densities, sizes or shapes and their mixtures. The proposed empirical model can predict the experimental data reasonably well for a wide range of experimental conditions. Further experiments are necessary to expand the experimental database and empirical correlations for different bed diameters, particle volumes, and particle-size distributions. These results will help us to have a first look into the self-leveling behavior of mixed particles and a further study on the self-leveling of a debris bed.
Nomenclature
Table
Acknowledgments
We thank Laura Kuhar, PhD, from Edanz Group (www.edanzediting.com/ac) for editing a draft of this manuscript. We are grateful to Mr. Matsuoka Fumiya from Kyushu University for his cooperation in the experiments.
Disclosure statement
No potential conflict of interest was reported by the authors.
References
- Tentner AM, Parma E, Wei T, et al. Severe accident approach – final report: evaluation of design measures for severe accident prevention and consequence mitigation. Report no. ANL-GENIV-128. USA: Argonne National Laboratory; 2010.
- Waltar AE, Reynolds AB. Fast breeder reactors. New York: Pergamon Press; 1981.
- Hesson JC, Sevy RH, Marciniak TJ. Postaccident heat removal in LMFBRs: in-vessel considerations. USA: Argonne National Laboratory; 1971. ( ANL-7859).
- Gabor JD, Sowa ES, Baker L Jr, et al. Studies and experiments on heat removal from fuel debris in sodium. Proc. Fast Reactor Safety Meeting; 1974 Apr 2–4; Beverly Hills, USA. p. 823–844.
- Alvarez D, Amblard M. Fuel leveling. Proc. 5th Information Exchange Meeting on Post Accident Debris Cooling; 1982 Jul 28–30; Karlsruhe, Germany. p. 9–12.
- Zhang B, Harada T, Hirahara D, et al. Experimental investigation on self-leveling behavior in debris beds. Nucl Eng Des. 2011;241(1):366–377.
- Cheng S, Yamano H, Suzuki T, et al. An experimental investigation on self-leveling behavior of debris beds using gas-injection. Exp Thermal Fluid Sci. 2013;48:110–121.
- Cheng S, Tagami H, Yamano H, et al. Evaluation of debris bed self-leveling behavior: a simple empirical approach and its validations. Ann Nucl Energy. 2014;63:188–198.
- Cheng S, Tagami H, Yamano H, et al. An investigation on debris bed self-leveling behavior with non-spherical particles. J Nucl Sci Technol. 2014;51(9):1096–1106.
- Morita K, Matsumoto T, Nishi S, et al. A new empirical model for self-leveling behavior of cylindrical particle beds. J Nucl Sci Technol. 2016;53(5):713–725.
- Basso S, Konovalenko A, Kudinov P. Empirical closures for particulate debris bed spreading induced by gas-liquid flow. Nucl Eng Des. 2016;297:19–25.
- Mizuta H. Fragmentation of uranium dioxide after molten uranium dioxide-sodium interaction. J Nucl Sci Technol. 1974;11(11):480–487.
- Guo L, Morita K, Tobita Y. Numerical simulations on self-leveling behaviors with cylindrical debris bed. Nucl Eng Des. 2017;315:61–68.
- Tagami H, Cheng S, Tobita Y, et al. Model for particle behavior in debris bed. Nucl Eng Des. 2018;328:95–106.
- Yamano H, Tobita Y, Fujita S, et al. First 3-D calculation of core disruptive accident in a large-scale sodium- cooled fast reactor. Ann Nucl Energy. 2009;36(1):337–343.
- Fauske HK, Koyama K. Assessment of fuel coolant interactions (FCIs) in the FBR core disruptive accident (CDA). J Nucl Sci Technol. 2002;39(6):608–614.
- Ribeiro AM, Neto P, Pinho C. Mean porosity and pressure drop measurements in packed beds of monosized spheres: side wall effect. Ireche. 2010;2(1):40–46.