
 ?Mathematical formulae have been encoded as MathML and are displayed in this HTML version using MathJax in order to improve their display. Uncheck the box to turn MathJax off. This feature requires Javascript. Click on a formula to zoom.
ABSTRACT
This paper presents a combined experimental and numerical simulation approach to investigating safety issues related to postulated loss-of-flow accident (LOFA) cases, which are more likely to occur in the NUR Research Reactor (Algeria).
The transients investigated at nominal-power operating conditions are related to the loss of flow resulting from an instantaneous shaft break in the main cooling pump of the NUR reactor.
The investigations are based on hydrodynamic and thermal hydraulic experiments to assess the reactor cooling system’s behavior.
3D Monte Carlo neutron transport calculations were performed with the (MCNP) code to determine the resulting neutronic properties of the core. In the accident analysis, a model of the primary cooling system was applied via the RELAP5 code. The experimental data and RELAP5 predictions showed good agreement. Additionally, the LOFA due to the transient scenario of the pump shaft break was compared with the LOFA due to normal loss of the coolant pump power transient. The results obtained from the transient (LOFA) studies revealed that in both cases, the lower limit of the minimum critical heat flux ratio and minimum onset of flow instability ratio for NUR is satisfied with a sufficient margin.
1. Introduction
The current study was performed within the regulatory framework in conjunction with a periodic safety review of the NUR Research Reactor (RR).This paper focuses on special safety issues related to the loss-of-flow accident (LOFA) resulting from a primary pump shaft break in the low-power RR region.
Safety reassessment of the NUR [Citation1], among various low-power RRs, is mainly affected by the reactor core design characteristics (low temperatures, low pressures, low flow velocity, core flow direction), and other reactor features, such as the high core bypass flow rate [Citation2] and frequent reactor core modifications [Citation3]. Thus, an accurate evaluation of the primary flow coastdown characteristics in LOFA is critical to ensure the safe shutdown of the reactor [Citation4–Citation6].
The pump coastdown depends strongly on the moment of inertia of the pump’s rotational components (i.e., the rotor, coupling, shaft, and impeller). However, for the NUR coolant pump, this moment of inertia is nearly negligible compared with more powerful RRs equipped with pump flywheels. Consequently, this scenario induces a sudden deceleration of the fluid to zero, and core flow reversal occurs during a short time period (a few seconds in the NUR case) of pump coastdown. Hence, the reactor decay heat must be removed during a short transition range from forced convection (FC) to natural circulation conditions. In this case, the transient related to the core flow reversal is of particular interest [Citation7] for safety design and evaluation because the fuel temperature suddenly increases and the critical heat flux ratio (CHFR) suddenly decreases.
Hence, imperfect prediction of the reactor system parameters affects the prediction of key core variables during the normal operation as well as during transients and accidental conditions to prevent fuel meltdown.
The NUR reactor coolant pump is a horizontal, single-stage, centrifugal pump equipped with a flexible gear coupling. The gear coupling design consists of two flanged sleeve halves, which are bolted together. During scheduled annual maintenance, both flanged sleeves are often not sufficiently tightened. In this scenario, a primary pump shaft break is more likely to occur during the operating life of the facility, and improper bolt tightening of the gear coupling might be the main cause of unexpected LOFA.
With the aim of predicting the relevant thermal hydraulic parameters under steady state (nominal power level) and under the presented transient-flow scenarios, the time-dependent transient behavior of the reactor was calculated using RELAP5 code [Citation8]. The RELAP 5model developed for the NUR was assessed against three sources. First, because of the difficulty in predicting the core flow distribution [Citation9], the model was assessed against reactor hydrodynamics tests to evaluate the core pressure drop and by the bypass channel flow fraction. These tests were conducted by adjusting the primary coolant flow rates at different levels (nominal flow rate of ±30% at zero power). Second, the NUR RELAP5 model was assessed against primary flow coastdown tests at different flow rates to evaluate the reactor flow transients. Third, the model was also assessed against thermal hydraulic experimental data from the NUR’s Computer-Aided Operational and Supervising System (CAOSS) and from the hourly reactor log sheets at nominal power. Moreover, the reactor pool portion of the RELAP5 model is based on experimental data [Citation10] for the NUR reactor under natural convection (NC) mode operation.
To assess the safety aspects associated with an extended operational period under FC at full power, two transients were selected based on their probability of occurrence under the FC-operating mode. This work addresses the prediction of a protected transient initiated by loss of pump power and loss of flow due to reactor coolant pump shaft break scenarios.
Under such operating conditions, the second transient scenario was not thoroughly investigated in the literature [Citation11–Citation14]. The analysis of each accident scenario was designed to fall under the conservative initial conditions and within the normal limits of operation. The reactivity feedback effects were not considered in this analysis.
The NUR reactor protection system logic is modeled to initiate a trip after the appropriate instrumentation response delay when the setpoint is reached. In addition, the limiting fuel temperature and CHFR are calculated.
Furthermore, post-processing of the simulation results has been conducted to evaluate the minimum CHFR and minimum onset of flow instability ratio (OFIR) using the Sudo–Kaminaga correlations [Citation15,Citation16] and Whittle and Forgan criteria [Citation17], respectively. The Sudo–Kaminaga correlation based on the JRR-3 RR thermal hydraulic experiment is still of great interest according to more recent safety studies [Citation18].This correlation covers a wide range of MTR-type reactor operating conditions and is tested for a mass velocity range from 25,800 kg/m2-s downflow through stagnant flow to 6250 kg/m2-s upflow and a pressure range from 1 to 7.2 bar. Moreover, this approach is recommended for use under natural circulation flow rates in rectangular coolant channels.
2. Experimental section
2.1. Description of NUR reactor
NUR is a 1MW MTR/LEU-fueled, light-water moderated and cooled, graphite-reflected, open-pool-type RR. This reactor is owned and operated by the Nuclear Research Center of Draria with the objective of furthering its educational and research goals. The reactor first achieved criticality in 1989 ().
Table 1. Main characteristics and operating data of the NUR reactor [Citation1,Citation20]
Figure 1. Schematic view of the major components of the primary and secondary coolant systems of the NUR.
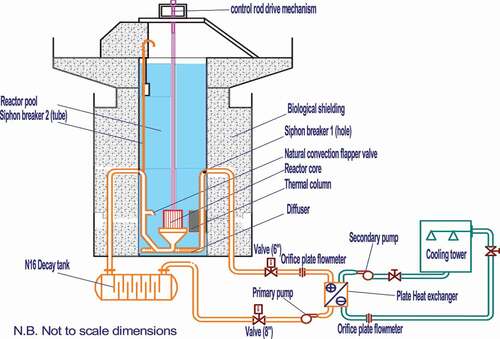
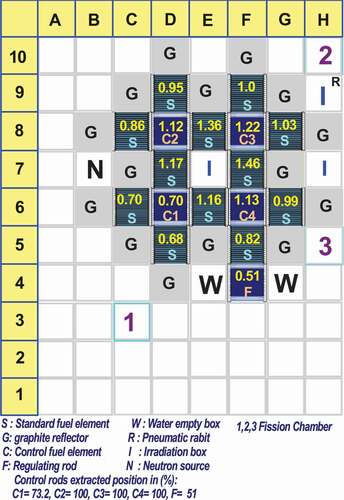
Figure 2. The radial power peaking factors distribution and associated extraction percentage of control rods.
A schematic view of the major components of the NUR coolant system is shown in . The actual core configuration () considered in this study consists of 17 fuel elements with three positions available for in-core experiments, including an experimental position flux trap through the center of the core.
The reactor is designed to operate at a maximum thermal power of 1000 kW with forced cooling or up to 100 kW in NC mode [Citation1]. Under normal operating mode, the reactor is characterized by downward flow through the fuel region and low-pressure and low-temperature conditions. For this mode of operation, the coolant is drawn from the inlet plenum and removes the heat generated in the reactor core after passing through the fuel assemblies, the in-core irradiation box (flux trap) and the bypass holes of the grid plate. From the core lower plenum, the coolant flows via 8-inch outlet piping to the decay tank. The latter retains sufficient coolant for the decay of N-16 generated as the water passes through the core. After leaving the decay tank, the coolant is routed to the heat exchanger (HX), where heat is transferred to the secondary cooling system, which releases this thermal energy through the cooling tower to the atmosphere. Upon exiting the heat exchanger, the coolant flows through a 6-inch pipe, including an orifice flowmeter, flow control valve, and annular diffuser. The diffuser body has several orifices to allow the coolant to travel upward from the bottom to the upper portion of the pool and back down through the reactor core.
Ball valves located in the 6- and 8-inch lines are adjusted manually to maintain the desired flow rate and pressures within the range of nominal operation.
Siphon break lines are installed on the reactor pool inlet lines and core outlet lines (see ) to avoid complete pool water drainage in the event of a pipe failure in the primary cooling system.
Under NC operating mode, the generated nuclear power simply heats up the pool water and is ultimately dissipated through the pool surface to the containment atmosphere. Hence, the large pool supplies a heat sink for the energy generated within the core, and both the water and concrete walls offer radiation shielding. The pool surface is open to the containment atmosphere, where thermal energy exchange can occur via evaporation and convection heat transfer. In the case of loss of primary flow under FC operating mode and due to the decreasing pressure in the primary circuit, the NC flapper valve opens automatically, leading to reverse flow in the reactor core and supplying a natural circulation flow path for decay heat removal. In contrast, under NC operating mode, the flapper valve remains open during the entire process. In both cases, the natural circulation flow ensures safe reactor core cooling by the NC, and all decay heat can be absorbed completely by the large water inventory of the reactor pool (approximately 64 m3) with no need for further external cooling.
2.2. RELAP5 model of NUR under forced convection operating mode
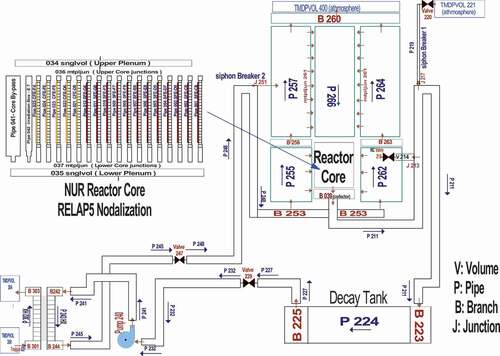
The RELAP5 model developed for the NUR is illustrated in . The model includes a detailed representation of the reactor core, the reactor pool and its major components (flapper valve, siphon breakers, diffuser), a decay tank, two main ball valves, a primary pump, a heat exchanger, various fittings, and the secondary coolant system (with less detail than the primary system).
Figure 3. RELAP5 nodalization of the NUR (RR) primary cooling system.
Documented data from the NUR operation, its design characteristics, component tests, NUR-specific experiments, and other pertinent experiments performed independent of NUR were used to construct the model and validate it to the extent permitted by the data.
The geometric inputs for the NUR are based on a 3D drawing of the cooling systems and the associated material properties required for both forced and NC flows. The current model is also based on sensor locations throughout the reactor coolant systems for a more reliable prediction of thermal hydraulics parameters (e.g. temperature, pressure, pressure drop, flow rate, and water level).
The reference codes for each component are provided in .
Table 2. Main nodalization components and reference code
The main reactor pool is subdivided into six (06) major portions using the RELAP5 pipe components P-255, P-257, P-262, P-264, and P-266 and 19 channels in the core region.
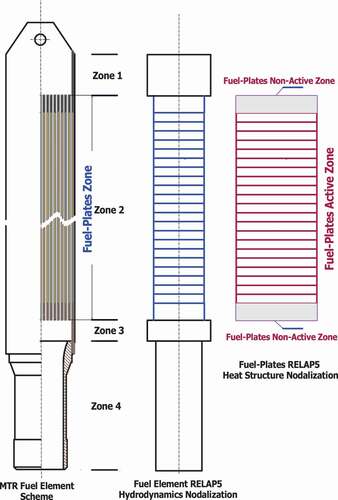
In the core region, 17 (12 SFE and 5 CFE) heated channel models were assumed in the code, in which each of the fuel assemblies was modeled in four axial regions (see ) as a unique hydrodynamic pipe component according to its different flow path sections and the corresponding heat structure components. In addition, the core region includes two other pipe components represented by the core bypass and in-core irradiation box (flux trap).
Figure 4. RELAP5 model of the NUR fuel element and the corresponding coolant channel.
The RELAP5 pump model, including the homologous curves for the NUR pump, is based on the pump manufacturer data. The heat exchanger was modeled by combining the pipe, branch, and heat structure RELAP5 components in such away that the resulting heat exchanger performance was consistent with the experimental data. In the heat exchanger model, a one-to-one correspondence exists among the primary side volumes, heat structures, and secondary side volumes (10 flow volumes and 10 heat structures).
The decay tank was discretized into 10 flow volumes. For the remaining components, the system was discretized as precisely as possible, including all of the friction losses (i.e. elbows, wyes, expansions, and reductions) in the piping [Citation19] at the correct locations.
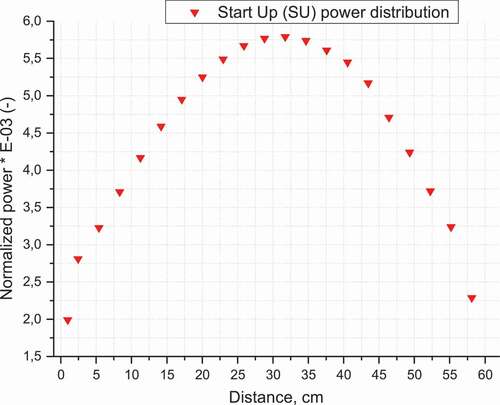
The neutronic calculation carried out in the former studies [Citation20] was reexamined in light of the more detailed reactor core nodalization. The adopted nodalization presented herein for NUR is quite different from that applied to the previous core thermal hydraulic studies [Citation6,Citation10].Both of the abovementioned studies used the subchannel-lumping approach. Thus, a model including two independent channels, the hot and average channels, was adopted to represent the reactor core.The current study requires the determination of the axial and radial power factors within each fuel element to predict the local power distributions. Thus, a detailed 3D MCNP [Citation21] Monte Carlo model was used to calculate the NUR core physics input for the accident analyses, including the startup power distributions and the reactivity worths of the control rods. This model included a plate-by-plate description of each fuel assembly, the grid-support of the core, the geometry of the control rods, and the thermal column (graphite block). The power distributions were used to determine the local fuel conditions and the CHF and OFI ratios during the transient. This MCNP model was validated against experimental data [Citation20]. and show the radial relative power distribution in the reactor core and the initial power distribution in the heat structure of the hot channel (hot fuel assembly), respectively.The radial factor is defined as the ratio of the average linear power density in the element to the average linear power density in the core. The power profiles were subsequently parsed into the thermal hydraulic code RELAP5 to determine the temperature profiles.
Figure 5. Initial power distribution in the hot-channel (fuel assembly) heat structure.
As expected, the highest peak heat fluxes occurred in the fresh core. Thus, the fresh core model was used in subsequent accident analyses to be conservative.
The core RELAP5 model was developed in accordance with the core MCNP model, in which each fuel assembly is modeled with vertical pipe components axially divided into 26 volumes, and the axial power distribution along each fuel-assembly active zone is represented by 21 equidistant mesh points [Citation22]. In the radial direction, the solid (heat structure) portion (half fuel plate) was discretized using 7 equidistance mesh points.
A steady-state analysis of the NUR (RR)was performed using the RELAP5 model described above, with the initial and boundary conditions defined in in accordance with the experimental conditions.
Table 3. Initial and boundary conditions
2.2.1. Description of the experiments
2.2.1.1. Description of the primary flow coastdown tests
Because the NUR main coolant pump is not supplied with a flywheel, its flow coastdown period is shorter than that of other RRs.
The moment of inertia of the coupled rotating components of the pump was estimated as 0.31 kg.m2.The total flow rate was measured using the insitu flowmeter as the pump coasted down. The pump friction torque coefficients were adjusted in the RELAP5 input model until the results closely matched the measured coastdown curve sufficiently (–). In the RELAP5 model, the pump frictional torque (τfr) is modeled as a cubic function of the pump rotational velocity and is expressed as
Figure 6. Comparison of RELAP5 simulated primary flow coastdown with experimental data- max flow rate = 230 m3/h.
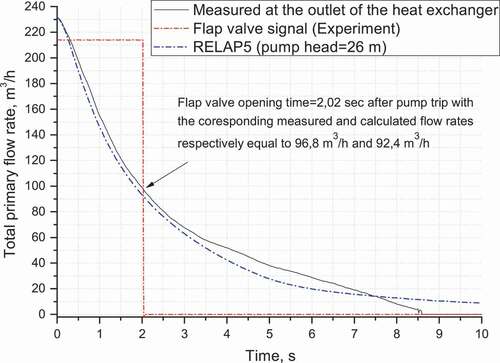
Figure 7. Comparison of RELAP5 simulated primary flow coastdown with experimental data – max flow rate = 220 m3/h.
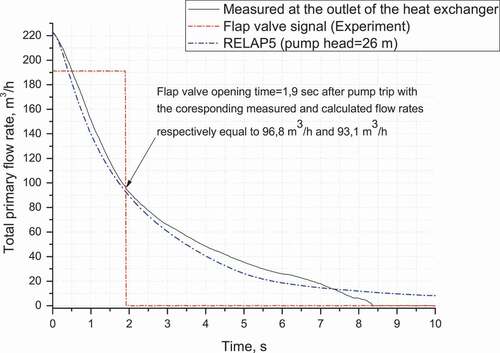
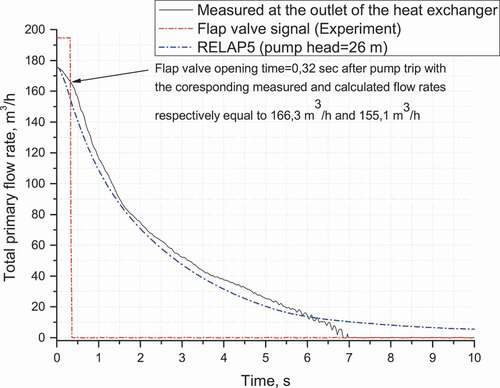
Figure 8. Comparison of RELAP5 simulated primary flow coastdown with experimental data-max flow rate = 176 m3/h.
where ω is the pump rotational velocity, ωR is the rated pump rotational velocity and,
,
, and
are input data. The pump friction torque is negative if
and positive if
.
The friction torque coefficient values introduced in the RELAP5 input are,=9.0,
=−9.2,
=7.5 and
=−9.6, respectively.
As the flow decreases, as shown in –, the flapper valve opens at 2.02, 1.90, and 0.32 s, which correspond to maximum flow rates of 230, 220, and 176 m3/h, respectively.
The measured data were obtained from the CAOSS of the NUR. The simulation and experimental results are shown in –. In addition, the primary pump coastdown time during a loss of pumping power at the nominal flow rate (220 m3/h) was measured using a tachometer, and this measured coastdown time was equal to 7.8 s. Consequently, using the comparison between the primary pump coastdown time (7.8 s) and primary flow coastdown time (8.4s), as depicted in , the primary flow rate vanishes 0.6 s after the primary pump stops running, which explains the coherence of these two experiences.
2.2.2. Description of the primary circuit hydrodynamic experiment
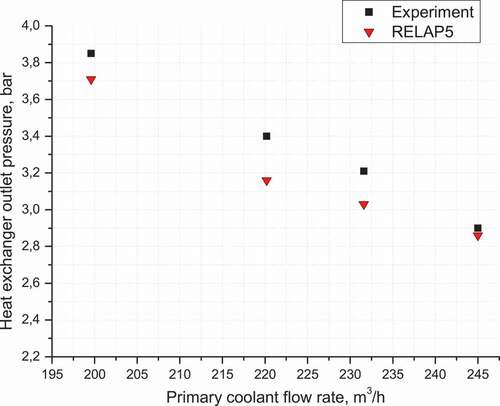
To evaluate the hydrodynamic behavior of the primary coolant system at variable flow rates, an experiment was carried out to evaluate the core bypass flow fraction and the pump downstream valve head loss coefficient through in-situ measurements of the reactor core pressure drop and the gauge pressures at the existing primary circuit locations. and – summarize the comparison between the experimental and RELAP5 simulation data.
Table 4. Comparison between the RELAP5 calculations and experimental data of the reactor core pressure drop
Figure 9. Reactor core pressure drop versus primary coolant flow rate.
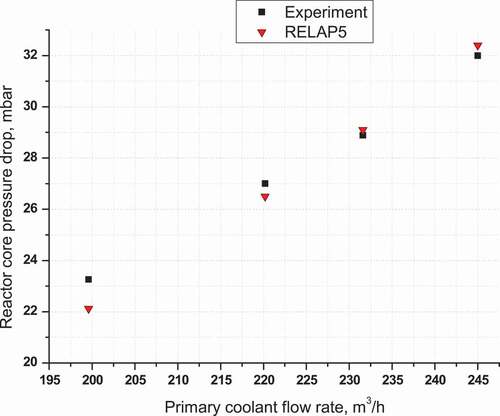
Figure 10. Primary pump outlet pressure versus primary coolant flow rate.
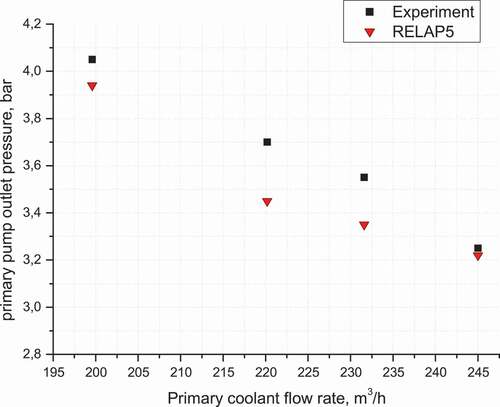
Figure 11. Heat exchanger outlet pressure versus primary coolant flow rate.
3. Results
3.1. RELAP5/MOD3.2 simulation results
3.1.1. Steady-state results and comparison with the experimental data
A calculation was performed to simulate the NUR operation at a nominal power (1000 kW) level with forced flow cooling using the RELAP5 model described above under the initial conditions defined in .
shows a comparison of the simulation results and the NUR experimental data.
Table 5. Comparison of the calculated and measured thermalhydraulic parameters after 8 h of reactor operation at nominal power
The reactor power was ramped up instantaneously to 1000 kW. This power level was maintained at a constant level until the end of the calculation. The simulation end time corresponded to the reactor thermal equilibrium (steady state) reached approximately 8 h later.
The RELAP5 analysis results show that the hydrodynamics reached steady-state parameters via the primary coolant system after approximately 5 s. All coolant channels of the core displayed stable sub-cooled downward flow. At the end of the calculation (see ) occurring at 28,800 s (8 h) from the simulation starting point and corresponding to the reactor thermal steady state, the peak fuel surface temperature reached approximately 63.90°C, which is 52.90°C below the saturation temperature. The bulk temperature of the coolant at the hot spot is 40.80°C, the core total mass flow rate is 60.5 kg/s (the bypass flow rate corresponds to 25% of the total flow rate), and the maximum velocity of the hottest channel is 0.85 m.s−1.
Figure 12. NUR reactor core coolant (inlet and outlet) and maximum fuel centerline temperatures at nominal power (1000 kW).
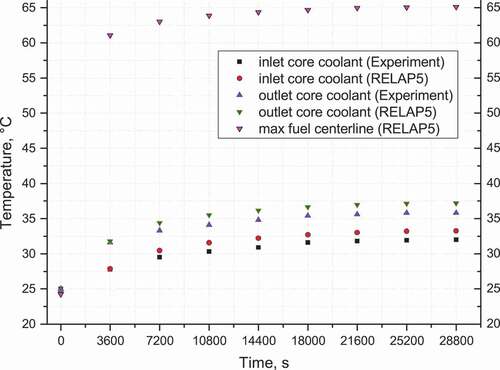
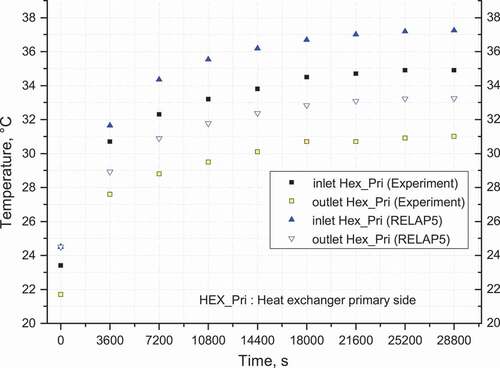
and show the core average inlet and outlet temperatures from time zero to 28,800 s (8 h) and the heat exchanger (primary side) inlet and outlet temperatures at nominal power, respectively. However, this duration (8 h) remains important due to the initial conditions of the reactor system and the thermal inertia of the reactor pool (water volume capacity of 64 m3). The maximum temperature deviation observed between the simulation and experiment does not exceed 7.5%. Thus, the comparison shows that the simulation values are in good agreement with the NUR experimental values.
Figure 13. Comparison between heat exchanger (primary side) inlet and outlet coolant temperatures at nominal power (1 MW).
From a safety point of view, two relevant criteria are used to demonstrate the safety margin for the nominal power-operating mode. The first criterion is the CHFR using the Sudo–Kaminaga CHF correlation [Citation16]. The second criterion is OFIR using the Whittle and Forgan correlation [Citation17]. Both correlations mentioned herein consider the NUR reactor core behavior under nominal or transient operating conditions.
The predicted steady-state core thermal hydraulic results are summarized in .
Table 6. Steady-state core thermal hydraulic results at nominal power (1000 kW)
The calculated CHFR and OFIR show ample thermal safety margins for steady-state operating conditions. The OFIR criterion is known to be more limiting at times under low-flow conditions than are the CHFR criterion [Citation23] (NUREG-1537-PART2, 1996).
3.2. Protected loss-of-flow accident results
The accidents considered herein are loss off low resulting from loss of pump power and loss of flow resulting from a break in the primary pump shaft. In this scenario, the shaft of the primary pump is assumed to break suddenly, imposing a rapid flow decrease, but the reactor scram as a result of low flow is delayed.
The transient was assumed to begin from a nominal pump flow of 220 m3/h with a scram delay of 0.5 s (conservative value) resulting from detection of a low flow signal (176 m3/h). According to experimental data, at the nominal flow rate (see ), the flap valve opens 1.9 s later, after the pump trip.
RELAP5 was run to establish the steady-state operating conditions (see ), which were used as the initial conditions in the postulated NUR accident analysis. The reactor was assumed to operate with all critical parameters at the most unfavorable extreme values of their normal ranges. This scenario assures that worst-case initial conditions that could be anticipated are considered in this analysis.
Table 7. Steady-state operating conditions for the LOFA scenarios
The predicted steady-state core thermal hydraulic results are summarized in .
Table 8. Predicted steady-state core thermal hydraulic results at 1.2 MW
The primary system flow, reactor power, fuel assembly flow, and peak clad temperature were examined in detail together with the minimum CHFR and OFIR.
A series of plots that trace the total power, primary coolant and hot fuel assembly flow rates, max fuel temperatures, and (CHFR)and (OFIR) histories during the transients are presented in –.
Figure 14. (a). Total reactor power response in loss-of-flow-accidents: wide range. (b). Total reactor power response in loss-of-flow-accidents: narrow range.
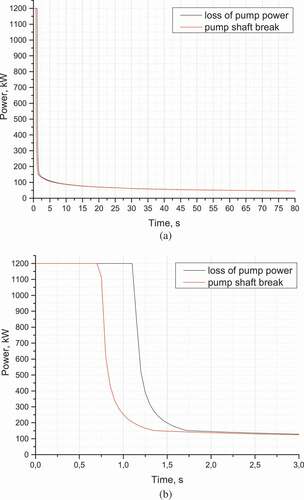
Figure 15. Total reactor coolant flow rates in loss-of-flow-accidents.
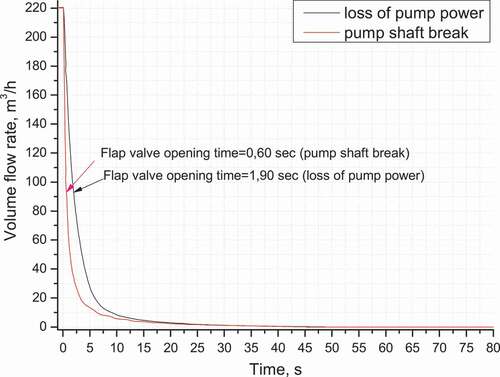
Figure 16. Max fuel temperatures behavior of the hot fuel assemblies in LOFAs.
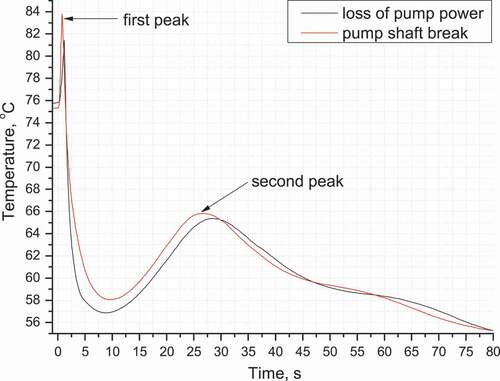
Figure 17. Hot fuel assemblies mass flow rate in LOFAs.
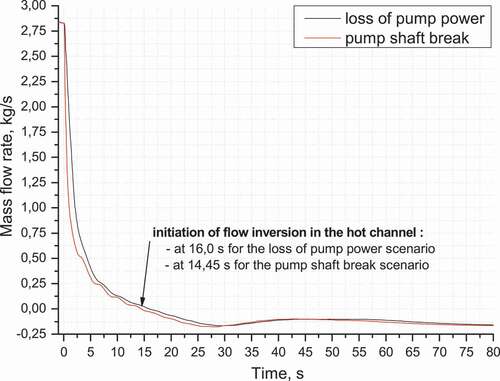
Figure 18. (a). Fuel assemblies’ mass flow rates in LOFAs (pump shaft break case): wide range. (b). Fuel assemblies’ mass flow rates in LOFAs (pump shaft break case): narrow range.
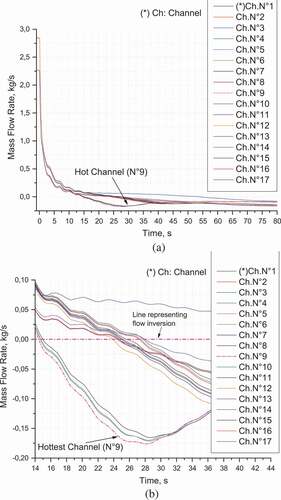
Figure 19. Critical heat flux ratios in LOFAs.
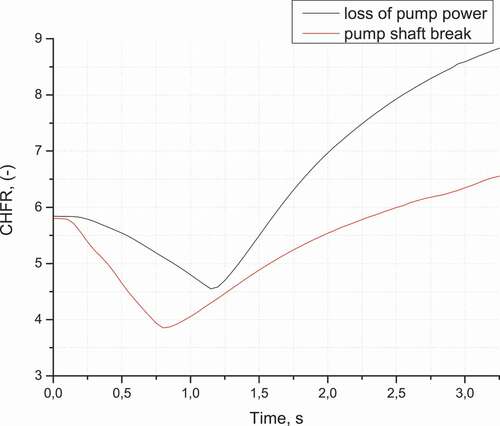
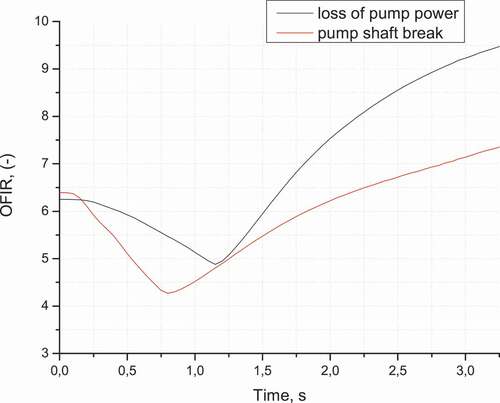
Figure 20. Onset of flow instability ratios in LOFAs.
In and 14(b), the reactor power responses are compared during the transient from time 0 to 80 s. As shown in these figures, the core power is drastically reduced to the decay heat level due to the insertion of a large negative reactivity (−11.05$). The trip setpoint for low flow (176 m3/h) is reached at approximately 0.50 s in the case of loss of pump power and at 0.20 s in the case of pump shaft failure. When the coolant flow is reduced to 43% of its nominal full flow, the flap valve is passively open at 1.90 s for natural circulation cooling in the case of loss of pump power and open at 0.6 s in the case of pump shaft failure (see ).
The reactor trip occurs earlier in the case of pump shaft failure accident than in the accident with a loss of pump power because of the more rapid decrease in core flow early in the pump shaft failure event.
shows that at the early stage of flow coastdown, the fuel temperature increases due to flow decrease while the power is maintained (before the reactor SCRAM). The first peak of fuel temperature in the hot fuel assembly during this period reaches 83.8°C at 0.8 s for the worst case (pump shaft break). However, the fuel temperatures sharply decrease as soon as the reactor is tripped.
illustrates that flow inversion from the hot channel starts at approximately 16.0 s for the loss of pump power scenario and at approximately 14.25 s for the pump shaft break scenario. Thus, the fuel temperature recovery between 7 and 25 s (see ) is due to the slowdown and initiation of flow inversion in the hot channels as well as the initiation of flow inversion in the remainder of the coolant channels (see and 18(b)) to low-flow velocity during the onset of the upward natural convective flow. Hence, the second peak of the fuel temperature in the hot fuel assembly during this period reaches 66°C at 26.5 s for the worst case (pump shaft break) and decreases again when the natural circulation flow becomes stabilized through the coolant channels of the reactor core (see )).
The coolant temperature is still below the saturation temperature (113°C), and no void is predicted in the flow channel. However, the minimum CHFR during the entire transient is calculated as 3.8 (CHFR >> 1.5) (Kaminaga et al., 1998) in the case of a pump shaft break at 0.8 s, as shown in . In , the OFIR starts decreasing slowly from time zero and reaches a minimum value of 4.2 at 0.80 s. After 0.8 s, the CHFR and OFIR increase rapidly. Consequently, the CHFR and OFIR criteria are satisfied within a sufficient margin [Citation23]. Hence, fuel element damage is unlikely to occur. After the reactor trip, the core power decreases drastically, and the minimum CHFR increases. From a thermalhydraulic point of view, a certain margin exists in the bulk nucleate boiling, and an excessive fuel temperature is not expected.
4. Discussion and conclusions
The current study aimed to perform a safety reassessment and a comparison of the LOFAs that are more likely to occur in low-power RRs than in the NUR.
Comparison of the measured primary flow coastdown test data and the calculation results show notably good overall agreement. The predicted results for reactor power history, inlet/outlet core and heat exchanger coolant temperatures, reactor core pressure drop, pump and heat exchanger inlet and outlet pressures are in good agreement with the measured data under the steady-state FC experiment for long-term continuous operation.
Analysis of the protected transients without power feedback represented by the LOFAs due to loss of pump power and a sudden pump shaft break revealed that in both cases, the lower limits of the minimum CHFR and minimum OFIR for NUR are satisfied within a sufficient margin (minimum CHFR > >1.5), and none of these scenarios led to fuel damage. In addition, the RELAP5 multi-channel core model considered in this work reveals that there is a close relationship between the behaviors of the hot channel parameters and the remainder of the core coolant channels.
Furthermore, from a safety perspective (with regard for the reactor), the pump shaft break transient scenario is the most conservative case with respect to the minimum CHFR and fuel temperature responses.
The current work could also be of great use in the context of periodic safety reviews and upgrades to the existing facility.
Acknowledgments
The authors thank the NUR reactor staff for their assistance in preparing the experiments and the heads of the NUR Reactor Division, the LTPMP laboratory (USTHB Algiers University), and the Nuclear Research Center of Algiers for their involvement. The authors also thank J. Michael Doster, Professor of Nuclear Engineering (North Carolina State University, USA), for the helpful comments to prepare this manuscript. This work was supported by the Office of the Atomic Energy of Algeria (COMENA).
Disclosure statement
No potential conflict of interest was reported by the authors.
References
- INVAP-S.E. Réacteur nucléaire pour formation – rapport d’Analyse de Sûreté (Safety Analysis Report). Alger (Algérie): Haut Commissariat à la Recherche; 1989.
- W M T, P E U, D A A, et al. An MTR fuel element flow distribution measurement preliminary results. Proc. of the 2003 Int. Meeting on Reduced Enrichment for Research and Test Reactors; 2003 Oct 5-10; Chicago, Illinois.
- Housiadas C. Lumped parameters analysis of coupled kinetics and thermal-hydraulics for small reactors. Ann Nucl Energy. 2002 July;29:1315–1325.
- Todreas NE, Kazimi MS. Nuclear systems II - elements of thermal hydraulic design. New York (NY): Taylor and Francis; 2001; p. 93–109.
- Farhadi K. Analysis of flow coastdown for an MTR-pool type research reactor. Prog Nucl Energy. 2010 Aug;52:573–579.
- Hammoud A, Meftah B, Azzoune M, et al. Thermal-hydraulic behavior of the NUR nuclear research reactor during a fast loss of flow transient. J Nucl Sci Technol. 2014 Apr;51:1154–1160.
- Hirano M, Sudo Y. Analytical study on thermal-hydraulic behavior of transient from forced circulation to natural circulation in JRR-3. J Nucl Sci Technol. 1986;23:352–368.
- Idaho National Engineering Laboratory. RELAP5/MOD3 code manual, code structure, system models, and solution methods, Vol. I. Idaho Falls: INEL; 1999. (NUREG/CR-5535).
- Hu LW, John AB, Otto KH, et al. Current activities at the MIT Research Reactor. Proc. of the 6th meeting of the International Group On Research Reactors; 1998; Apr 29-May 1; Taejon, Republic of Korea.
- Azzoune M, Mammou L, M H B, et al. NUR research reactor safety analysis study for long time natural convection (NC) operation mode. Nucl Eng Des. 2010 Apr;240:823–831.
- Adorni M, Bousbia Salah A, Hamidouche T, et al. Analysis of partial and total flow blockage of a single fuel assembly of an MTR research reactor core. Ann Nucl Energy. 2005 Oct; 32:1679–1692.
- Huda MQ, Bhuiyan SI. Investigation of thermohydraulic parameters during natural convection cooling of TRIGA reactor. Ann Nucl Energy. 2006 Sep;33:1079–1086.
- Hamidouche T, Bousbia Salah A, Si-Ahmed E, et al. Overview of accident analysis in nuclear research reactors. Prog Nucl Energy. 2008 Jan;50:7–14.
- Kazeminejad H. Thermal-hydraulic modeling of flow inversion in a research reactor. Ann Nucl Energy. 2008 Oct;35:1813–1819.
- Sudo Y, Kaminaga M. A new CHF correlation scheme proposed for vertical rectangular channels heated from both sides in nuclear research reactors. J Heat Transfer. 1993 May;115:426–434.
- Kaminaga M, Yamamoto K, Sudo Y. Improvement of critical heat flux correlation for research reactors using plate-type fuel. J Nucl Sci Technol. 1998 Jan;35:943–951.
- R H W, Forgan RA. Correlation for the minima in the pressure drop versus flow-rate curves for sub-cooled water flowing in narrow heated channels. Nucl Eng Des. 1967 Aug;6:89–99.
- Leos R, Wu Z, Williams RE, et al. Integrating sudo-kaminaga correlation to the safety analysis code PARET-ANL. Vol. 116. San Francisco (CA): Transactions of the American Nuclear Society; 2017 Jun 11–15.
- Crane Co. Flow of fluids through valves, fittings and pipe. 21st printing. (Technical Paper No. 410 M). New York (NY): Crane Co.; 1982.
- Meftah B, Zidi T, Bousbia Salah A. Neutron flux optimization in irradiation channels at NUR research reactor. Ann Nucl Energy. 2006 October;33:1164–1175.
- LANL, MCNP — A general monte carlo N-particle transport code. Version 5 Volume I: Overview and Theory (LA-UR-03-8102). Los Alamos (NM): Los Alamos National Laboratory; 2003.
- Woodruff WL, Hanan NA, Matos JEA Comparison of the RELAP5/MOD3 and PARET/ANL Codes with the Experimental Transient Data from the SPERT-IV D-12/25 Series. Proc. of the 1997 Int. Meeting on Reduced Enrichment for Research and Test Reactors; 1997 Oct 5-10; Jackson Hole, WY.
- U.S. Nuclear Regulatory Commission. Guidelines for preparing and reviewing applications for the licensing of non-power reactors - standard review plan and acceptance criteria. Washington (DC): U.S. NRC; 1996. NUREG-1537-PART2.