
 ?Mathematical formulae have been encoded as MathML and are displayed in this HTML version using MathJax in order to improve their display. Uncheck the box to turn MathJax off. This feature requires Javascript. Click on a formula to zoom.
ABSTRACT
Water columns were adopted in the pressure measurement system of Fukushima-Daiichi Unit 3 to compensate for evaporation/condensation during normal operation. Some of these water columns evaporated partially during the accident condition jeopardizing correct understanding on actual pressure. Through inter-comparison of reactor pressure vessel (RPV) and suppression chamber (S/C) pressures with drywell (D/W) pressure, such water-column-change effect was evaluated. From this evaluation, correction for the specific effect was developed for RPV and S/C pressure data. With this corrected pressure, slight pressure difference among RPV, S/C, and D/W during the accident transient was evaluated. This information of pressure difference was then integrated with other available data, such as water level, containment atmosphere monitoring system, and environmental dose rate in the Fukushima-Daiichi site, into an interpretation of accident progression behavior focusing on RPV and primary containment vessel pressurization/depressurization and radioactive material release to environment. It is suggested that dryout of in-vessel and ex-vessel debris was likely causing pressure decrease on one hand, and S/C water poured into pedestal heated by relocated debris was a likely cause of pressurization on the other hand. Cyclic reflooding of pedestal debris and its dryout was likely leading to the cyclic pressure change lasting several times until the final debris reflooding.
1. Introduction
The pressure measurement data for Unit 3 [Citation1] showed frequent changes of primary containment vessel (PCV) pressure for about 2 weeks suggesting some specific scenario unique to this unit. In existing severe accident code analyses for Unit 3 [Citation2–Citation4], early part of the accident progression phase was mainly addressed providing valuable information useful for understanding of the plant condition leading to core damage. However, for the later part of the transient, especially after 45 h from the station black-out initiation, i.e. ca. 12:00 of March 13, code calculations gave large uncertainty [Citation4]. Furthermore, measured pressure data are not reliable since they have contradictory characteristics among themselves. For example, indicated reactor pressure vessel (RPV) pressure is smaller than that of drywell (D/W) pressure continuously. This difficulty is mainly caused by transient change of water columns adopted in the measurement system. In this study, this effect was deduced based on inter-comparison of measured data, and then, necessary corrections were developed. Based on corrected pressure together with other pieces of available information, an interpretation of accident-progression behavior in the later phase of the accident was conducted covering the 2-week-long PCV-pressure-change cycles. Although such an interpretation includes many assumptions and subjective judgments, it is believed that this interpretation effectively compensates for the lack of information in the later phase of Unit 3 accident-progression behavior. A scenario proposed in this study can be regarded as a working basis for approaching the real scenario, which would contribute not only to better learning from the accident but also to provide best information for decommissioning of the damaged plant.
2. Design concept of pressure and water-level measurement systems
Pressure and water-level measurement systems of Fukushima Daiichi Nuclear Power Plant units consist of the concept illustrated in and they include water columns which should compensate for effect of evaporation and condensation under normal operational conditions. However, during the accident transient, part of these water columns was heated significantly and at rapid depressurization events, such as wet-well venting, flashing-type evaporation was likely taking place in some of these water columns. Reduction of such water column height results in shift of indicated pressure for RPV and suppression chamber (S/C), and water level for RPV. In order to grasp accident progression behavior, subtle difference of pressure among RPV, S/C, and D/W is quite important and effective. However, such pressure difference is masked when the height of the water column changes. In this study, this water column change is estimated based on characteristics of observed data, and corrections that will enable identification of the subtle pressure difference are developed. Since water column is absent in the D/W pressure measurement system, D/W pressure data are free from such water column decrease/recovery effects. Thus, measured D/W pressure is adopted as a reference in this study for comparison with RPV and S/C pressures. It should be noted that this unit had S/C pressure measurement systems with and without water column. The one with water column was categorized as the system for accident management and was used solely during the accident period under the limitation of available DC power supply.
Figure 1. Concept of pressure and RPV water-level measurement systems.
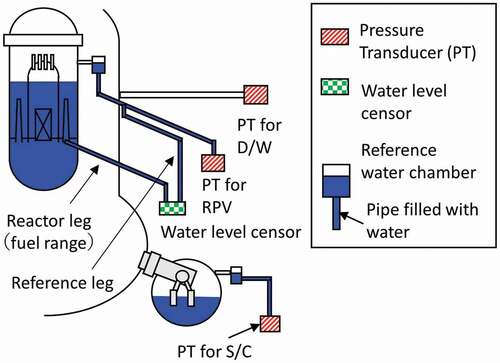
In the following, characteristics of pressure measurement data are discussed and corrections are introduced for S/C and RPV pressure measurement systems respectively.
3. Overview on plant data until automatic depressurization system (ADS) operation
shows pressure and reactor water-level measurement data [Citation1] focusing on early stage of core degradation until ADS operation. In this unit, DC power supply was available for some time and reactor core isolation cooling (RCIC) system was operating with controlled mode from ca. 16:03 of March 11 until its automatic trip at ca. 11:36 of March 12. About 1 h after this trip, high pressure core injection system operation started automatically and it continued operation for more than 14 h until the manual trip at ca. 2:42 of March 13. Although this trip was conducted as a part of procedure to inject water into RPV, RPV depressurization was not successful. As a result, RPV pressure increased continuously and by ca. 4:30 of March 13, RPV pressure reached ca. 7.5 MPa leading to intermittent opening of safety relief valves (SRVs). Based on the reactor-water-level measurement data, voiding of the core upper part is estimated to have started at ca. 2:00 to 3:00 of March 13. The RPV pressure increase toward ca. 7.5 MPa was taking place with partial core voiding and the water level was continuously decreasing. From ca. 7:00 of March 13 on, coherent changes can be observed in various parameters. RPV pressure started to decrease slightly suggesting reduction of gas-mixture (vapor and non-condensable gases) flowing out of RPV. PCV-pressure increase tended to saturate in this time period which can be explained with decrease in energy supply from RPV. The decrease of reactor water level tended to saturate in the same time period showing reduction of vapor formation in the core region. All these changes are consistently suggesting that cooling of core materials was significantly reduced. At the end of this period, an RPV-pressure-increase event took place which seems to have finally resulted in ADS operation as suggested in the TEPCO report [Citation5]. Average temperature increase rate of core materials with decay power with adiabatic assumption is about 0.2 K/s for this unit at this stage. The reactor-water-level measurement data show that core voiding in the upper core part lasted for about 6 h until the ADS operation. As a ballpark assumption for potential core temperature increase with 0.2 K/s for 6 h, one can get a number >4000 K. Although actual core temperature increase is limited by heat transfer to coolant and surrounding structure, the sign of reduced energy transfer from core in the later part of the high RPV-pressure period suggests strongly that fuel melting was taking place before the ADS operation. After the ADS operation, RPV pressure decreased rapidly and PCV pressure increased quickly as well. This rapid pressure change within several minutes was followed by 1-h long continuous decrease of RPV and PCV pressure. Although the measured water level data increased after the ADS operation, this was due to reduction of reference leg water column shown in and not actual water level increase.
Figure 2. Pressure and reactor water level data [Citation1] until ADS operation.
![Figure 2. Pressure and reactor water level data [Citation1] until ADS operation.](/cms/asset/bdf86530-aa36-4f0f-adb6-4dde79224d0b/tnst_a_1588798_f0002_oc.jpg)
4. Plant data after ADS operation and correction for RPV and S/C pressure data
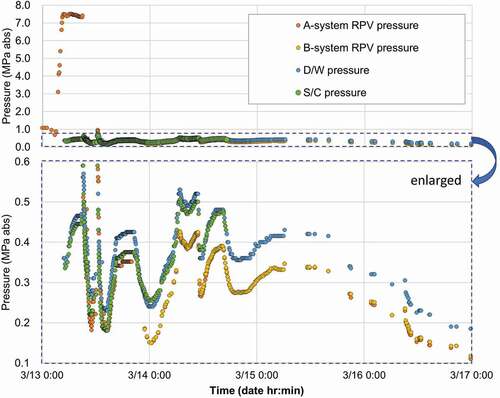
shows measured (or indicated) RPV, S/C, and D/W pressure data [Citation5]. RPV and S/C pressure here is corresponding to the gas-region pressure. As RPV pressure, A and B systems are available. As for the S/C pressure data, measured value at 17:20 of March 14 is 0.02 MPa, which is far from expected level of real S/C pressure at this time. After this time on, S/C pressure data are not available. Therefore, in this paper, S/C pressure data until 17:10 of March 14 are referred to. Both A and B systems of RPV pressure measurement means are showing quite consistent values within this time range. It is noted that the tendency of transient pressure change has common characteristics among RPV, S/C, and D/W pressure data. However, they are changing quite differently from time to time thus no straightforward relationship can be figured out from the original data. It is intended in the following sections to look into difference of S/C or RPV pressure against D/W pressure so that possible water column change can be estimated.
Figure 3. Measured pressure data during the March 13–16 period.
4.1. Possible water column reduction in S/C pressure measurement system
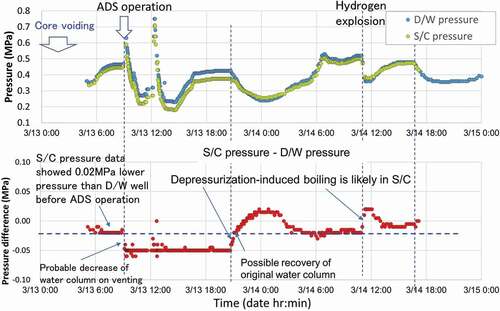
shows measured S/C and D/W pressure history and their difference. It is clarified that the pressure difference changes significantly just after the ADS operation and the subsequent wet-well venting. This fact strongly suggests that the water column in the S/C pressure measurement system decreased. It is likely that venting-induced dynamic gas flow resulted in low pressure condition in the S/C pressure measurement system thereby allowing depressurization-induced evaporation of the water column in the S/C pressure measurement system. Before this change on venting, it indicates that S/C pressure was constantly lower than D/W pressure by about 0.02 MPa. Since this pressure difference is physically unrealistic, the difference is believed to have been due to difference in calibration. D/W pressure data were ca. 0.1 MPa after the 2-week-long PCV-pressure-change phase suggesting D/W pressure is more reliable than S/C pressure data. This fact will support the treatment in this study to adopt D/W pressure as the reference. After the venting, the difference stays mostly at −0.05 MPa except for some pressure events, until ca. 20:40 of March 13. From this time on, the difference increases rapidly beyond the initial value of −0.02 MPa, and after the peak value of +0.02 MPa at ca. 0:00 of March 14, it gradually approaches −0.02 MPa and stays at this level until ca. 11:00 of March 14.
Figure 4. Pressure difference between S/C and D/W pressure data.
In order to analyze characteristics of the pressure difference, the relationship between measured S/C and D/W pressure data is plotted in . For clarification of its dependency on different time periods, data points are shown in different colors representing different time windows. Line 1 in this figure is given with EquationEquation (1)(1)
(1) .
Figure 5. Relationship between S/C and D/W pressure measurement data.
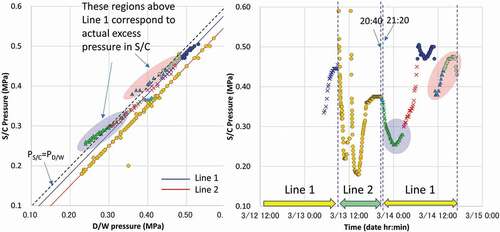
where PS/C is measured S/C pressure (MPa abs)and PD/W is measured D/W pressure (MPa abs). Before the venting, the data points are aligned on Line 1 suggesting that the actual S/C and D/W pressures were equivalent. After venting, the data points are aligned on Line 2 which is given with EquationEquation (2)(2)
(2) .
Again, since physical pressure difference of this value between S/C and D/W was quite unlikely, water column in the S/C pressure measurement system is likely to have been reduced by 0.03 MPa of water head. It is noted that the data points between ca. 20:40 and ca. 21:20 of March 13 are on a transition from Line 1 to Line 2 suggesting that the water column was recovering during this time window. During this transition, both D/W and S/C pressures decrease but the apparent decrease of S/C pressure is mitigated by the probable water column recovery. From ca. 21:20 of March 13, both S/C and D/W pressures decrease on Line 1 suggesting S/C and D/W were in pressure equilibrium. However, the data points leave Line 1 from ca. 22:40 of March 13 and the deviation becomes highest at ca. 0:00 of March 14 when D/W pressure was at its local minimum. It is understood that this deviation corresponds to physical pressure difference with submerge of vacuum break valve in S/C by increased S/C water level as discussed in Section 5.3. After this local minimum in pressure, along with D/W pressure increase, data points approach Line 1 as if it traces back the history during the pressure decrease process. The increasing pressure leads to the ‘second PCV pressure plateau,’ from ca. 7:00 to ca. 11:00 of March 14 (the ‘first PCV pressure plateau’ is explained in Section 5.2), which is terminated by the abrupt pressure decrease from ca. 11:00 of March 14. During this pressure decrease, the data points are aligned on Line 1 but they tend to deviate again from Line 1 when D/W pressure decrease becomes large. This complicated history of S/C and D/W pressures, which is believed to be a key for interpretation of the accident-progression behavior, will be discussed later.
Based on the above analysis, following correction for S/C pressure data is introduced so that direct comparison with D/W pressure can be enabled.
For the time period before ADS operation and venting
where PS/C corrected is corrected S/C pressure (MPa abs).
For the time period from venting until 20:40 of March 13
For the time period from 21:40 of March 13 to 17:10 of March 14
4.2. Possible water column reduction in S/C pressure measurement system
Difference of A and B system RPV pressure data from that of D/W pressure data is shown in . Different marker colors are used for different time windows for better understanding of their characteristics. Since RPV pressure can be physically different from D/W pressure depending on significance of gas formation within RPV and its outflow from RPV, estimation of water column change is not straightforward. Actually, the relationship between RPV and D/W pressure data shown in provides significant deviation showing that the RPV pressure was kept higher than D/W pressure for certain part of the transient especially after the RPV pressure event at ca. 12:10 of March 13. shows that the pressure difference between RPV and D/W becomes lowest during the second PCV pressure plateau. As discussed later, during this PCV pressure plateau, certain part of the core fuel is believed to have relocated to the pedestal and vapor formation is regarded as the main source of PCV pressurization. It is reasonable that the RPV pressure and D/W pressure become similar when the main pressure source is located out of RPV. Considering this situation, it is assumed that the RPV and D/W were in pressure equilibrium during this pressure plateau. In the time periods before and after the second PCV pressure plateau, data points are aligned on Line 3 which is given with EquationEquation (6)(6)
(6) .
Figure 6. Difference between RPV and D/W pressure data.
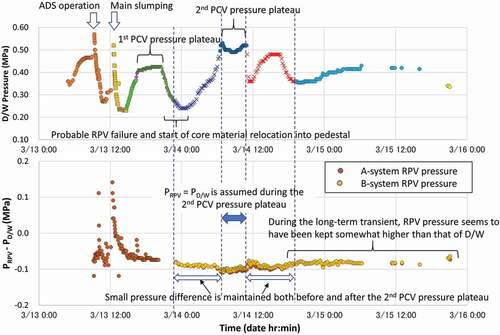
Figure 7. Relationship between RPV and D/W pressure data.
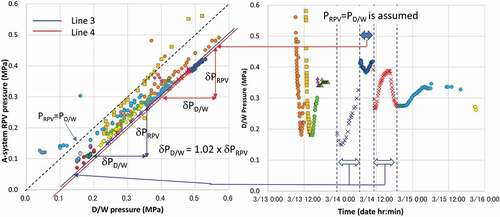
The factor 1.02 in this equation is corresponding to a slight difference in response characteristics of pressure transducers for RPV and D/W. In order to compare these pressure data, the factor of difference in pressure-transducer-response characteristics should be taken into account in addition to the possible effect of water column decrease. Assuming that this factor is same for the second PCV pressure plateau, the relationship for the plateau, i.e. Line 4, is given with EquationEquation (7)(7)
(7) .
Since it is assumed that RPV is in pressure equilibrium with D/W during the second PCV pressure plateau, corrected RPV pressure (PRPV corrected) can be presented with EquationEquation (8)(8)
(8) .
5. Interpretation with corrected pressure data
RPV and S/C pressure data are corrected with EquationEquations (3(3)
(3) )Equation–(5)
(5)
(5) and (Equation8
(8)
(8) ), respectively. These corrected data are shown in together with D/W pressure. The corrected S/C pressure, which is reliable only until 17:10 of March 14, is always near the D/W pressure. In contrast to this, RPV pressure is sometimes significantly higher than D/W and S/C pressures showing that gas flow from RPV to PCV was continuing. In the following sections, the time is split into Phases ‘A’ to ‘E’ as presented in and interpretation for accident-progression behavior is presented for each phase based on corrected pressure and other available data where appropriate. Short discriptions for these phases are listed in . Water injection history reported in the TEPCO report [Citation5] is provided in this figure. Although flow rate effectively injected into the RPV is not clear, some of injected water would have been entering the RPV intermittently.
Figure 8. History of corrected RPV and S/C pressure plotted together with D/W pressure.
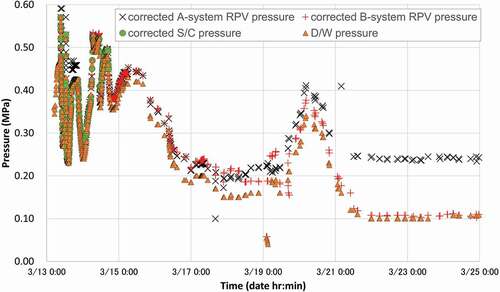
Figure 9. Selection of phases for interpretation.
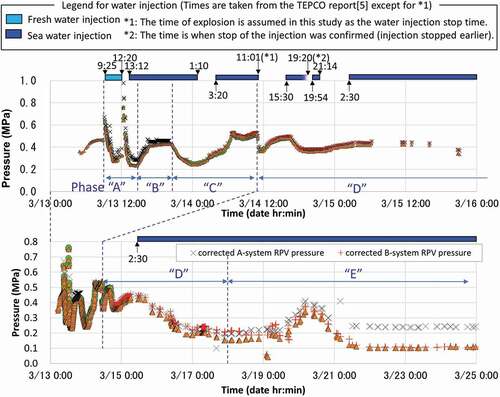
Table 1. Description of Phases “A” to “E” characterizing Unit 3 accident progression behavior after the ADS operation
5.1. Phase ‘A’: RPV depressurization and probable core material relocation to lower plenum (slumping)
In , history of corrected pressure and S/C-to-D/W differential pressure is shown for Phase ‘A.’ In order to clarify deviation of differential pressure from the base line, data points are connected with lines. Phase ‘A’ starts at the ADS operation at ca. 9:08 of March 13 leading to a rapid RPV depressurization. Since hydrogen seems to have been released at the beginning of depressurization under significant enhancement of vapor formation within RPV, the time scale of RPV depressurization seems to have been dominated by simple boiling of lower-plenum water without significant contact between hot fuel and water. This rapid pressure-decrease characteristic is quite different from that after an RPV pressurization event discussed later. During this rapid RPV pressure decrease, PCV pressure increased rapidly from 0.46 to 0.64 MPa probably with hydrogen release and continued vapor flow from lower plenum. From ca. 9:15, PCV pressure decrease can be observed showing start of wet-well venting.
Figure 10. History of pressure after correction in Phase ‘A’ and S/C-to-D/W differential pressure.
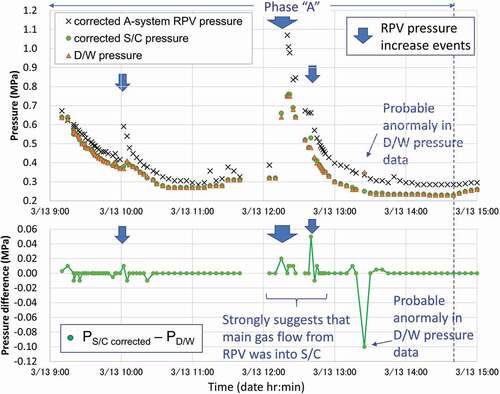
RPV pressure increase events can be seen at ca. 10:00, 12:10, and 12:40 of March 13. The S/C-to-D/W differential pressure is basically zero but it tends to become positive when the RPV pressure increase events are taking place. Although high D/W pressure was recorded at ca. 13:25, the data before and after this moment suggest some anomaly resulting in this erroneous value. Apart from this probable anomaly, this result strongly suggests that gas flow from RPV was mainly into S/C, and RPV-to-D/W direct flow was limited. This aspect is quite important for understanding of RPV-pressure-increase events, since vapor condensation is much more effective when the vapor flow is through S/C as opposed to direct release into D/W. The RPV pressure increase event at ca. 12:10 was rather significant and as can be seen in , strip chart data [Citation5] showed an RPV pressure peak of ca. 2.7 MPa. It should be noted that the PCV pressure increased rapidly from ca. 0.31 to 0.76 MPa within 10 min. Most likely explanation for this event is fuel debris slumping into lower plenum. This rapid and significant PCV pressure increase is difficult to explain without significant production of non-condensable gases. A simplified assumption for D/W pressure increase can clarify this point. As shown in Section 5.2, RPV-to-PCV pressure difference continues to stay relatively high (0.04–0.05 MPa) for several hours after this pressure event suggesting that main path of gas flow from RPV to D/W was through S/C during the event.
Figure 11. RPV pressure data recorded on the strip chart [Citation5].
![Figure 11. RPV pressure data recorded on the strip chart [Citation5].](/cms/asset/d35c05cb-b05f-435c-a759-8aa1c7407b13/tnst_a_1588798_f0011_oc.jpg)
A simplified assumption
First, the D/W pressure of 0.31 MPa before the event is assumed to be corresponding solely to non-condensable gases. This assumption minimizes necessary vapor pressure after the pressure increase. Temperature of the D/W gases is assumed to be saturation temperature of water vapor at this pressure (408K) since the gases are coming mainly through S/C before the event. Actual gas temperature would have been lower than this value with heat loss to the PCV and its internal structures.
Second, the D/W-pressure increase during the event, up to 0.76 MPa (+0.45 MPa), is assumed to be corresponding to vapor pressure and heat up of non-condensable D/W gases. Vapor pressure of 0.44 MPa at 420 K and partial pressure increase of 0.01 MPa of non-condensable gases (from 408 to 420 K) fulfill this assumption. Since effective mixing is taking place in S/C water, most of S/C water should be heated up to 420 K. As is discussed in Section 5.3, after the pressure event, the water level in S/C is considered to have been just near the vacuum break valve (OP +3305 mm [Citation6], where OP is Onahama Peil) which is 5.85 m above the torus bottom (OP −2550 mm [Citation6]). Applying torus diameter (center) of 33.5 m [Citation6] and water density of 920 kg/m3 (at 420 K), one gets an estimated S/C water mass of ca. 3150 t. This assumption necessitates ca. 168 GJ of heat transfer at least for S/C water heat up. Actual necessary energy would be higher than this value because of several reasons. For example, vapor pressure in D/W before the event would have been some meaningful value in reality thus partial pressure of non-condensable gases (existed before the event) would have been lower. Furthermore, the high D/W pressure (0.76 MPa) after the event would have been allowing significant leak of non-condensable gases from the PCV. On the other hand, 168 GJ of energy release is hardly explained with existing model simulations for this event [Citation7], where evaluated energy release is in a range up to ca. 100 GJ.
The above simplified assumption suggests that significant amount of hydrogen was generated within RPV during this event in addition to vapor. The observed PCV pressure in Unit 3 was highest at this time and this high PCV pressure level is similar to those observed in Unit 1 and Unit 2 where high PCV pressure lasted for several hours. It is possible that PCV boundary of Unit 3 suffered significant damage during this RPV pressure event and integrity of the PCV boundary was degraded. Similar RPV pressurization events, though less pronounced, can be seen several times. The slight RPV pressure increase that preceded the ADS operation may also have been an early small-scale slumping. These RPV pressure events are taking place intermittently in a long time range suggesting incoherent nature of such events.
Phase ‘A’ ends up with probable vent-valve closure at ca. 14:40 of March 13. From this time on, RPV and PCV pressures start to increase.
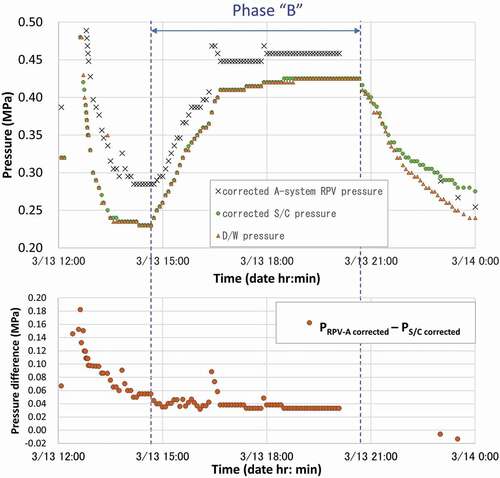
5.2. Phase ‘B’: gradual PCV pressurization leading to the first PCV pressure plateau
shows corrected RPV and S/C pressures together with D/W pressure for Phase ‘B.’ The difference between corrected RPV and S/C pressures is also plotted. Phase ‘B’ starts with probable closure of vent valve at about 14:40 of March 13. Although official records do not confirm vent-valve closure at this time, the trend of pressure data strongly suggests it. When PCV pressure reaches about 0.41 MPa, PCV pressure tends to stay at this pressure level suggesting strong increase of leak. As a result, the first PCV pressure plateau (from ca. 16:30 to ca. 20:40 of March 13) is created. At ca. 12:40 (within Phase ‘A’), corrected RPV pressure is higher than corrected S/C pressure by about 0.18 MPa showing significant gas flow from RPV to S/C. As can be illustrated in , gas flowing from RPV goes down to the bottom of steam line through SRV. The pressure difference between RPV and S/C is considered to consist mainly of pressure loss at SRV and water head within S/C. As described in Section 5.3, water level in S/C at this time seems to have been near the vacuum break valve, which is ca. 4 m above the steam line exit. Therefore, the water head would have been yielding ca. 0.04 MPa of pressure difference. Actually, the RPV-to-S/C pressure difference decreases gradually and it stays at about 0.04 MPa at the beginning of Phase ‘B.’ This constant pressure difference suggests that the pressure loss along the vapor flow path, mainly SRV, is very small or negligible in Phase ‘B.’ Although leak gas flow from RPV directly to D/W is probable, such leak flow is not large enough to prevent the continued gas flow into S/C voiding the steam flow pipe down to the exit.
Figure 12. Corrected pressures compared with D/W pressure for Phase ‘B.’
Some additional RPV pressure increase events can also be seen in Phase ‘B’ at ca. 16:30 and 17:55 suggesting long-lasting fuel relocation within RPV.
5.3. Phase ‘C’: gradual PCV depressurization followed by its re-build up leading to the second PCV pressure plateau
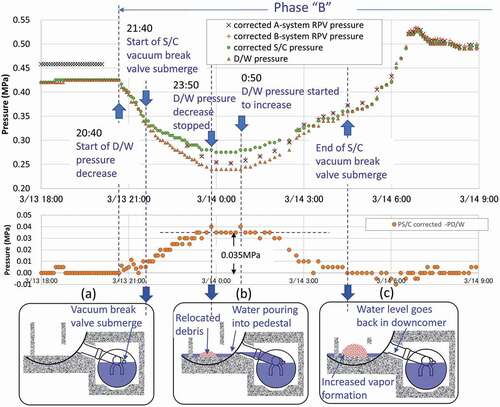
shows pressure history for Phase ‘C.’ At ca. 20:40 of March 13, D/W pressure started to decrease. S/C pressure followed this D/W pressure decrease with slight excess pressure against D/W. This situation can be explained with significant reduction of vapor supply from RPV. A possible explanation for such vapor-supply reduction is significant reduction of liquid water in the lower plenum (called ‘dryout’ hereafter) with evaporation by heat from relocated fuel debris in the lower plenum. According to the TEPCO report [Citation5], water injection continued during this period. However, such water injection would not have been sufficient to keep the precedent level of vapor formation. Although RPV pressure measurement after ca. 20:05 is missing for some time, RPV pressure may have started to decrease before ca. 20:40. Since vapor flowing out from damaged PCV boundary (PCV top flange, for example) was likely, decrease of vapor supply would have resulted in D/W pressure decrease. Once D/W pressure decrease started, saturated water in the upper part of S/C water would have been boiling slowing down D/W pressure decrease. It is likely that water column in the S/C pressure measurement system (see ) recovered under such depressurization-induced S/C water boiling.
From ca. 21:40 of March 13, difference between corrected S/C pressure and D/W pressure starts to increase suggesting submerge of S/C vacuum break valve (see ). Since increase of S/C water level necessitates significant amount of water, the probable vacuum break valve submerge at this time indicates that the S/C water level was already near the vacuum break valve before this moment. Once the valve is submerged, liquid S/C water fills the valve and vapor can no longer flow through the valve. Thus, from this time on, S/C pressure was dominated by heat balance within S/C and torus room. D/W pressure, on the other hand, decreased further under continued gas leak through PCV boundary. The pressure difference between D/W and S/C can result in pumping up of S/C water into S/C down-comer as far as water level in S/C is above the vacuum break valve. When the pressure difference reached about 0.035 MPa (at ca. 23:50), the decrease of D/W pressure stopped. As can be illustrated in , this pressure difference corresponds roughly to a water head between the level of S/C vacuum break valve and the edge of S/C down-comer connected to D/W wall. Therefore, it is estimated that part of S/C water was pumped up into D/W and pedestal with the pressure difference and D/W pressure decrease stopped when the S/C water reached debris in the pedestal (see ). Actually, D/W pressure started to increase from ca. 0:50 of March 14. From this time on, D/W pressure increased continuously until ca. 7:00 of March 14 suggesting continued relocation of hot debris into pedestal. This interpretation, which can explain the overall observed behavior quite well, necessitates some water supply to S/C to keep the water level above the vacuum break valve. Although water injection was intermittently continued, the necessary water amount for this supply to S/C is significant thus water injection alone cannot explain this. The author is not successful in identification of this water supply until now thus this aspect needs continued study. It should be noted that S/C was basically in pressure equilibrium with D/W during the PCV pressure increase showing that the water level in S/C down-comer was down to the S/C water level (see ).
Figure 13. Estimated water level in S/C during the first PCV pressure plateau.
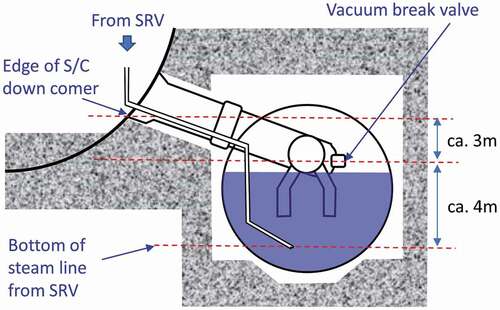
Figure 14. Corrected pressures compared with D/W pressure for Phase ‘C.’
In order to enhance understanding on this probable ex-vessel debris-relocation phase, containment atmosphere monitoring system (CAMS) data and Fukushima-Daiichi (1F)-site gamma-ray dose rate monitoring data were reviewed together with wind conditions. D/W CAMS and 1F site gamma-ray dose rate monitoring data are shown together with wind speed/direction and pressure data in .
Figure 15. CAMS, site gamma dose rate, wind speed/direction, and pressure data.
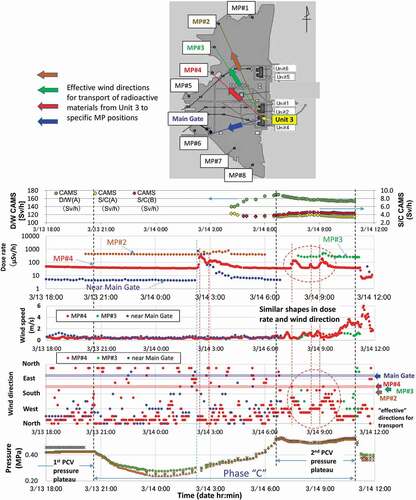
CAMS data are available only after ca. 4:10 of March 14, i.e. in the middle of slow PCV pressure increase toward the second PCV pressure plateau. Before the arrival to the plateau, D/W CAMS signal was increasing at a high level suggesting significant radioactive material release within PCV and its increase. S/C CAMS signal, showing slight initial decrease followed by slight increase, did not show significant change during this time window. This tendency of D/W CAMS can be explained with an assumption that highly contaminated S/C water was heated by hot debris in pedestal thereby producing vapor and radioactive aerosol progressively. molten core concrete interaction gases may have been partially contributing to this pressure increase. The continuous decrease of D/W CAMS signal after arrival at the second PCV pressure plateau can be explained with radioactive aerosol release through the damaged PCV boundary, such as PCV top flange, to environment. It should be noted that the PCV pressure level in this plateau is ca. 0.5 MPa and lower than the peak value of 0.75 MPa observed at the RPV pressure event at ca. 12:10 of March 13. The fact that the PCV pressure in the second plateau is slightly higher than that of the first PCV pressure plateau (ca. 0.42 MPa) can be understood with probable difference in gas flow rate through the PCV boundary.
Gamma dose rate measurement at the 1F-site provides complementary information to this understanding. During Phase ‘C,’ Units 1 and 2 are not likely to have been releasing significant amount of radioactive materials. Unit 1 was at a relatively stable condition, i.e. stable RPV and PCV pressures. Unit 2 core is believed to have been intact with continued RCIC operation. Thus, probable origin of radioactive material release observed during Phase ‘C’ is Unit 3. At an early part of the PCV pressure increase (ca. 2:10 of March 14), radioactive material release can be seen in all the three available monitoring points, i.e. ‘near Main Gate,’ ‘Monitoring Post #4 (MP#4),’ and ‘Monitoring Post #2.’ In , the wind direction ‘effective’ for radioactive-material transport from Unit 3 to each monitoring point is marked by an arrow on the right. At the time of this signal-increase event, wind speed was low (<1 m/s) and wind direction was significantly changing. Under these conditions, the release event was captured by monitoring these points with different levels of signal increase. After this event, release events cannot be clearly seen for some time. During the second PCV pressure plateau, three peaks of signal at MP#4 can be seen (from ca. 7:30 to ca. 9:30 of March 14). During this time window, wind direction at the MP#4 point was not necessarily ‘effective’ but its deviation from the ‘effective’ one looks strongly affecting the dose rate. When dose rate stays low, wind direction is almost opposite to the ‘effective’ one. Thus, as far as this period is concerned, radioactive materials are likely to have been more or less continuously released from Unit 3 and the released radioactive materials were visible at locations except for the ‘ineffective’ direction.
Based on the above consideration, possible scenario for Phase ‘C’ is summarized as follows:
At the beginning of this phase, vapor formation in RPV decreased (probably by in-vessel debris dryout, i.e. disappearance of meaningful amount of liquid water in lower plenum) resulting in D/W pressure decrease.
This D/W pressure decrease resulted in S/C vacuum break valve submerge followed by pumping up of S/C water toward D/W and pedestal.
S/C water poured into pedestal was heated by debris relocated from RPV thus D/W pressure decrease was turned over.
With gradual debris relocation to pedestal, D/W pressure increased gradually reaching the second PCV pressure plateau.
The second PCV pressure plateau driven mainly by vapor formation in pedestal lasted for about 4 h.
Release of radioactive material in this phase was basically continuous with possible enhanced release at the early part of PCV pressure increase.
5.4. Phase ‘D’: rapid PCV depressurization followed by cyclic pressure changes
5.4.1. Mechanism of cyclic PCV pressure change
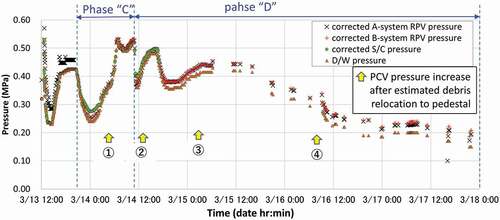
Phase ‘D’ starts with PCV pressure decrease from ca. 11:00 of March 14 as shown in . Probable debris relocation took place in Phase ‘C’ leading to the first PCV pressure increase after debris relocation. Second, third, and fourth PCV pressure increase after estimated debris relocation to pedestal can be seen in Phase ‘D.’ In the following, mechanism of PCV pressure change is discussed.
Figure 16. Pressure history for Phase ‘D.’
Considering the long-lasting PCV pressurization and the level of pressure, steam is regarded as the main contributor for the pressurization. This understanding is consistent with the observation from the outside of the Unit 3 building which showed continuous steam release after the hydrogen explosion. As possible reasons for PCV pressure decrease, in general, decrease of gas production witin PCV and increase of gas escape from PCV can be considered. The incerease of gas escape could be either increase of gas leak through PCV boundary or venting. Based on the TEPCO report [Citation5], cyclic venting during this time window is quite unlikely. Increase of PCV boundary leak is not regarded as reasonable cause since cyclic change of leak path area or resistance is not physically plausible. Thus, the most probable cause of PCV pressure decrease during these pressure cycles is reduction of gas formation. Therefore, reduction of steam formation in pedestal is considered as the most probable cause of PCV pressure decrease in Phase ‘D.’ This consideration can be supported by the S/C-to-D/W pressure difference. The observed pressure decrease rate at the beginning of Phase ‘D’ is much higher than that observed at the beginning of Phase ‘B.’ For the latter case, i.e. in-vessel debris dryout, S/C water was serving as a buffer for the pressure decrease with evaporation. The absence of such a buffer, in Phase ‘D,’ i.e. ex-vessel debris dryout, will be responsible for this difference.
In , excess pressure of S/C and RPV against D/W is plotted. It should be noted that decrease of D/W pressure stopped when the S/C excess pressure, ΔPS/C = PS/C corrected-PD/W, reached 0.03–0.04 MPa commonly after the first and the second PCV pressure plateaux. This situation can be explained with an assumption that S/C water pouring into pedestal was taking place when the S/C excess pressure reached 0.03–0.04 MPa. As discussed earlier, S/C water level seems to have been near the vacuum break valve and shows that this level of S/C-to-D/W pressure difference is sufficient to push S/C water in the S/C down-comer up to the edge of D/W wall thus can allow S/C water pouring into D/W and pedestal. Once S/C water is supplied to pedestal where debris relocated from RPV is present, significant vapor formation is expected. In the contrary, without such water supply to debris, debris cannot produce significant amount of vapor and this situation corresponds to ‘dryout’ of pedestal debris. In this way, decrease of water in pedestal leading to dryout of pedestal debris is regraded as the most probable mechanism for the PCV pressure decrease. Although water injection was continuing during this period in accordancewiacaccessed on th the TEPCO report [Citation5], the effective water injection rate does not seem to have been high enough to keep the former level of vapor formation in the pedestal.
Figure 17. Excess pressure of S/C and RPV against D/W.
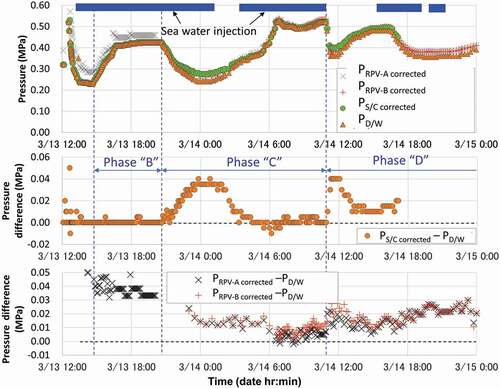
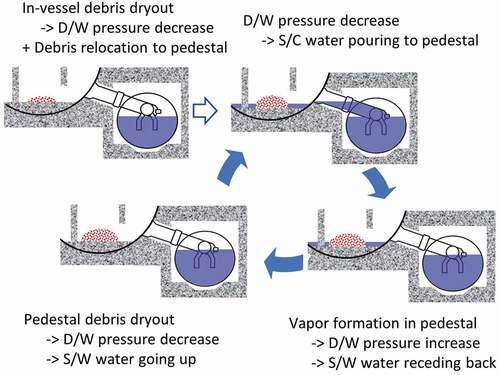
RPV excess pressure, ΔPRPV = PRPV corrected − PD/W, shown in is also giving an important hint for the RPV failure mode/condition. The RPV excess pressure is smaller than 0.04 MPa after the first PCV pressure plateau showing that injected water into RPV was slightly pressurizing RPV against D/W. This excess pressure becomes minimal during the second PCV pressure plateau when the main vapor formation would have been taking place in the pedestal. The presence of slight pressure difference (0.01–0.03 MPa) between RPV and D/W after the explosion suggests that failure sites in the RPV boundary were filled with some material to the extent that gas flow through the failure sites had some meaningful resistance yielding this pressure difference. Mechanism of the above cyclic PCV pressure change with flooding of pedestal debris by S/C water and its dryout is illustrated in .
Figure 18. Illustration of mechanism of the cyclic PCV pressure change.
5.4.2. Insight on pedestal debris energy
Long-term pressure history after 0:00 of March 14 for 4 days is depicted in . After the probable pedestal debris flooding, three PCV-pressure-increase events can be seen with pressure increase rates of 150, 70, and 15 kPa/h, respectively. This tendency could be explained with decrease of vapor generation rate with time. When the debris energy in pedestal was decreasing, vapor generation rate will also decrease. Although possible effect of leakage-area increase cannot be ruled out, these pressure increase rates are regarded as an important hint for evaluation of debris energy history and vapor formation. After ca. 6:00 of March 14, the pressure increase rate reaches the peak value of 150 kPa/h. Before this rapid pressure icrease period, the pressure increase rate is realatively low. This pressure increase history suggests that main part of debris relocation to pedestal took place from ca. 3:00–6:00 of March 14.
Figure 19. Cyclic PCV pressure change due probably to S/C water pouring into pedestal.
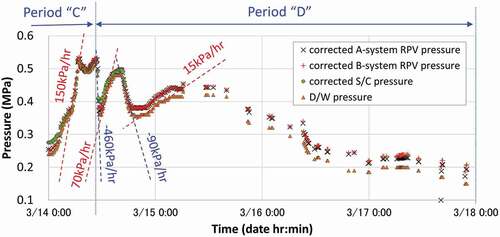
After the third pressure increase due to pedestal debris, long-term PCV pressure decrease took place for about 3 days. Sea water injection by the fire engine was continued for this time window and some part of injected water was likely reaching the pedestal producing some vapor. This water injection rate was reduced on March 17 through March 18 and this reduction may have affected the pressure history to some extent. The PCV pressure increase at ca. 9:00 of March 16 was followed by a rapid pressure decrease. Because of the large interval of pressure data sampling before 9:00 of March 16, real pressure peak is not clear.
5.4.3. Condition leading to hydrogen explosion
The pressure history around the time of hydrogen explosion is presented in . The hydrogen explosion in Unit 3 took place at ca. 11:01 of March 14. Pressure data near this time are available for ca. 10:55, 11:02, and 11:15. The last D/W pressure data before the explosion (10:55) were still at the plateau level (0.52 MPa). The D/W pressure decreased by ca. 0.05 MPa already at ca. 11:02 and this rapid decrease continued for about 15 min.
Figure 20. Enlarged pressure history around the time of hydrogen explosion.
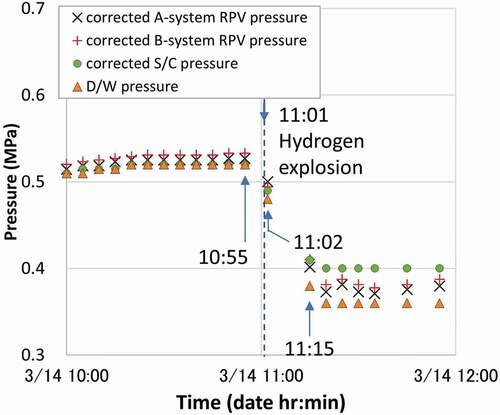
It is probable that dryout condition was reached in the pedestal debris resulting in D/W pressure decrease and cutting-off of vapor/hydrogen gas-mixture release into the reactor building. Once hot-gas-mixture flowing into the reactor building was cut off, possibility of mixing between hydrogen and oxygen would have increased either with oxygen formerly present in the reactor building or ingression from outside. In other words, reduction of gas-mixture flow into the reactor building may have allowed the explosion. This assumption has a characteristic common to the Unit 1 case, where hydrogen explosion took place after PCV pressure decrease due to venting.
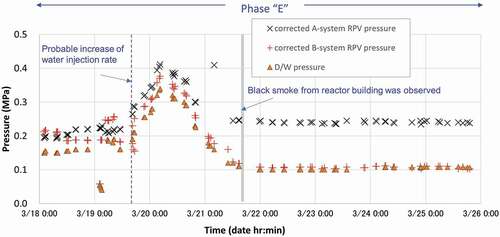
5.5. Phase ‘E’: Continuous in-/ex-vessel debris reflooding after significant increase of water injection
The pressure history in Phase ‘E’ is shown in . Based on the TEPCO report [Citation5], total water injection on March 20 was much higher than that on March 19. The measurement data suggest that this increase of water injection rate started ca. 16:30 of March 19. Just after this time, RPV and D/W pressures started to increase. It is likely that the increased water injection leads to significant vapor formation within RPV and pedestal. Such pressure increase stopped at about 4:30 of March 20, and decreased gradually with probable reduction of vapor formation along with cool down of debris both in RPV and in pedestal. At ca. 16:00 of March 21, when D/W pressure was near 0.1 MPa, black smoke coming from the reactor building was observed. After this black smoke observation, PCV pressure stayed constantly at around 0.1 MPa.
Figure 21. Pressure history for Phase ‘E.’
6. Conclusion
RPV and S/C pressure data have been corrected through their inter-comparison with measured D/W pressure. Based on the corrected pressure data, slight pressure difference among RPV, S/C, and D/W has been evaluated. This information of pressure difference was analyzed together with other available data, such as water level, CAMS, and environmental dose rate, leading to the following items of interpretation:
At the time of the probable major core-material relocation to lower plenum (at ca. 12:10 March 2013), significant amount of vapor and non-condensable gases was formed and the main part of such gas mixture flowed into S/C through SRVs.
The first PCV pressure plateau (ca. 16:30–ca. 20:40 March 13) was created mainly by vapor formation in lower plenum by relocated debris.
The D/W pressure decrease after the first PCV pressure plateau was likely due to dryout of debris in lower plenum.
The D/W pressure decrease presented above resulted in submerge of vacuum break valve resulting in pouring of S/C water into pedestal.
With heat generating debris relocated to pedestal, pouring of S/C water into pedestal resulted in cycles of vapor formation and dryout.
As a longer-term transient, debris energy decreased resulting in gradual decrease of PCV pressure.
After significant increase of water injection rate on March 19–20, cool down and reflooding of debris both in RPV and in pedestal took place.
Apart from successful venting (first and second ones), major radioactive-material release from Unit 3 was basically continuous with possible initial enhancement in the early morning of March 14, when significant debris relocation to pedestal was taking place.
Nomenclature
| PRPV | = | RPV pressure |
| PRPV-A | = | A-system RPV pressure |
| PRPV-B | = | B-system RPV pressure |
| PD/W | = | D/W pressure |
| PS/C | = | S/C pressure |
| PRPV corrected | = | corrected RPV pressure |
| PRPV-A corrected | = | corrected A-system RPV pressure |
| PRPV-B corrected | = | corrected B-system RPV pressure |
| PS/C corrected | = | corrected S/C pressure |
| ΔPS/C = PS/C corrected − PD/W | = | Excess pressure of S/C against D/W |
| ΔPRPV = PRPV corrected − PD/W | = | Excess pressure of RPV against D/W |
Acknowledgments
The author expresses great appreciation for Dr Marco Pellegrini of IAE (Institute of Applied Energy). Discussion with him significantly helped understanding on the Unit 3 pressure data.
Disclosure statement
No potential conflict of interest was reported by the author.
Additional information
Funding
References
- Download of measured data for Unit 3. [Internet] Information Portal for the Fukushima Daiichi Accident Analysis and Decommissioning Activities. [cited 2018 Apr 26] Available from: https://fdada.info/en/home2/accident2/measured2/am_download2/
- Pellegrini M, Suzuki H, Mizouchi M, et al. Early phase accident progression analysis of Fukushima Daiichi Unit 3 by the SAMPSON code. Nucl Technol. 2014;186(2):241–254.
- Cardoni J, Gauntt R, Kalinich D, et al. MELCOR simulations of the severe accident at Fukushima Daiichi Unit 3. Nucl Technol. 2014;186(2):179–197.
- Nuclear energy agency/committee on the safety of nuclear installations. Benchmark Study of the Accident at the Fukushima Daiichi Nuclear Power Plant (BSAF Project) Phase I Summary Report; 2015. ( NEA/CSNI/R(2015)18).
- Tokyo Electric Power Company, Inc. Evaluation of the situation of cores and containment vessels of Fukushima Daiichi Nuclear Power Station Units1 to 3 and examination into unsolved issues in the accident progression – Progress; 2017. ( Report No. 5).
- Plant specifications for Unit 3. [Internet] Information Portal for the Fukushima Daiichi Accident Analysis and Decommissioning Activities. [cited 2018 Apr 26] Available from: https://fdada.info/en/home2/accident2/specification2/
- Sato I, Yamashita T, Yoshikawa S, et al. Assessment of core status of TEPCO’s Fukushima Daiichi Nuclear Power Plants (109) - Difference in core energy in core material relocation in Units 2 and 3 of FDNPS and its effects -. Trans. AESJ Fall Meeting; 2018. ( Paper No. 3I03). [In Japanese].