
 ?Mathematical formulae have been encoded as MathML and are displayed in this HTML version using MathJax in order to improve their display. Uncheck the box to turn MathJax off. This feature requires Javascript. Click on a formula to zoom.
ABSTRACT
In severe accident scenarios for sodium-cooled fast reactors, it is desirable to gradually consume hydrogen generated by various ex-vessel phenomena without posting a challenge to containment integrity. An effective means is combustion of hydrogen jets containing sodium vapor and mist, but previous studies have been limited to determining ignition thresholds experimentally. The aim of this study was to visualize the ignition process in detail to investigate the ignition mechanism of hydrogen–sodium mixed jets. The ignition experiments of the hydrogen jet containing sodium mist were carried out under a condition of little turbulence. The ignition process was measured with an optical measurement system comprised of a high-speed camera and an image intensifier, and a spatial distribution of luminance was analyzed by image processing. Detail observation revealed that sodium mist particles burned as scattering sparks inside the jet and that hydrogen ignited around the mist particles. Additionally, the experimental results and a simple heat balance calculation indicated that the combustion heat of sodium mist particles could ignite the hydrogen as the heterogeneous ignition source in the fuel temperature range where the mist particle formation was promoted.
1. Introduction
The hydrogen combustion in severe accidents of sodium-cooled fast reactors (SFRs) has received much attention within the safety enhancement research and development because it could cause thermal and pressure loads which challenge the integrity of reactor containment vessels. One hypothetical severe accident is a reactor vessel melt-through in which sodium and molten core debris penetrate the vessel and fall to a steel-lined floor of the reactor cavity. If the steel liner on a structural concrete damages, sodium and molten fuel would react chemically with steam released from the heated concrete, thus generating a large amount of hydrogen [Citation1]. It is desirable that the hydrogen is gradually consumed before hydrogen deflagration occurs at the lower flammability limit to which hydrogen has accumulated in the containment vessel [Citation2].
An effective means to consume hydrogen without posing a challenge to containment integrity is non-premixed combustion where fuel and oxidizer come together in a reaction zone through diffusion at the time of burning. Combustion of hydrogen jets containing sodium vapor and mist is known as one of SFRs-specific phenomena, and this combustion has been attributed to be spontaneous ignition of sodium. It has been experimentally measured that sodium reacts with oxygen and that the flame temperature varies with sodium particle size. According to some research, maximum flame temperature was measured to be about 1773 K for sodium vapor jet [Citation3] and about 1623 K for sodium spray with a diameter of about 20 µm [Citation4]. The temperature was also reported to be above 1573 K for even a single droplet with a diameter of about 3.5 mm [Citation5]. These temperatures roughly correspond to the boiling point of the metal oxide, which is a criterion for maximum flame temperature in metal flame [Citation6]. Experiments whether sodium could become a reliable ignition source for hydrogen combustion had been performed at Hanford Engineering Development Laboratory (HEDL) in the 1970s [Citation7]. The measurement results on ignitability in the experiments using hydrogen jets containing sodium vapor and mist proposed ignition thresholds on the fuel temperature and the sodium concentration. Larger scale experiments using sodium–concrete reaction also demonstrated that the ignition thresholds were conservative regardless of the difference in the experimental setup [Citation8]. However, these previous studies focused mainly on demonstrating hydrogen combustion with sodium and determining the ignition thresholds experimentally. Little study has been done to visualize an ignition process of hydrogen jets containing sodium, and the ignition mechanism has remained unclear. Understanding the ignition mechanism is essential for estimating ignition thresholds of the jets under various conditions.
The objective of this paper was to provide experimental results on the ignition process for hydrogen jets containing sodium mist by high-speed imaging and to describe the ignition mechanism based on the experimental findings and a simple heat balance calculation.
2. Experiment
2.1. Experimental apparatus
Our experimental setup is shown in . A combustion chamber contained a fuel nozzle, which was connected to a heated hydrogen supply line and was also coupled to a sodium supply unit. This unit was comprised of a cylindrical vessel filled with liquid sodium and an upper container equipped with an electric heater for controlling gas temperature in the container. The liquid sodium was heated by an electric heater with power of 900 W to generate sodium vapor in the sodium-filled vessel. The sodium vapor was transported by an inert carrier gas to the fuel nozzle through the upper container and condensed to produce sodium mist in the carrier gas when the temperature of the carrier gas was lower than that of the sodium vapor. Sodium deposition on a sodium transport path from the sodium-filled vessel to the fuel nozzle was minimized because the path was designed to have a straight flow path with a large sufficient diameter to prevent deposition and plugging. The sodium vapor and mist were mixed with hydrogen in the fuel nozzle, and both sodium and hydrogen were released as a fuel to the combustion chamber filled with oxidizer. The fuel and the oxidizer were constantly vented to an exhaust line through an aerosol trap. The ventilation thus could keep the pressure in the combustion chamber at approximately atmospheric pressure throughout the experiment.
Figure 1. Schematic diagram of the experimental apparatus.
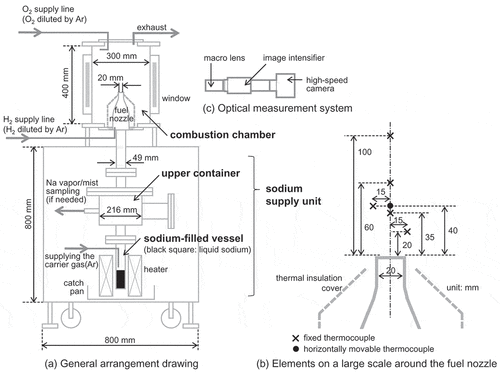
The gas temperature at each point in the combustion chamber was measured by thermocouples installed around the fuel nozzle. The fuel temperature was monitored by the thermocouple located at a position of 35 mm above the fuel nozzle outlet as shown in the enlarged view of ). When a diffusion flame was produced along the center axis of the fuel nozzle, the other thermocouples were used to measure the flame temperature and to detect the flame region. In particular, the thermocouple at 40 mm above the fuel nozzle outlet was horizontally movable, enabling a scan of the flame position and its temperature. This movable thermocouple, which was a sheath diameter of 0.5 mm for a fast response, was smoothly inserted and removed at a pitch of 50 µm. This movable operation was effective for measuring the flame temperature because a reaction zone where the combustion reactions occur was narrow and can be approximated as a thin flame sheet. The concentrations of the fuel and the oxidizer were adjusted by diluting with a mass flow controller (Model 3660; KOFLOC Corp., Kyoto, Japan) installed in each supply line. The hydrogen concentration in the fuel was analyzed by a thermal conductivity sensor (XMTC; GE Sensing & Inspection Technologies Co., Ltd., Tokyo, Japan) and was confirmed to meet the experimental condition within 0.2 vol%. The oxygen concentration in the oxidizer was monitored throughout the experiment by an electrochemical sensor (HT-1200NT; HODAKA Co., Ltd., Osaka, Japan) and was confirmed to meet the experimental condition within 0.5 vol%. The sodium concentration was controlled by the carrier gas flow rate supplied to the sodium-filled vessel. The sodium transported by the carrier gas was repeatedly sampled on sintered filters beforehand using a sampling unit connected to the upper container or an instrument temporarily installed above the fuel nozzle. The sampled sodium was dissolved into an aqueous solution, and the solution was analyzed by atomic absorption spectroscopy to convert into the sodium mass. The mass was divided by the volume of the carrier gas to be the sodium concentration. The precision of the sodium concentration was attributed to the transport process, and the dispersion of about 30% seemed to be unavoidable. However, the dispersion in sodium concentration corresponded to changing the amount of heat of the fuel jet by about 5% because of low sodium concentration in the fuel jet. This change was smaller than the fluctuation of combustion heat caused by the reaction ratio which sodium reacts with oxygen to form sodium oxide, thus would be acceptable as an experimental error.
Optical observation in the experiment was performed in a darkroom without light emission to directly detect hydrogen flame and sodium flame. These flames were measured through a quartz glass window installed on the side wall of the combustion chamber using an optical measurement system. This system shown in the enlarged view of ) was composed of a high-speed camera (FASTCAM Mini AX200; Photron Limited, Tokyo, Japan), an image intensifier unit (C10880–03F; Hamamatsu Photonics K.K., Shizuoka, Japan), and a macro lens (AI Micro-Nikkor 105 mm f/2.8S; Nikon Corporation, Tokyo, Japan). The high-speed camera is a 12-bit monochrome CMOS camera, which has 1024 × 1024 pixels image resolution at frame rates up to 6400 frames per second (fps) and has light sensitivity of ISO 40,000 using the ISO 12232 Ssat standard. The image intensifier unit is a device suitable for high-speed camera application because it intensifies an image at high gain up to 105 and prevents the deficiency in the amount of light with high-speed imaging. These optical features overcame the fundamental limitations between sensitivity and frame rate, and thus enabled high-speed and high-sensitivity observation in this experiment.
2.2. Experimental conditions and procedures
summarizes the experimental conditions. Both hydrogen and sodium were used as the fuel in this experiment. Two experiments were carried out on the basis of the order in which these fuels were supplied, and the other conditions were common under each experiment. The sequential supply of the fuel allowed us to observe various kinds of flames when each fuel burned. Experiment No. 1 for adding hydrogen later was more suitable for analyzing a temporal change of the ignition phenomena. The hydrogen gas supply was easier to control the supply start time and concentration adjustment than the sodium supply which ignites spontaneously. The ignition of hydrogen itself was observed spatially with time because hydrogen was supplied after the sodium flame was produced. In contrast, experiment No. 2 for adding sodium vapor and mist later was more effective in investigating whether hydrogen ignites under specific gas concentration conditions or not. Because the sodium flame was not yet produced at supplying hydrogen, oxygen around the fuel nozzle was not consumed at all by sodium combustion. This condition could more accurately reveal the correlation between ignition and the gas concentration. These experimental methods were different from the previous studies at HEDL where a hydrogen jet mixed with sodium in a primary vessel beforehand was injected to a space filled with oxidizer in a secondary vessel. In particularly, the method of transporting sodium vapor and mist in this study was a challenging attempt to continuously supply high sodium concentrations generated under high vapor pressure. This method enabled stable observation of the ignition process as compared with continually releasing sodium vapor and mist stored in a closed vessel under low vapor pressure.
Table 1. Experimental conditions
The oxygen concentration of 21 vol% in this study was essentially the same concentration as the condition of the HEDL experiments and was equivalent to the air atmosphere in the reactor containment building. The hydrogen concentration and the fuel temperature were based on the ignition thresholds of various studies. The hydrogen concentration of 10 vol% was the same concentration as an ignition threshold of diffusion flame used for ex-vessel analyses in SFRs [Citation9]. Even when the hydrogen was completely mixed with the oxidizer and diluted to a half concentration, the hydrogen concentration needed to be within the flammability limits (4–75 vol%) [Citation10]. Additionally, because it was significant to obtain experimental data of a low concentration hydrogen jet to complement the findings of a high concentration hydrogen jet (75 vol%) in the HEDL experiments, the hydrogen concentration of 10 vol%, which corresponds to about twice the lower flammable limit, was set in this study. The fuel temperature was set at about 533 K, which was almost the same as the ignition threshold proposed in the HEDL experiments. These data around the ignition thresholds made it easier to examine the influence of other parameters on ignition and seemed to be optimal conditions as a reference case. The sodium concentration of about 15 g m−3 was determined by an exploratory study under the experimental conditions of the concentrations and the temperature as described above. Sodium reacts with oxygen to produce sodium oxide aerosol, which caused poor visibility inside the combustion chamber. To observe the ignition process of hydrogen in detail, it was desirable that the sodium concentration was as low as possible, but hydrogen ignition should not have occurred at a low concentration. The sodium concentration was thus set from the viewpoint of observing ignition process to reveal the ignition mechanism. The sodium temperature was the same temperature as the fuel temperature because these fuel components were mixed to be an identical fuel jet. The fuel jet with low flow velocity resulted in a jet with little turbulence and enabled detailed observation of the ignition process.
The ignition study was conducted in the following procedures. The entire experimental apparatus, which was comprised of the combustion chamber and the sodium supply unit, was filled with inert gas, and then the solid sodium in the sodium-filled vessel was preheated to 1023 K. The upper container and the sodium transport path were preheated to about 573 K, and the hydrogen supply line and the fuel nozzle were heated to control the fuel temperature. The oxygen concentration in the combustion chamber was adjusted by supplying both the oxygen gas diluted by inert gas from the oxygen supply line (1.7 × 10⁻⁴ m3 s−1) and the inert gas from the fuel nozzle (1.7 × 10⁻⁴ m3 s−1). The inert gas jet from the fuel nozzle prevented oxygen from diffusing into the fuel nozzle and stirred oxygen in the combustion chamber to suppress oxygen stratification. Because oxidizer was supplied from the vicinity of the wall of the combustion chamber, the fuel jet was a free jet issuing into an almost quiescent atmosphere. After the temperatures and the concentration sufficiently reached steady states, the fuel was sequentially supplied for each experiment. As shown in , the flow distribution of sodium, hydrogen, and inert gas in the fuel was changed without changing the total flow rate (1.7 × 10⁻⁴ m3 s−1). For experiment No. 1, sodium vapor and mist, which were a first fuel component, transported by the carrier gas (8.3 × 10⁻⁵ m3 s−1) was mixed with the same amount of heated inert gas in the fuel nozzle, and the sodium with a total flow rate of 1.7 × 10⁻⁴ m3 s−1 resulted in approximately 15 g m−3 and about 533 K. Subsequently, hydrogen, which was a second fuel component (8.3 × 10⁻⁵ m3 s−1), was later supplied instead of the inert gas. For experiment No. 2, hydrogen was supplied as the first fuel component (1.7 × 10⁻⁴ m3 s−1) and was heated up to about 533 K. Then, the fuel flow rate supplied from the hydrogen supply line was reduced by 8.3 × 10⁻⁵ m3 s−1, and sodium as the second fuel component was simultaneously supplied by the carrier gas of 8.3 × 10⁻⁵ m3 s−1. Finally, each fuel component was stopped in arbitrary order, and the fuel supply was returned to the inert gas to prepare a next experiment.
High-speed imaging for an ignition process was started just before the addition of the second fuel component. A two-dimensional image of luminance was recorded at a frame rate of 1000 fps and was displayed with a 12-bit gray scale (4096 gray levels). These images were analyzed afterward with a comprehensive and integrated software (Photron FASTCAM Viewer (PFV); Photron Limited, Tokyo, Japan) and a gray-level analysis software (ImageJ; National Institutes of Health). For recognizing the distribution of luminance explicitly, a gray-level transformation was applied to a raw image, and positions of light emitters were clarified by adjusting the brightness and contrast on the image. For comparing luminance values or applying a pseudo-color processing, raw luminance values were analyzed without adjusting gray-level histogram on the image. The pseudo-color processing is a technique which maps the gray levels of a monochrome image into an assigned color, and this difference in color makes it possible to clarify the difference in luminance which is difficult to distinguish at the gray level on the monochrome image.
3. Experimental results and image analyses
3.1. An overview of sodium and hydrogen flame
shows typical combustion images of hydrogen jets containing sodium. These images were extracted from a color video camera to grasp the overview of the phenomena. For experiment No. 1 (see )), this sodium reacted with oxygen and gradually began to form a diffusion flame, which almost settled at the fuel nozzle outlet. The sodium flame formed a cone of base diameter about 20 mm and height about 80 mm, and the second fuel component was later supplied to this sodium flame. The fuel jet (10 vol% hydrogen, 90 vol% argon, and sodium) soon produced a flame lifted from the fuel nozzle outlet. The lifted flame along the fuel jet was about 200 mm in length and was more unstable than the sodium flame. Subsequently, stopping the hydrogen supply returned the lifted flame to the sodium flame, whereas stopping the sodium supply extinguished any flame.
Figure 2. Typical combustion images taken with the color camera.
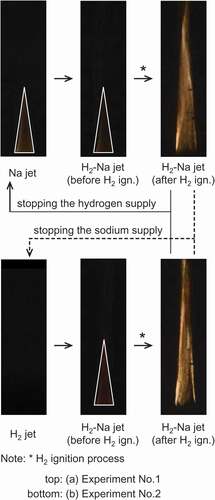
For experiment No. 2 (see )), the hydrogen did not burn because the thermocouples around the fuel nozzle hardly detected a temperature increase. The hydrogen jet containing sodium (10 vol% hydrogen, 90 vol% argon, and sodium) showed that the stable sodium flame was observed in the fuel jet and then formed the lifted flame. The flame extinguishment by stopping the fuel supply was also almost the same as the results in experiment No. 1. These experimental findings observed from indicated that the ignition process was essentially the same in both experiments. Because the lifted flame was formed only when the conical sodium flame and hydrogen coexist, this lifted flame was considered to be a diffusion flame initiated by hydrogen combustion. Additionally, it would seem that the hydrogen in the fuel was not continuously burning from the fuel nozzle outlet, but the lifted hydrogen flame was probably maintained by sodium combustion.
3.2. Sodium vapor and mist flame characteristics
shows an image of spatial luminance distribution in a typical diffusion flame produced by both sodium vapor and mist. The image (see )) was obtained with the optical measurement system, and the sodium flame was displayed in white on a black background. The gray-level transformation was applied to the monochrome image in order to clarify the flame structure. The sodium flame had many sparks which intermittently scattered outside the conical flame which was observed with the color video camera, and thus detecting these sparks seemed to require the high sensitivity to instantaneous light emission. The sodium vapor should have been almost condensed into sodium mist before releasing from the fuel nozzle because the vapor temperature was decreased by mixing with the carrier gas or the gas supplied from the hydrogen supply line. The sodium flame was attributed to the sodium combustion of a small amount of vapor and a large amount of mist. The sparks in the sodium flame could be explained by combustion of the larger mist particles which should be intermittently produced, and the conical flame could be produced by combustion of the smaller mist particles and vapor.
Figure 3. Spatial luminance distribution in a typical sodium flame.
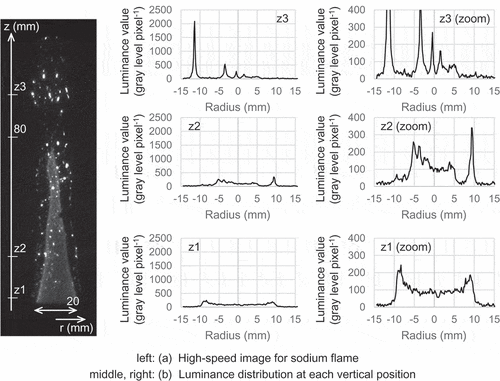
The luminance distribution at specific vertical heights is shown in ). High intensity peaks were detected at the edges of the conical flame and at the scattered mist particles. The luminance value at the position closest to the fuel nozzle outlet (z = z1 = 3 mm) remained constant on the conical flame surface and increased at the edges of the flame. The increase could result from longer light paths where the luminance flux was integrated along a horizontal direction. The luminance value at the intermediate position (z = z2 = 21 mm) had several peaks in addition to both edges of the conical flame and also had a peak outside its flame. These peaks corresponded to positions of sodium mist particles, which were higher luminance values than the conical flame. The high luminance value outside the conical flame (z = z3 = 98 mm) was high intensity only at positions of the scattered mist particles, and these mist particles had the luminance values about 2 to 25 times larger than the conical flame surface. Such a high luminance value suggested that the mist particle had a high flame temperature, but directly measuring the flame temperature of a floating mist particle required a difficult technique to detect the position and the temperature of the mist particles, which were randomly released from the fuel nozzle. When the flame temperature tried to be evaluated from a difference in luminance, the mist particles with high luminance values suggested to be sufficient higher flame temperature than the conical flame temperature, which ranged from about 573 K to 650 K on the conical flame surface. It should be noted that this flame temperature of the conical flame was obtained from the radial temperature profile using the movable thermocouple. The flame temperature reached a maximum on the flame surface and monotonically decreased to the gas temperature in the combustion chamber as the thermocouple moved in the radial direction of the fuel nozzle.
) shows variation with time in luminance of the sodium flame, which was composed of both the conical flame and the sparks, and ) shows that of the conical flame with little sparks near the fuel nozzle outlet. The total luminance value in each region, which was the entire area for region (a) and was the specific area near the fuel nozzle outlet for region (b), was normalized by an average luminance value in each region between t = Ts and t = Ts + 1.0 s. Here, the time t = Ts represents an arbitrary time while the sodium flame was present. The luminance value in all region fluctuated within plus/minus 50% of the average, whereas that of the conical flame was suppressed to the fluctuation within about plus/minus 10%. This difference in luminance fluctuations indicated that the conical flame remained almost stable luminance and that the sodium mist particles produced sparks intermittently.
Figure 4. Variation of normalized luminance for a sodium flame.
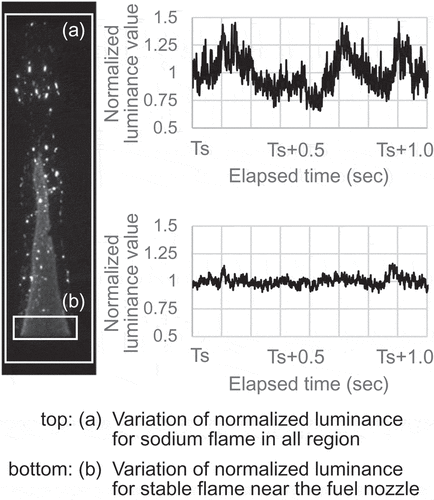
Analyzing the luminance images of the sodium flame provided compelling evidence that the sodium flame was composed of both the stable flame with the conical reaction zone and the sparks of various sizes scattering around this stable flame. The sparks could be interpreted as a higher temperature heat source than the stable flame. Additionally, this experimental method enabled production of the stable flame with the constant fluctuation range and thus implied that detailed observation was possible under stable experimental conditions.
3.3. Optical observation of a hydrogen ignition process
The high-speed observation under experiment No. 1 was effective by taking advantage of the later addition of hydrogen with good time response in the fuel supply. ) shows a change of flame luminance in a process from the sodium flame production to hydrogen ignition. The total luminance value on each image was normalized by an average luminance value of the sodium flame as described above. The bottom images in present pseudo-color images of luminance around the sodium flame and correspond to each typical time in the ignition process. The pseudo-color processing transformed monochrome images with a 12-bit gray scale (from 0 to 4095 Gy levels) into colored images using a lookup table shown in ), and a lower intensity threshold (less than 80) was determined to eliminate the background in the darkroom. In experiment No. 1 given in , hydrogen was supplied to the sodium flame at t = T0 – 3.0 s, and later this luminance value of the sodium flame containing hydrogen almost remained that of only the sodium flame until t = T0. The luminance value started to increase rapidly at t = T0 because the stable flame was conically covered with a bright region which contained many luminescent spots. The bright region did not propagate gradually downstream but almost simultaneously appeared around the stable flame. The luminance value after approximately t = T0 + 0.75 s stayed almost flat again, but spatial distribution of bright regions changed over time. Subsequently, such a bright region was developing over the stable flame and thus caused a further increase in luminance. Here, the time t = T0 was defined as an onset time when the rapidly increasing luminance value was extrapolated to the almost constant luminance value of the sodium flame after supplying hydrogen gas.
Figure 5. Variation of flame luminance in a hydrogen ignition process.
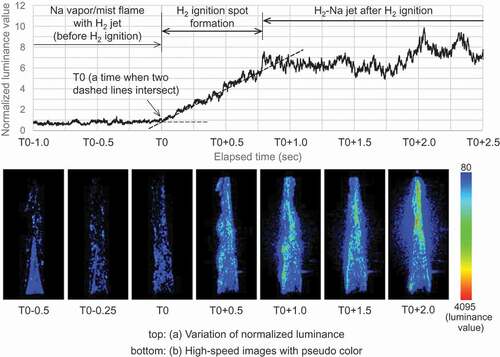
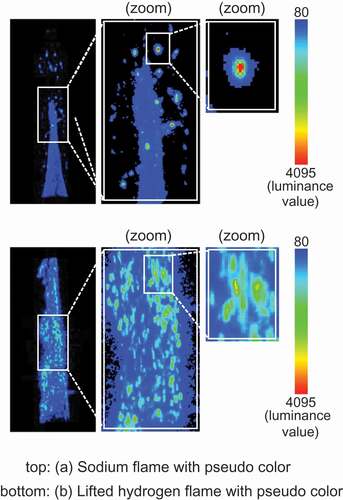
shows an enlarged view of the luminance distribution with pseudo color to focus on the high luminescent spot, and the sodium flame is shown to compare a structure of luminance distribution with the lifted hydrogen flame. The sodium flame had an almost homogeneous luminance distribution for the stable flame and had the high intensity sparks for the scattered sodium mist particles. The luminance distribution of the spark was localized around sodium mist particle. When hydrogen was added to the sodium flame, the luminance spot appeared to spread a larger area than the spark displayed by sodium mist particle and contain the spark of the sodium mist particle. This luminance distribution in the enlarged view indicated that hydrogen burned around sodium mist particle. Additionally, the increase in luminance demonstrated formation and development of hydrogen ignition spots and showed that the hydrogen ignition occurred at the beginning of the luminous transition (t = T0).
Figure 6. Enlarged view of the luminance distribution with pseudo color.
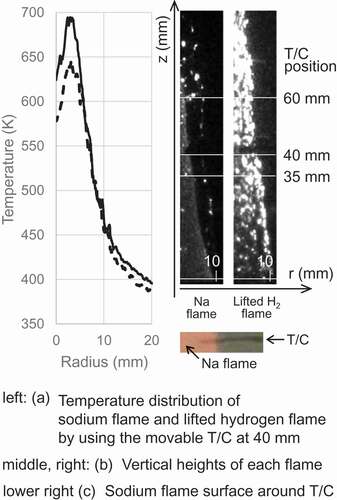
) shows a typical temperature distribution along the radial direction. The dashed line indicates the temperature around the sodium flame, and the solid line dose the temperature around the lifted hydrogen flame. These temperatures were measured by scanning a height of 40 mm at 200 µm s−1 after each flame reached steady state. The stable sodium flame showed the maximum temperature between the center (r = 0 mm) and the edge (r = 10 mm) of the fuel nozzle because the flame has the flame surface at the conical generatrix (see )). As shown in and , the lifted hydrogen flame was composed of particulate flames covering the stable flame, and each fine flame could not be directly detected by the thermocouple. This flame structure resulted in the temperature distribution of only the inner sodium flame, not a bimodal distribution. The temperature of the fuel jet increased above the fuel supply temperature by the stable flame but almost did not change at the position where the lifted flame outside the stable flame surface. The thermocouple fixed on the central axis showed different temperature behavior in relative positions to the flame surface. For the sodium flame (stable flame), a temperature measured by the thermocouple at 35 mm above the fuel nozzle was about 613 K, which was generally the same temperature detected by the movable thermocouple at 40 mm above the fuel nozzle. The thermocouple at 60 mm inserted between the flame surfaces of the conical flame indicated a temperature exceeding 673 K, and the thermocouple at 100 mm did a temperature of about 573 K because it was located downstream of the flame surface. For the lifted hydrogen flame, temperatures measured by the thermocouple at 35 and 60 mm increased by about 20–40 K more than those for the sodium flame. A temperature measured by the thermocouple at 100 mm increased to about 653 K because the lifted hydrogen flame was longer than the sodium flame. Additionally, ) shows that the flame surface on the insertion side of the thermocouple had no discontinuity and was insensitive to whether the thermocouples were installed or not because the contact area between the thermocouples and the flame surface was negligible. The thermocouples were thus considered to have little influence on the characteristics of the flame.
Figure 7. Typical temperature distribution along the radial direction.
4. Discussion
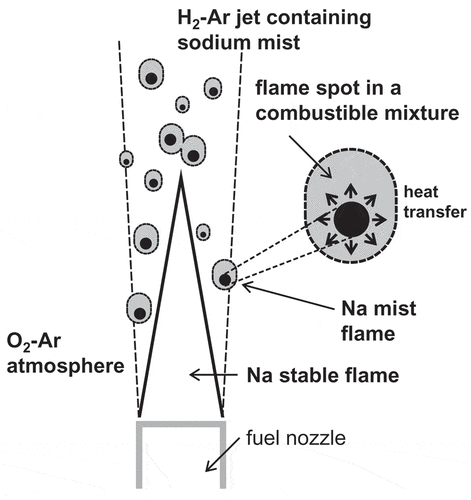
The experimental findings revealed that hydrogen ignition was induced by spontaneous ignition of sodium mist particles. This ignition mechanism of hydrogen jet containing sodium mist must have indicated that the reaction heat released by sodium combustion played an ignition source for a combustible mixture of hydrogen and oxygen as illustrated in . The hydrogen jet containing sodium mist particles was injected from the fuel nozzle and reacted with the oxygen in the combustion chamber. At the boundary between these gases, the combustible mixture was formed along the jet. Because the sodium mist particles produced the scattered sparks in the mixture, this combustion heat was transferred to the mixture around the sodium mist flame. The ignited sodium mist particles triggered the hydrogen ignition, and the hydrogen started to burn locally around the sodium mist particles.
Figure 8. Ignition mechanism of hydrogen jets containing sodium mist.
It is known that hydrogen ignition is caused by an explosive increase in reaction rate of a combustible mixture and that the reaction rate is sensitive to a temperature change. This common idea led us to presume that the combustible mixture around sodium mist particles should be heated greater than or equal to an ignition threshold temperature, resulting in the hydrogen ignition. This simple approach requires that the flame temperature of a sodium mist particle be higher than the ignition temperature threshold of hydrogen. The possibility of ignition was evaluated on the basis of several studies about these temperatures. It is generally accepted that an autoignition temperature of hydrogen is about 800 K [Citation11], and the temperature could be interpreted as a criterion that a reaction rate of a combustible mixture increases markedly. The autoignition temperature has the lowest temperature at a stoichiometric ratio and depends on the ratio of the combustible mixture. The autoignition temperature increases as hydrogen concentration decreases, and it was reported to reach about 873 K at 6 vol% hydrogen [Citation12]. These studies provided that when the combustible mixture was heated about 800 K or more, the reaction rate rapidly increase and hydrogen could ignite. According to some research on sodium combustion, the sodium flame temperature increased as its particle size decreased, and even a few millimeters of sodium droplets reached a flame temperature of 1573 K. The sodium particle size in this study was not measured experimentally, but the particle size distribution was assumed to be a log-normal distribution with a median radius of tens of micrometers. This was based on the particle size distribution of sodium mist into which sodium vapor was condensed under a large temperature difference between sodium vapor and cover gas [Citation13]. Because the flame temperature of the sodium mist particle with a small particle size seemed to be higher than the autoignition temperature of hydrogen, each mist particle should have been a reasonable ignition source to ignite a combustible mixture. This reasoning was consistent with the heterogeneous ignition source demonstrated in this study.
If the hydrogen ignition resulted from homogeneous combustion of sodium vapor rather than heterogeneous combustion of sodium mist particles, a sodium vapor concentration to ignite hydrogen could have been estimated from a simple heat balance calculation. This calculation assumed that the sodium vapor was mixed homogeneously with a combustible mixture in a control volume where the ignition occurred. The sodium vapor concentration required to raise the combustible mixture to the autoignition temperature of hydrogen was evaluated with the following EquationEquation (1)(1)
(1) :
EquationEquation (1)(1)
(1) was derived from an adiabatic condition that combustion heat of sodium represented by EquationEquation (2)
(2)
(2) was converted to increase the temperature of the combustible mixture. The combustion heat was thus equal to the heat capacity of the ideal combustible mixture represented by EquationEquation (3)
(3)
(3) . This adiabatic condition was a conservative evaluation which estimated the minimum value of sodium vapor concentration required to ignite the mixture because combustion heat could be lost to the jet stream before ignition.
The combustion heat per unit mole in EquationEquation (2)(2)
(2) was generated by two significant combustion reactions between sodium and oxygen after vaporization of sodium mist (see EquationEquations (4
(4)
(4) )–(Equation6
(6)
(6) )), and these reactions were dependent on a reaction ratio determined by various oxygen concentration and temperature conditions.
The reaction enthalpy of a reactant or a product was defined by the following formula (7):
where the heat capacity of a reactant or product depended on temperature and was based on the CHEMKIN thermodynamic database [Citation14]. The properties of the combustible mixture in EquationEquation (3)(3)
(3) were determined by the concentration of the combustible mixture, which resulted from mixing the fuel and the oxidizer. Unfortunately, it is technically difficult to measure both the combustion heat and the concentration of the mixture accurately. The experimental results showed that hydrogen ignition occurred outside the sodium stable flame at the conical interface between the fuel jet and the oxidizer-filled space in the combustion chamber. This suggested that the concentration of the combustible mixture could be simplified as a perfect mixture, which composed of a hydrogen concentration of 5 vol% and an oxygen concentration of 10 vol%, and the ignition temperature was estimated to be over 873 K. The temperature of the perfect mixture was assumed to be about 533 K, which is the fuel supply temperature condition. As shown in , no sharp rise in temperature was detected at the time of ignition near the interface, although the temperature increased in the axial direction of the fuel jet after the lifted hydrogen flame was produced. It would be thus reasonable to substitute the fuel temperature for the mixture temperature in the calculation on the ignition process.
shows a calculation result evaluated by EquationEquation (1)(1)
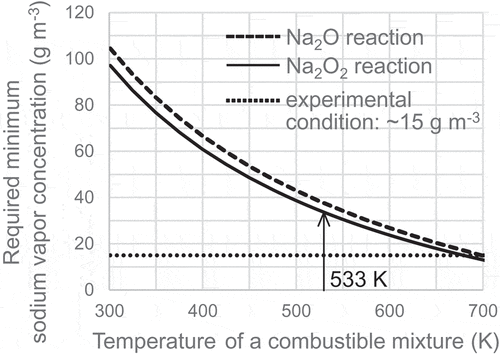
(1) . The dashed line and the solid line indicate each limit of the lowest sodium vapor concentration to ignite the perfect mixture depending on the reaction ratio of sodium combustion. The dotted line represents the sodium concentration condition (about 15 g m−3) in this study. If all the sodium burned by the reaction to generate Na2O2, which has a greater combustion heat than the reaction to generate Na2O, the minimum concentration of sodium vapor would be required to ignite the combustible mixture. In contrast, if only the reaction to generate Na2O occurred, the required sodium vapor concentration would take the maximum value at each temperature. Under the temperature condition as mentioned before, the Na2O2 reaction is thermodynamically more stable than the Na2O reaction in an equilibrium state. However, it would be better to calculate the ignition limits in order to simulate the actual ignition phenomenon in a nonequilibrium state because this simple calculation included the assumptions about the concentration and temperature of the combustible mixture. As shown in , the sodium vapor concentration for igniting the perfect mixture at 533 K was required to be at least 30 g m−3 or more and was about two times larger than the sodium concentration in the experimental condition. The calculation result indicated that homogeneous sodium vapor was insufficient for hydrogen ignition and suggested that localized heterogeneous sodium such as sodium mist particle was the ignition source from the viewpoint of the combustion heat.
Figure 9. Sodium vapor concentration needed to ignite a combustible mixture.
This study focused on observing the detailed ignition process and clarifying the ignition mechanism under identical experimental conditions on the temperature and the concentration. Further work should explore the ignition mechanism using different experimental conditions and investigate various combustion characteristics of hydrogen jets containing sodium.
5. Conclusion
In this study, the non-premixed combustion experiment of hydrogen jets containing sodium vapor and mist was carried out. The detailed observation of the ignition process by high-speed imaging successfully resulted in identifying the ignition source for hydrogen ignition. The main conclusions are follows:
The order of the fuel supply (sodium or hydrogen) had little influence on the transition of the ignition phenomena where the hydrogen ignition occurred after the production of the sodium flame, which was composed of both the conical flame and the scattering sparks.
The combustion heat of sodium mist particles triggered the hydrogen ignition in the fuel temperature where sodium had low saturated vapor pressure like this experimental condition.
The simple heat balance calculation showed that the combustion heat of sodium vapor could not activate the ignition of the combustible mixture and supported the heterogeneous ignition mechanism demonstrated by the experimental results.
Nomenclature
| = | Sodium concentration (g m−3) | |
| = | Combustion heat of sodium (kJ mol−1) | |
| = | Molecular weight of sodium (kg mol−1) | |
| = | Pressure (Pa) | |
| = | Gas constant (J K−1 mol−1) | |
| = | Molecular weight of the combustible mixture (kg mol−1) | |
| = | Heat capacity of the combustible mixture (J kg−1 K−1) | |
| = | Ignition temperature of the combustible mixture (K) | |
| = | Temperature (K) | |
| = | Volume (m3) | |
| = | Gas mass (kg) |
Acknowledgments
We thank Professor M. Konomura and Professor T. Watanabe of the University of Fukui for years of collaboration and advice. We would also like to take this opportunity to thank the collaborators on this experiment in Japan Atomic Energy Agency and offer special thanks to Mr T. Watanabe for the operation of the Sodium Engineering Research Facility.
This study is a part of the results of ‘Development of Estimation Technology for Availability of Measure for Failure of Containment Vessel in Sodium Cooled Fast Reactor’ and supported by the Ministry of Education, Culture, Sports, Science and Technology (MEXT). This work was supported by the Ministry of Education, Culture, Sports, Science and Technology.
Disclosure statement
No potential conflict of interest was reported by the authors.
References
- Ohno S, Seino H, Miyahara S. Development of severe accident evaluation technology (Level 2 PSA) for sodium-cooled fast reactors, 5; Identification of dominant factors in ex-vessel accident sequences. Proceeding of 2009 International Congress on Advances in Nuclear Power Plants; 2009 May 10–14; Tokyo.
- Gluekler EL, Huang TC. Response of secondary containment to presence of sodium and hydrogen. Nucl Eng Des. 1979 Dec;55:283–291.
- Newman RN. The ignition and burning behaviour of sodium metal in air. Prog Nucl Energy. 1983;12:119–147.
- Ohshima I, Ikeda M, Uno T. Experimental study on sodium burning flame temperature. Proceeding of 7th Topical Mtg. on Emergency Preparedness and Response; 1999 Sep 14–17; Santa Fe (NM).
- Sato K. Study on combustion behavior of sodium droplet – combustion experiment of suspended sodium droplet – JFY2000–2001 joint research report. Japan: Japan Nuclear Cycle Development Institute; 2003. (Report no. JNC TY9400 2003–008). (in Japanese).
- Glassman I. Solid propellant rocket research. Cambridge (MA): Academic Press; 1960. Combustion of metals: physical considerations; p. 253–258.
- Wierman RW, Hilliard RK. Experimental study of hydrogen formation and recombination under postulated LMFBR accident conditions. USA: Hanford Engineering Development Laboratory; 1976. ( Report no. HEDL–TC–730).
- Wierman RW, Muhlestein LD. Hydrogen ignition and recombination following postulated breeder reactor accidents. Proceeding of International Mtg. on Fast Reactor Safety Technology; 1979 Aug 19–23; Seattle (USA).
- Murata KK, Carroll DE, Bergeron KD, et al. CONTAIN LMR/1B-Mod. 1, A computer code for containment analysis of accidents in liquid-metal-cooled nuclear reactors. USA: Sandia National Laboratories; 1993. ( Report no. SAND91–1490).
- Coward HF, Jones GW. Limits of flammability of gas and vapors. USA: Bureau of mines; 1952. (Report no. Bulletin 503).
- Greene GA. Advances in heat transfer: heat transfer in nuclear reactor safety. San Diego (CA): Academic Press; 1997. Hydrogen combustion and its application to nuclear reactor safety; p. 84–86.
- Conti RS, Hertzberg M. Thermal autoignition temperatures for hydrogen-air and methane-air mixtures. J Fire Sci. 1988 Sep;6:348–355.
- Yamamoto H, Sakai T, Murakami N. Analytical study on mass concentration and particle size distribution of sodium mist in cover gas phase of LMFBR reactor vessel. J Aerosol Sci. 1991;22(suppl 1):S713–S716.
- Kee RJ, Rupley FM, Miller JA. The Chemkin thermodynamic data base. USA: Sandia National Laboratories; 1990. (Report no. SAND87–8215B).