
 ?Mathematical formulae have been encoded as MathML and are displayed in this HTML version using MathJax in order to improve their display. Uncheck the box to turn MathJax off. This feature requires Javascript. Click on a formula to zoom.
ABSTRACT
To investigate the kinetic recovery process of low dose neutron-irradiated graphite, nuclear-grade isotropic graphite IG-110U and ETP-10 were neutron irradiated using the JMTR up to 1.38 × 10²³ n/m2 (En > 1 MeV) at ~473 K. In-situ measurement of macroscopic length was conducted during the isothermal and isochronal annealing process from room temperature up to 1673 K. From room temperature to 773 K for IG-110U, and to 1023 K for ETP-10, macroscopic lengths, lattice parameters, and unit cell volumes of both specimens recovered to their pre-irradiation values, and this recovery process subdivided into two stages. The activation energies of macroscopic volume recovery at 523–673 K and 673–773 K were determined to be ~0.22 eV and ~0.57 eV for IG-110U, respectively; ~0.13 eV and ~2.59 eV at 523–923 K and 923–1023 K for ETP-10, respectively. The migration of not only single interstitials but also interstitials dissociated from submicroscopic interstitial groups along basal planes followed by vacancy-interstitial recombination play a dominant role in the first stage. The second stage is suggested to proceed via the motion of carbon groups along basal planes for IG-110U, and migration of single interstitials along the c-axis for ETP-10. During 773 K or 1023 K up to 1673 K, macroscopic length continuously shrank with decreasing shrinking rate, even with a turnaround to swell at 1173 K for IG-110U.
1. Introduction
Nuclear graphite has been widely used in gas-cooled nuclear reactors as moderators from the first man-made nuclear reactor up to now, due to its low atomic number (Z), large scattering cross-section, and high melting point, especially with the developing of high-temperature gas-cooled reactors (HTGRs) [Citation1] and very-high-temperature gas-cooled reactors [Citation2]. Also nuclear-grade graphite plays a significant role in fusion devises [Citation3].
Neutron irradiation induces the changes in dimensional and physical properties of nuclear graphite, therefore lifetime of graphite and safety of reactors are highly influenced by the degree of defects introduction. The influence of neutron irradiation on the properties of graphite has been reported by many researchers [Citation4–Citation11]. Based on this information, the damage induced by neutron irradiation is briefly introduced here. High-energy neutron irradiation causes the displacement of carbon atoms to interstitial sites and remains vacancies at the lattice-sites. Interstitials become mobile with increasing temperature and form clusters, and even new atomic planes. Such defects contribute to the expansion of the c-axis, which is perpendicular to the basal plane and the shrinkage of the a-axis, which is in the basal plane. At the same time, man-made graphite blocks are a kind of porous materials, pores and cracks have a strong impact on its properties [Citation4,Citation8,Citation12]. For instance, the internal aligned pores can accommodate the expansion of the c-axis and shrinkage of the a-axis, and dominates the bulk properties. If the annealing temperature increases, difference between the changes of the a- and c-axis lattice parameters results in the generation of new pores.
In order to extend the lifetime of nuclear graphite, thermal annealing is considered as the main method to reduce the influence of neutron irradiation. Burchell [Citation13] has conducted an intensive experiment on the annealing behavior of neutron-irradiated NBG-10 graphite (an extruded nuclear-grade graphite made by SGL Carbon, apparent density 1.8 g/cm3), especially on the macroscopic dimensional changes. Neutron-irradiated NBG-10 graphite continuously shrank with increasing annealing temperature, followed by a turnaround to swell, and the recovery of dimensional change did not saturate at annealing temperature of 2273 K.
Activation energies of point-defects’ annihilation in graphite have ever been accumulated by Thrower and Mayer [Citation14], etc. by means of theoretical simulation. Experimental observations of them are still a few. In this paper, on the basis of our previous work [Citation15], in situ measurement of macroscopic dimensions by a precision dilatometer was conducted for the low dose (0.02 dpa), low temperature (473 K) neutron-irradiated nuclear graphite of IG-110U and ETP-10, the same materials with the previous study [Citation15] but one order of magnitude lower fluence, to investigate the kinetic recovery process of low dose neutron-irradiated nuclear graphite. The mechanisms of recovery process were analyzed combined with the changes of macroscopic dimensions and lattice parameters, and then clarify the effect of neutron dose.
2. Experimental procedures
Nuclear-grade isotropic graphite specimens, IG-110U and ETP-10, were used in this paper. IG-110U is the purified-grade of IG-110, both produced by Toyo Tanso Ltd., Japan, and the latter has been used in the Japanese High-Temperature Engineering Test Reactor [Citation1]. As for ETP-10, it has been used as the first wall materials of the JT-60 fusion devices [Citation3]. Some properties of unirradiated IG-110U and ETP-10 are shown in . Specimens were in the shape of 2 × 2 × 25 mm3 rectangular bars, and neutron irradiated in the Japan Materials Testing Reactor wrapped with aluminum foil. The neutron irradiation fluence was 1.38 × 10²³ n/m2 (En > 1 MeV), corresponding to 0.02 dpa (displacement per atom) [Citation16,Citation17]. The irradiation temperature was ~473 K.
Table 1. Some properties of the IG-110U and ETP-10 specimens
The annealing behavior of neutron-irradiated nuclear graphite was investigated using a precision dilatometer (DIL 402C, NETZSCH, Germany). Length changes of graphite specimens were continuously measured in situ from room temperature (~293 K) up to 1673 K with a step-heating temperature interval of 50 K in helium atmosphere. The heating rate between each step was 5 K/min. The specimens were isochronally annealed for 6 h at each step. Details of this measurement were described in the previous report [Citation15]. The minimum detection sensitivity of this dilatometer is less than 10 nm, corresponding to 0.00004% for a 25-mm-long specimen. Volume changes were calculated from the length changes on the assumption of isotropic shape change.
Lattice parameter change was measured by X-ray diffractometry (PW-1700, Philips, The Netherland). After isochronal annealing for 6 h at steps of 473, 673, 873, 1073, 1173, 1273, 1373, 1473, 1573, and 1673 K, the XRD profiles were obtained by step-scan method (5 s at 0.02° (2θ-Cu Kα)) step from 20° to 90° at room temperature (~293 ± 1 K). Si was used as an internal standard. The unit cell volume was calculated based on the obtained lattice parameters.
3. Results and discussion
3.1 Recovery process by isochronal and isothermal annealing
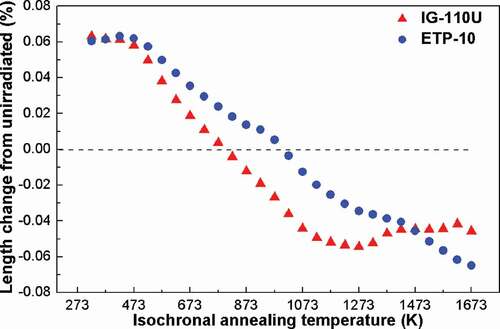
Changes in the macroscopic length of neutron-irradiated nuclear graphite IG-110U and ETP-10 specimens by isochronal annealing for 6 h at each step up to 1673 K are shown in . The lengths of each specimen before irradiation were set as standards. The recovery process started at 473 K, which corresponded to the irradiation temperature of both specimens. Macroscopic length of the ETP-10 specimen continuously decreased from 473 to 1673 K with increasing annealing temperature. Macroscopic length of the ETP-10 specimen returns to its original length at around 1023 K. On the other hand, the neutron-irradiated IG-110U specimen shrunk with increasing annealing temperature up to 1273 K from 473 K, and returned to its pre-irradiation length at around 773 ~ 823 K. A remarkable phenomenon occurred that the neutron-irradiated IG-110U specimen turned round to swell after 1273 K up to 1673 K with increasing annealing temperature. Shrinkage was observed in both ETP-10 and IG-110U specimens after annealing at 1673 K, but their changes appeared not to be saturated. Mostly opposite change-trends occurred in the macroscopic length changes of the neutron-irradiated ETP-10 and IG-110U specimens beyond 1273 K. Our previous study [Citation15] showed that change trends of macroscopic length of the ETP-10 specimen of one order of magnitude higher dose is similar with the present ETP-10 specimen, however different trend for IG-110U. Absolute values of changes were largely different between different dose specimens. Macroscopic length change of the same irradiated graphite, IG-110U and ETP-10, by thermal annealing was firstly measured by Maruyama [Citation18] by applying isochronal annealing for 30 min and measured length change using a conventional micrometer with precision of ±1 μm at room temperature. Decreasing tendencies of length for each specimen with increasing annealing temperature were similarly observed, however more precise changes for long duration time were obtained in this study.
Figure 1. Macroscopic length changes of the neutron-irradiated IG-110U and ETP-10 specimens by isochronal annealing for 6 h at each temperature step by dilatometer method.
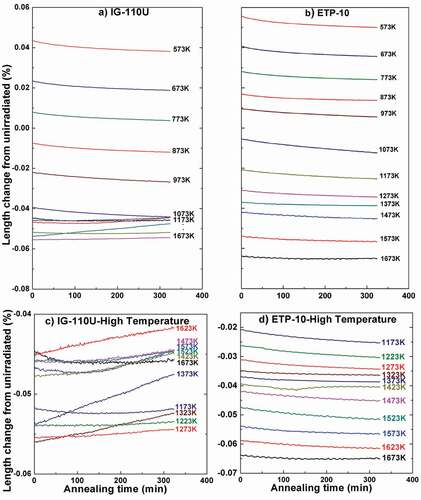
The macroscopic length changes of the neutron-irradiated IG-110U and ETP-10 specimens during isothermal annealing for 6 h are shown in . (a,b) shows the length change from 573 to 1673 K by the interval of 100 K. The IG-110U specimen kept shrinking during each isothermal holding up to 1123 K, followed by turnaround at 1173 K and swelling up to 1623K, as shown in (c), which showed the change by the interval of 50 K from 1173 to 1673 K. On the other hand, the ETP-10 specimen continuously shrank during each isothermal holding up to 1673 K, as shown in (b and d). The length change during each holding step was very small, and not linear with respect to annealing time.
Figure 2. Length change as a function of the isothermal annealing time by the interval of 100 K from 573 K to 1673 K of the neutron-irradiated (a) IG-110U, (b) ETP-10 and by the interval of 50 K of (c) IG-110U from 1173 K to 1673 K, (d) ETP-10 from 1173 K to 1673 K.
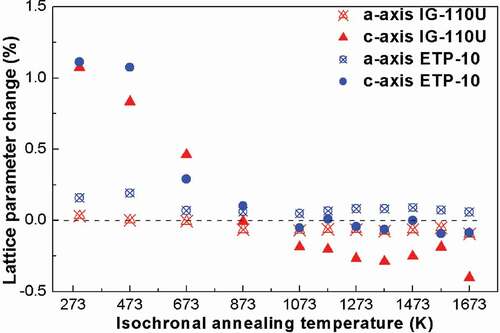
The a- and c-axis lattice parameter changes of the neutron-irradiated IG-110U and ETP-10 specimens after each isochronal annealing (6 h) step from room temperature up to 1673 K are shown in . The average in-plane lattice parameter, a-axis, of both specimens varied in a small scale with increasing annealing temperature. As for the c-axis, both the IG-110U and ETP-10 specimens almost exhibited the same trends with increasing isochronal annealing temperature. Both specimens swelled obviously after the neutron irradiation, and then continuously shrank up to ~1073 K during the annealing process. The c-axis of the IG-110U specimen returned to the pre-irradiation value after isochronal annealing at around 873 K, and at around 973 K for the ETP-10 specimen. At annealing temperatures from 1073 K to 1673 K, the changes of the c-axis in both specimens showed almost constant but less than pre-irradiation values while some fluctuation was observed.
Figure 3. The a- and c-axis lattice parameters changes of the neutron-irradiated IG-110U and ETP-10 specimens after different isochronal annealing steps for 6 h from room temperature up to 1673 K.
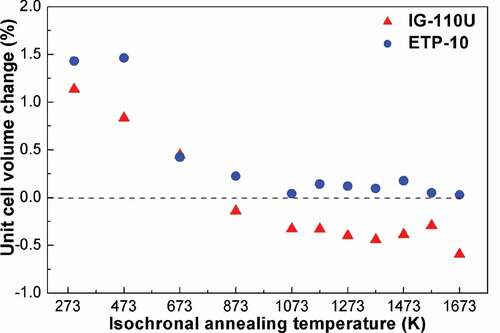
The unit cell volume changes of the neutron-irradiated IG-110U and ETP-10 specimens after different isochronal annealing steps are shown in . The unit cell volume of both specimens continuously shrank up to the temperature step at around 1073 K. During the shrinkage process, the unit cell volume of the IG-110U specimen returned to the pre-irradiation value after isochronal annealing step at around 773 K, and the ETP-10 specimen at 1073 K. Beyond 1073 K, the unit cell volume of IG-110U specimen was not obviously changed and kept smaller than the pre-irradiation value up to 1673 K. As for the ETP-10 specimen, the value of unit cell volume also showed no obvious change beyond 1073 K, but slightly larger than the pre-irradiation value.
Figure 4. Unit cell volume changes of the IG-110U and ETP-10 specimens after different isochronal annealing steps for 6 h.
3.2 Kinetic analysis on recovery process
As we have discussed in the previous paper [Citation15], the thermal annealing process of graphite can be understood with kinetic models [Citation19]. Due to low-dose (1.38 × 10²³ n/m2) neutron irradiation and low irradiation temperature (473 K), the recovery processes of the defects induced into the neutron-irradiated IG-110U and ETP-10 specimens could be considered basically as recombination of interstitials and vacancies, so that a first-order reaction is assumed, which was considered in our previous research [Citation15] and by other researchers for graphite or silicon carbide [Citation20,Citation21]. In a first-order reaction, the recovery process could be analyzed by Arrhenius equation:
where k is the rate coefficient of the reaction; Ea is the activation energy; kB is the Boltzmann's constant; A is the Arrhenius factor; T is the absolute temperature; and R is the universal gas constant. We take the natural logarithms of (1) and get the following equations:
Thus, Ea could be calculated from the gradient of the linear function between the logarithm of k and 1/T.
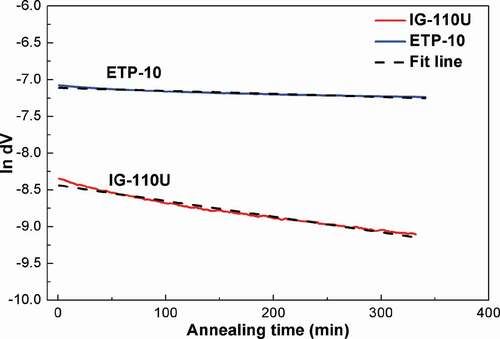
The relationship between the logarithms of volume changes of the IG-110U and ETP-10 specimens and isothermal annealing time at 773 K is shown in . The slopes of fitted straight lines in this figure represent the volume recovery rate coefficients k in the first-order reaction at 773 K.
Figure 5. Logarithms of macroscopic volume changes of the IG-110U and ETP-10 specimens against isothermal annealing time at 773 K. Fitted straight lines are also indicated.
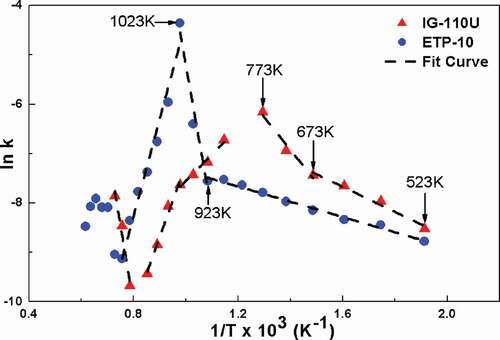
The Arrhenius plot of the rate coefficients derived from macroscopic volume recovery of neutron-irradiated IG-110U and ETP-10 specimens according to k values is shown in . The k values were the slopes of fitted straight lines obtained by least-squares method as in at each isothermal annealing temperature from 523 K to 1673 K. Ea was obtained by the least-squares method from the Arrhenius plots, and corresponding R2 values are listed in .
Table 2. The activation energies and corresponding R2 values obtained by Arrhenius plots
The macroscopic dimension, the c-axis lattice parameters and the unit cell volume of the neutron-irradiated specimens recovered to those pre-irradiation values at the isochronal annealing temperature of 773 ~ 823 K for the IG-110U specimen and ~1023 K for the ETP-10 specimen, as shown in , , and , respectively. The rate coefficients during the recovery processes are shown in . In Part I from room temperature to ~773 K or ~1023 K, the Arrhenius plots were divided further and fitted by two straight lines, i.e. separated into two different stages. The Ea values were determined to be ~0.22 eV and ~0.57 eV at 523–673 K and 673–773 K, respectively, for the IG-110U specimen; ~0.13 eV and ~2.59 eV at 523–923 K and 923–1023 K, respectively, for the ETP-10 specimen. Part II was from 773 K or 1023 K to 1673 K for the IG-110U and the ETP-10 specimens, respectively, and the specimens continuously shrank with slower and slower rate. As shown in , the macroscopic length of the IG-110U specimen even turned around to swell beyond 1273 K.
Figure 6. Arrhenius plot of the reaction rate coefficients derived from macroscopic volume recovery of the IG-110U and ETP-10 specimens according to k values.
Neutron-irradiation-induced defects in nuclear graphite have been discussed by many researchers [Citation10,Citation22], and in our previous study [Citation15]. Interstitials can move freely and tend to collide into two kinds of immobile groups. The first group could gather diffusing interstitials and eventually form new planes. The second group consists 4 ± 2 carbon atoms and will not grow, called ‘submicroscopic’ interstitial groups, which mainly results in the swelling of the c-axis lattice parameter. Carbon dimer C2 is considered as stable species in this group. At low irradiation temperature and low irradiation dose, as-produced vacancies keep single and immobile [Citation8,Citation13], and can accept diffusing interstitials for annihilation. The migration of interstitials and then annihilation with vacancies are the main contributor to the change of micro- and macro-dimensions with increasing annealing temperature. The migration energies of single interstitials were demonstrated to be only 0.02–0.5 eV [Citation10], and the barrier of interstitials to recombine with vacancies was reported to be ~0.24 eV by Kelly [Citation22]. Values of 0.2 eV and 0.47 eV have also ever been suggested to be the interstitial migration energy along the basal plane [Citation23]. Besides, motion of interstitial groups parallel to the basal plane was demonstrated to be 1.0–1.25 eV [Citation10].
3.3 Comparison of recovery process with higher dose specimens
The recovery processes of the present neutron-irradiated IG-110U and ETP-10 (0.02 dpa) specimens were compared with the same materials but one order of magnitude higher dose neutron-irradiated specimens (~0.25 dpa) [Citation15], as shown in . The recovery process of the present specimens showed similar trends as a whole with the higher dose neutron-irradiated specimens reported in our previous study.
Figure 7. Activation energies of the higher- and the lower-dose neutron-irradiated IG-110U and ETP-10 specimens for recovery as a function of annealing temperature.
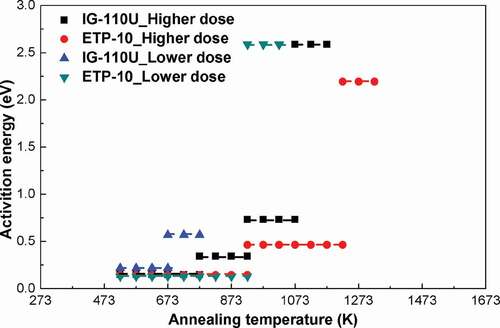
Firstly, as for the first stage of the Part I recovery, the Ea of the IG-110U and ETP-10 specimens in the present study were determined to be ~0.22 eV and ~0.13 eV, respectively. Approximate value of Ea = 0.15 eV was reported for the first stage of the higher-dose-irradiated IG-110U and ETP-10 specimens [Citation15]. Therefore, migration of single interstitials along the basal plane (0.2 eV or less [Citation10,Citation14]) and recombination with vacancies (energy barrier 0.24 eV [Citation22]) were considered to be the main mechanism in this stage, the same with the higher-dose specimens. In the second stage of the neutron-irradiated IG-110U specimen, the value of Ea (0.57 eV) was similar with the second and third stage of the higher-dose IG-110U specimen (0.34 and 0.73 eV), so that C2, (C2)2, and other carbon groups may have moved along the basal plane in this stage (1.0–1.25 eV [Citation10]). As for the second stage of the neutron-irradiated ETP-10 specimen, the value of Ea (2.59 eV) was so similar with the last stage of higher-dose specimens (2.59 eV of IG-110U, 2.19 eV of ETP-10). Migration of single interstitials along the c-axis (2.3 eV [Citation10]) or the migration of single vacancy (1.75 eV [Citation10], 3.1eV [Citation14]) may occur in this stage. Considering the temperature range in this stage, the former was suggested to be the main contributor. Throughout the recovery process of the Part I in this study, the lattice parameter of the c-axis continuously shrank but the a-axis did not change obviously. It is suggested that, during the Part I recovery, not only single interstitials but also interstitials dissociated from ‘submicroscopic’ interstitial groups may migrate along the basal plane and annihilated with vacancies. Single interstitials may not affect to both lattice parameters, but ‘submicroscopic’ interstitial groups expand mainly the c-axis. Shrinkage of the c-axis may correspond to decrease of ‘submicroscopic’ interstitial groups. It was noteworthy that all of the parameters measured in this study recovered to the pre-irradiation values up to around ~1023 K. One possible explanation is that neutron-irradiation-induced defects are mostly recovered or removed during this temperature range by the mechanism mentioned above. Another possibility is that plenty of interstitials, including those from the ‘submicroscopic’ interstitial groups migrate to sinks, such as grain surface (edge of grains). However, the former mechanism is considered to be the main contributor because volume of the specimens continuously shrank.
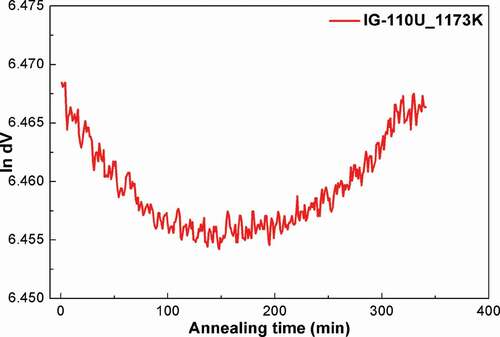
Secondly, as for the recovery process of the Part II, i.e. higher temperature ranges than those of the Part I, the reaction rate (volume shrinkage rate) of the both specimens decreases with increasing annealing temperature, as shown in . The lattice parameters and unit cell volume did not show continuous changes and mostly constant, on the other hand macroscopic volume continuously shrank up to 1673 K in the case of ETP-10 specimen, and up to 1273 K for the IG-110U specimen in this study. The latter specimen showed slight volume swelling over the onset of turnaround at annealing temperature of 1173 K, as shown in . Burchell [Citation13] reported the annealing behavior of macroscopic dimensions in neutron-irradiated nuclear-grade graphite NBG-10. Most of the samples, neutron irradiated by 0.65–4.88 dpa at 548–973 K, continuously shrank with increasing annealing temperature, and turned around to swell at annealing temperature of around 1773 K. Especially the specimens which were neutron irradiated at relatively lower temperature 573 ± 25 K and 548 ± 25 K by 0.65 and 1.88 dpa respectively, swelled after the neutron irradiation, and showed continuous shrinkage until a turnaround to swell beyond annealing at 1773 K. Several authors [Citation24,25] studied the effect of irradiation dose on the macroscopic dimensions of graphite. Graphite shrank in lower fluences, in prior to a turnaround to swell with increasing neutron irradiation dose. Compared two groups of graphite specimens irradiated at 1148 K and 873 K, turnaround occurred at lower fluence for the higher temperature irradiated specimens, and the maximum shrinkage of the specimen irradiated at 1148 K was approximately 60% of the specimen irradiated at 873 K [Citation24]. It was mentioned that the interaction of grains with pores lead to modification of microstructure (morphology change) and caused dimensional changes and a turnaround to swell [Citation13,Citation24]. The mechanism can serve as reference for the turnaround in the annealing process. Overall, since the micro-parameters in the Part II recovery mostly unchanged, as shown in and , the changes in macroscopic volume can be possibly attributed to the change in morphology, such as pores and cracks. Closure of pores within the polycrystalline graphite reduced the internal ‘accommodation’ for microstructure resulted in the onset of pore generation contributing to the turnaround [Citation24]. Furthermore, the recovery process may involve several complicated mechanism, such as the motion of vacancies. Another important phenomenon is that the dimensional changes induced by neutron irradiation still did not fully recover after annealing at 1673 K. The similar results were mentioned by other researchers [Citation5,25] that the recovery of macroscopic volume did not saturate at annealing temperature of 3073 K. Pore and crack generation/closure at higher temperature was considered as the probable causes of the non-recovery of volume.
Figure 8. Logarithms of macroscopic volume changes of the IG-110U against isothermal annealing time at 1173 K.
To sum up, compare to the recovery behavior of the present specimens (1.38 × 10²³ n/m2 (En > 1 MeV)) and the previous specimens (1.92 × 1024 n/m2 (En > 1 MeV)) [Citation15] irradiated at the same temperature of 473 K, general feature of recovery showed mostly the same tendencies. Degree of changes induced by neutron irradiation is larger for the higher dose specimens. In the both specimens with different irradiation doses during the annealing process, the macroscopic length and lattice parameters/unit cell volume returned to the pre-irradiation values. However, the cross-points, the temperature at which the values returned to the pre-irradiation values, are about 300 K higher for the specimen irradiated with higher dose. The cross-points of the ETP-10 specimens are commonly 200 K higher than those of the IG-110U specimens in each dosage. Lattice parameters of both specimens of lower dosage are changed gradually until the cross point temperatures. However, small shrinkage of the c-axis continued over the cross point temperature for the higher dose specimens. The activation energies for volume recovery during the Part I are subdivided into two (lower dose) to four (higher dose) stages, and also have resemble values but slightly different temperature ranges, as shown in . Comparing higher dose case and lower dose case, each stage with similar activation energy shifted to higher annealing temperature ranges for the higher dose specimens, commonly for the IG-110U and ETP-10 specimens. The reason for this difference is not clear at present, but may be related to an amount and kinds of induced defects. Turnaround from shrinkage to swelling of the macroscopic volume during annealing only observed for the IG-110U specimen of the lower dose.
From the activation energy consideration, the mechanisms of damage recovery in the Part I probably the common for graphite, i.e. not only single interstitials but also interstitials dissociated from ‘submicroscopic’ interstitial groups may migrate along the basal plane and annihilated with vacancies in the first stage. Then carbon groups such as C2, (C2)2, started to migrate along the basal plane. Furthermore, the migration of single interstitials along the c-axis also happens up to around cross point’s temperatures in the second stage of the Part I. These phenomena proceeded in the graphite crystals. At higher temperatures as labeled as the Part II recovery, shrinkage in macroscopic volume continuously occurs but lattice parameters of the crystal are mostly constant. It can be possibly attributed to the change in morphology, such as pores and cracks due to the high temperature, resemble to the sintering of polycrystalline materials. Higher the dose received, larger the amount of not only single point defects but also small carbon groups is induced into the graphite crystals, and higher annealing temperature is needed to annihilate them. Both IG-110U and ETP-10 are man-made nuclear graphite, manufactured by mixing, forming, baking, impregnation, and high-temperature graphitization from raw materials. Different raw petroleum coke, different basing method, and so on, result in the different properties of two kinds of nuclear graphite, as shown in , including significantly different grain size and mechanical properties. The differences between the specimens, IG-110U and ETP-10, may be attributed for the different manufacture process, such as raw materials, heat treatment temperatures, density, and microstructure such as grain size, degree of graphite’s crystallinity, porosity, pore size distribution, grain boundary property, and so on. Similarly, Burchell [Citation13] has ever suggested that differences in manufacturing process were contributors to different performances of man-made nuclear graphite.
4. Conclusions
Results for the precise measurements of the changes in macroscopic dimension and lattice parameter due to isothermal and isochronal annealing up to 1673 K for two kinds of low dose neutron-irradiated nuclear graphite (1.38 × 10²³ n/m2 (En > 1 MeV) at 473 K), both isotropic graphite named as IG-110U and ETP-10, were summarized as follows.
The recovery processes of the neutron-irradiated IG-110U and ETP-10 specimens by isothermal and isochronal annealing from room temperature up to 1673 K were divided into two parts. The Part I was from room temperature to 773 K for IG-110U and 1023 K for ETP-10, in which part macroscopic length, lattice parameters and unit cell volume recovered to their pre-irradiation values before neutron irradiation. In the recovery process of the Part II, i.e. higher temperature ranges than those of the Part I, the lattice parameters and unit cell volume were mostly constant. On the other hand, macroscopic volume continuously shrank in the case of ETP-10 specimen up to 1673 K, and up to 1173 K for the IG-110U specimen. The latter specimen showed slight volume swelling over the onset of turnaround at annealing temperature of 1173 K.
From room temperature to 773 K or 1023 K (Part I), the recovery process exhibited two stages and the shrinkage became faster at higher temperature range. The Ea values were determined to be ~0.22 eV and ~0.57 eV at 523–673 K and 673–773 K, respectively, for the IG-110U specimen; ~0.13 eV and ~2.59 eV at 523–923 K and 923–1023 K, respectively, for the ETP-10 specimen.
During the recovery process from 773 K or 1023 K to 1673 K (Part II), the changes in macroscopic volume can be possibly attributed to the change in morphology, such as pores and cracks.
General feature of recovery of the present specimens showed similar process with one order of magnitude higher-dose irradiated specimens (1.92 × 1024 n/m2 (En > 1 MeV) at 473 K) from room temperature up to 1673 K. Degree of changes induced by neutron irradiation is larger for the higher dose specimens. Compare higher dose case and lower dose case, each stage with similar activation energy shifted to higher annealing temperature ranges for the higher dose specimens, commonly for the IG-110U and ETP-10 specimens.
Acknowledgments
The authors are grateful to the China National Science and Technology Major Project for its support [grant number ZX06901]. One of the authors (Yuhao Jin) is also grateful to the Tokyo Institute of Technology – Tsinghua University Joint Program and Tsinghua Fudaoyuan Research Fund.
Disclosure statement
No potential conflict of interest was reported by the authors.
Additional information
Funding
Related Research Data
References
- Sumita J, Shimazaki Y, Shibata T. Investigation on structural integrity of graphite component during high temperature 950°C continuous operation of HTTR. J Nucl Sci Technol. 2014;51:1364–1372.
- Shibata T, Kunimoto E, Eto M, et al. Interpolation and extrapolation method to analyze irradiation-induced dimensional change data of graphite for design of core components in very high temperature reactor (VHTR). J Nucl Sci Technol. 2010;47:591–598.
- Takatsu H, Ando T, Miyamoto M, et al. Present knowledge about the materials behavior in JT-60. J Nucl Mater. 1988;155–157:27–40.
- Kelly BT. Physics of graphite. London: Applied Science Publishers; 1981.
- Goggins PR, Hensen RW, Perks AJ, et al. Dimensional changes in the irradiated graphite lattice. Carbon. 1964;1:189–200.
- Kelly B. The theory of irradiation damage in graphite. Carbon. 1977;15:117–127.
- Burchell TD, Snead LL. The effect of neutron irradiation damage on the properties of grade NBG-10 graphite. J Nucl Mater. 2007;371(1–3):18–27.
- Burchell TD. Radiation effects in graphite and carbon-based materials. MRS Bull. 1997;XXII:29–35.
- Banhart F. Irradiation effects in carbon nanostructures. Rep Prog Phys. 1999;62:1181–1221.
- Rh T, Mi H. Radiation defects in graphite. Philos Mag. 2007;87:4797–4846.
- Snead LL, Burchell TD, Katoh Y. Swelling of nuclear graphite and high quality carbon fiber composite under very high irradiation temperature. J Nucl Mater. 2008;381:55–61.
- Karthik C, Kane J, Butt DP, et al. Neutron irradiation induced microstructural changes in NBG-18 and IG-110 nuclear graphites. Carbon. 2015;86:124–131.
- Burchell TD, Pappano PJ, Strizak JP. A study of the annealing behavior of neutron irradiated graphite. Carbon. 2011;49:3–10.
- Thrower PA, Mayer RM. Point defects and self-diffusion in graphite. Phys Stat Solidi A. 1978;47(11):11–37.
- Jin YH, Yoshida K, Li ZC, et al. Precision dilatometer analysis of neutron-irradiated nuclear graphite recovery process up to 1673 K. J Nucl Sci Tech. 2017;54(4):424–431.
- Tanabe T, Maruyama T, Iseki M, et al. Radiation damage of graphite: degradation of material parameters and defect structures. Fusion Eng Des. 1995;29:428–434.
- Maruyama T, Harayama M. Neutron irradiation effect on the thermal conductivity and dimensional change of graphite materials. J Nucl Mater. 1992;195:44–50.
- Maruyama T. Neutron irradiation effect on the dimensional change of graphite materials. OECD NEA 2004; No. 5309:95–106.
- Lasithiotakis M, Marsden B, Marrow J, et al. Application of an independent parallel reactions model on the annealing kinetics to irradiated graphite waste. J Nucl Mater. 2008;381:83–91.
- Lasithiotakis M, Marsden BJ, Marrow TJ. Application of an independent parallel reactions model on the annealing kinetics of BEPO irradiated graphite. J Nucl Mater. 2012;427:95–109.
- Yamazaki S, Yoshida K, Yano T. Comparative experimental study on recovery behavior of point defects in neutron-irradiated SiC. J Nucl Mater. 2011;417:425–429.
- Kelly BT. The behavior of graphite under neutron irradiation. J Vac Sci Technol A. 1986;4:1171–1178.
- Lehtinen PO, As F, Ayuela A, et al. Magnetic properties and diffusion of adatoms on a graphene sheet. Phys Rev Lett. 2003;91:017202.
- Burchell TD, Eatherly WP. The effects of radiation damage on the properties of GraphNOL N3M. J Nucl Mater. 1991;179:205–208.
- Kelly BT, Martin WH, Price AM, et al. The annealing of irradiation damage in graphite. J Nucl Mater. 1966;20(2):195–209.