
ABSTRACT
In order to validate MVP-II, Haut Taux de Combustion (HTC) experiments were analyzed using a code with relatively new nuclear data libraries, JENDL-4.0, ENDF/B-VII.1, and JEFF-3.2. The effective neutron multiplication factor keff values were obtained through analyses of all phases of the HTC experiments. Consequently, the keff biases evaluated for each nuclear data library were within 300 pcm. Additionally, microscopic production and capture reaction rates of major actinide isotopes were analyzed to substantiate differences among the libraries for a representative case of Phase 1 of the HTC experiments. The analysis showed that microscopic cross sections of 238Pu and 241Am in JEFF-3.2 were somewhat large compared to those of ENDF/B-VII.1 and JENDL-4.0 for the representative case of Phase 1.
KEYWORDS:
1. Introduction
In the 1980s, a series of the French Haut Taux de Combustion (HTC) critical experiments [Citation1] was conducted at the Apparatus B experimental facility in Valduc with the support of the IRSN and AREVA NC to provide a basis for validation of actinide only burnup credit calculations. In the past, US NRC published a report regarding evaluation using HTC critical experiment data [Citation2]. Here, the applicability of the HTC experiments for burnup credit calculations was confirmed by the sensitivity/uncertainty analysis using the SCALE-5.1 code system [Citation3] using both ENDF/B-V and ENDF/B-VI 238 group cross sections at Oak Ridge National Laboratory and hence, US NRC also recommended the HTC critical experiment data for code validation [Citation4].
A continuous-energy Monte Carlo code MVP-II [Citation5] with JENDL-4.0 [Citation6] has been validated as a tool for criticality safety analysis. Historically, criticality safety analyses for storage, transport, and disposal of spent nuclear fuel were conducted assuming isotopic compositions of unirradiated fuel (i.e. fresh fuel) and the MVP-II with JENDL-4.0 was mainly validated against fresh fuel experiments. When it comes to criticality safety analyses using burnup credit, the MVP-II with JENDL-4.0 should be validated using experimental data that are significantly more applicable to the validation of burnup credit calculation.
In this study, validation of the MVP-II with JENDL-4.0 was carried out with the HTC critical experiment data [Citation1]. In addition, ENDF/B-VII.1 [Citation7] and JEFF-3.2 [Citation8] that were latest recommended evaluated nuclear data files for use in criticality safety analyses were used in order to obtain features of the libraries. As a comprehensive verification of the MVP-II, the HTC critical experiment data were also calculated by SCALE-6.2 [Citation9] with continuous ENDF/B-VII.1 library that was widely used for licensing evaluations.
Since HTC fuel rod contains major actinide isotopes important in burnup credit calculation, microscopic production and capture reaction rates of actinide isotopes were analyzed to substantiate differences between libraries for a representative case of Phase 1.
2. HTC critical experiment
The HTC critical experiments were categorized into four phases to represent fuel and neutron interaction characteristics applicable to fuel handling and rod storage, dissolution in a reprocessing plant, a transportation cask, and pool storage in a Pressurized Water Reactor (PWR) [Citation1]. The HTC fuel rods were specifically manufactured to simulate the compositions of typical pressurized water reactor UO2 spent fuel initially enriched to 4.5 wt% 235U and burned to 37.5 GWd/MT. The HTC rods consisted of 1-cm-long pellets contained within a Zircaloy-4 cladding and stuck together by means of a stainless steel spring. The rod diameter corresponds to that of an industrial fuel rod. The fuel stack length was adjusted to the dimensions of the experimental tank, which was 90 cm. The rods were held in place by upper and lower grids placed in a rectangular tank.
2.1. Single array of rods in clean/poisoned water (Phases 1 and 2)
Phase 1 included 18 experiments, which were designed for fuel handling and rod storage. Each configuration involved a single square-pitched array of the HTC rods immersed in clean water. Here, the square pitch varied from 1.3 to 2.3 cm according to test cases. The experimental setup for a typical configuration is depicted in . Phase 2 simulated the conditions of the dissolution process in a reprocessing plant and included 41 configurations similar to those of Phase 1, except that the moderator and reflector contained either boron (21 configuration) or gadolinium (20 configuration) in solution with various concentrations: from 0 to 0.6 g/l for boron and from 0 to 0.2 g/l for gadolinium. Here, the square pitch in both the solutions varied from 1.3 to 1.9 cm.
Figure 1. Experimental setups for HTC critical experiment series: Phases 1 and 2 (upper), Phase 3 (center), and Phase 4 (bottom).
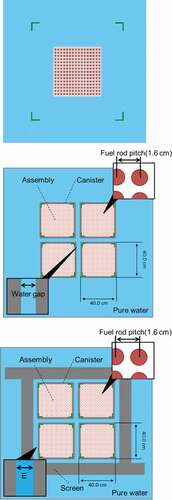
2.2. Four arrays of rods in clean water with absorbing side panels (Phase 3)
Phase 3 included 26 configurations with a 2 × 2 array of fuel assemblies, each of which was arranged in a 25 × 25 square lattice with a pitch of 1.6 cm. Each array was placed in a basket as shown in . In some cases, the arrays were surrounded by either borated steel or Boral or cadmium canisters. The spacing between the assemblies varied from 0 to 14.5 cm, depending on the canister type. The configurations were moderated and reflected by clean water.
2.3. Four arrays of rods in clean water with absorbing side panels and shielding (Phase 4)
Phase 4 included 71 cases similar to the Phase 3 configurations except for the fact that shields were surrounding the 2 × 2 fuel assembly array as shown in . This series of experiments is categorized into two parts depending on the shield type: lead and steel screens. For each category, different types of canisters were used, and the water gap between assemblies and the spacing between screens and the outer surfaces of the 2 × 2 fuel assembly array varied. Lead and steel screens have 33 and 38 configurations, respectively.
3. Calculation of keff using MVP-II and SCALE-6.2
For each phase of the experimental programs, detailed descriptions of the experiments are given in the HTC reports produced by IRSN [Citation1]. The reports are written in a format similar to that used in the International Handbook of Evaluated Criticality Safety Benchmark Experiments [Citation10]. Using these reports, detailed models of the structures of each experiment were prepared for the calculations. As for the conditions, the number of neutrons per generation was set to 4000, and the number of generations was set to 250, the first 50 of which were omitted from tally estimations. The statistical error (standard deviation) of each calculation is in the order of tens of pcm. From the viewpoint of nuclear data libraries, calculated keff values are discussed in the following subsections. Furthermore, as supplementary verification for the keff values using the MVP-II with the libraries, the SCALE-6.2 with ENDF/B-VII.1 also calculated keff values for all phases.
3.1. Calculation results using MVP-II with the libraries
The calculated keff values using MVP-II with the major libraries are described in the following subsections. For each phase of the experiments, averaged keff values and standard deviations were listed from with the SCALE-6.2 results for comparison.
Table 1. Averaged keff values and standard deviations for each phase
3.1.1. Phase 1
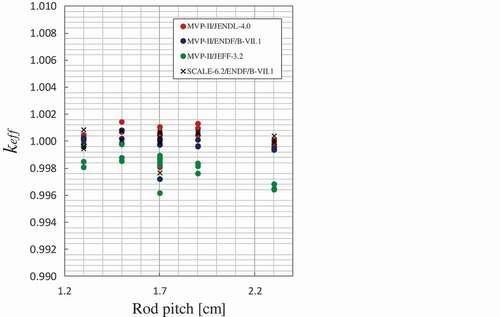
The averaged keff values calculated using the MVP-II with JENDL-4.0 and ENDF/B-VII.1 were in good agreement with the experimental data, with discrepancies less than 50 pcm as shown in . The MVP-II with JEFF-3.2 slightly underestimated the averaged keff value. The calculated keff values as a function of fuel rod pitch are described in with the SCALE-6.2 results for comparison. The calculated keff values using the libraries were not correlated with fuel rod pitch which corresponds to the neutron spectrum. And the consistent underestimation of keff values in JEFF-3.2 should be recognized in criticality analysis.
Figure 2. Calculated keff values for Phase 1 as a function of fuel rod pitch.
3.1.2. Phase 2
For the experiments with gadolinium solution, the averaged keff values using ENDF/B-VII.1 were in good agreement with the experimental data, with discrepancies less than 50 pcm as shown in . The averaged keff values using JEFF-3.2 were slightly underestimated. Those deviations of the averaged keff values became larger than those of Phase 1. The calculated keff values as a function of fuel rod pitch and gadolinium concentration were described in and with the SCALE-6.2 results for comparison. The keff values were correlated with these parameters. In the wider fuel rod pitch, where the neutron spectrum became softer, the keff values were slightly overestimated. As the concentration becomes high, the keff values gradually declined.
Figure 3. Calculated keff values for Phase 2 as a function of fuel rod pitch: Gadolinium (upper) and boron (bottom).
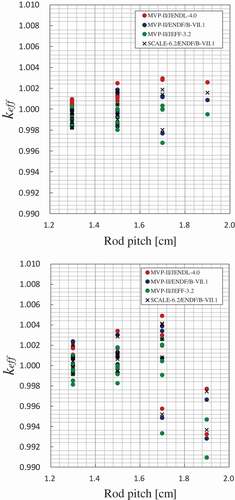
Figure 4. Calculated keff values for Phase 2 as a function of concentration: Gadolinium (upper) and boron (bottom).
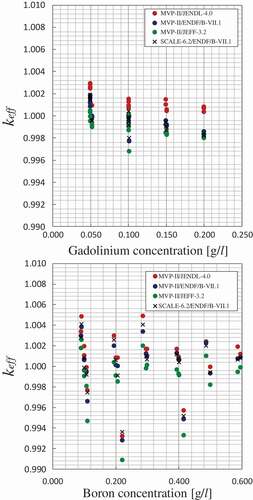
For the experiments with boron solution, the averaged keff values using JENDL-4.0 and ENDF/B-VII.1 were in good agreement with the experimental data, with discrepancies less than 100 pcm as shown in . The deviation of calculated keff values for each experiment, however, was considerably large and keff plots were scattered with varying boron concentration and fuel rod pitch, and no meaningful tendency was observed with the two parameters as shown in and . Apparently, this might be caused by experimental uncertainties regarding boron concentration measurements [Citation1,Citation2]. Accordingly, the keff values sensitive to the neutron spectrum and concentration may be a concern in criticality analysis.
3.1.3. Phase 3
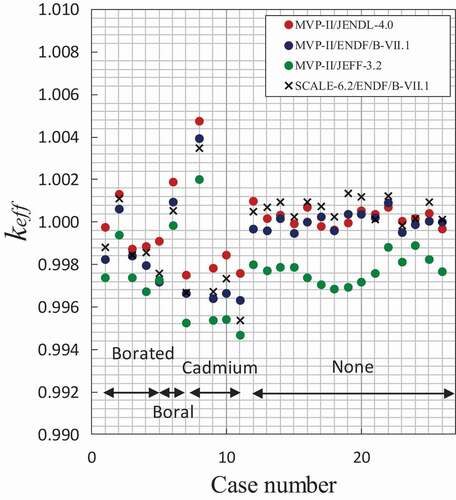
The averaged keff values using JENDL-4.0 and ENDF/B-VII.1 were in good agreement with the experimental data, with discrepancies less than 100 pcm as shown in . The MVP-II with JEFF-3.2 slightly underestimated the averaged keff values. The calculated keff values were described in with the SCALE-6.2 results for comparison. As shown in , the calculated keff values depended on the canister type surrounding each array compared to the results of cases without a canister. The keff values for configurations with borated stainless steel and cadmium canisters especially indicated an underestimation trend, whereas the calculated keff values for the cases without a canister were similar to those of Phase 1. It was seen that the keff values in the configurations corresponding to zero-spacing between canisters (cases 2, 6, and 8) showed erratic behaviors. This tendency suggests some water-filled space between the canisters due to uncertainties in canister positions, which was not taken into account in the calculations. Accordingly, it should be recognized that the calculated keff values result in underestimation through the libraries for configurations containing boron and cadmium.
Figure 5. Calculated keff values for Phase 3 as a function of case number.
3.1.4. Phase 4
The calculated keff values for Phase 4 were described in with the SCALE-6.2 results for comparison. In the lead screen cases (upper figure), the MVP-II with JENDL-4.0 overestimated keff values as shown in and . Hence, we might discuss further effects as to lead cross section in JENDL-4.0, and the accuracy of lead cross section of JENDL-4.0 should be reviewed as necessary in criticality analysis. On the other hand, the averaged keff value using ENDF/B-VII.1 was in good agreement with the experimental data with discrepancies less than 50 pcm.
Figure 6. Calculated keff values for Phase 4 as a function of case number: Lead (upper) and Steel (bottom).
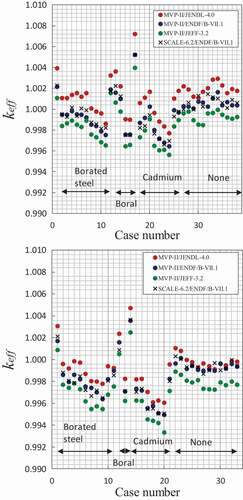
For the steel screen cases, the averaged keff value using JENDL-4.0 was in good agreement with the experimental data with discrepancies less than 100 pcm as shown in and . In contrast, the averaged keff value using either ENDF/B-VII.1 or JEFF-3.2 had slight underestimation against the experimental data.
3.2. Discussion for validation results
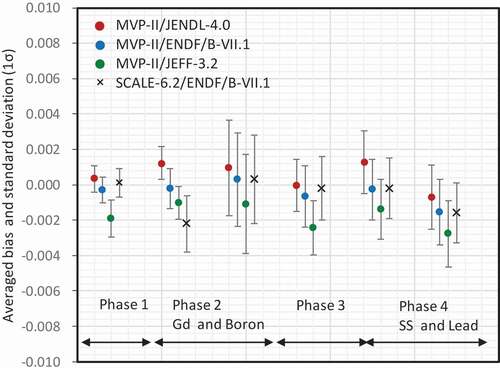
The averaged keff values and standard deviations (1σ) in Phases 1–4 were given in . Averaged keff biases using the MVP-II with the libraries were within 300 pcm. These biases were closely comparable to those of the SCALE-6.2 with ENDF/B-VII.1 and showed similar trends as a function of the parameters as shown in –. Therefore, the MVP-II results were comparable to those with SCALE-6.2.
Figure 7. Averaged biases and standard deviations (1σ) as a function of phase.
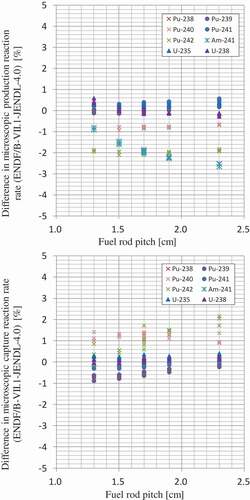
As further discussion, microscopic production and capture reaction rates for actinide isotopes were analyzed to substantiate differences between the libraries for a representative case of Phase 1. For Phase 1, the reaction rates calculated by the MVP-II with JENDL-4.0 are shown in . For ENDF/B-II.1 and JEFF-3.2, the differences from the values of JENDL-4.0 are also shown in and . On production reaction rates in JEFF-3.2, the 238Pu reaction rates were slightly larger than those of JENDL-4.0 and the differences were reduced with the fuel rod pitch as shown in . The capture reaction rates of 238Pu and 241Am, regardless of fuel rod pitch, showed 35% and 10% higher values, respectively, compared to those of JENDL-4.0 as shown in . Here, these actinide contributions to keff are relatively small. These higher capture reaction rates in JEFF-3.2 were also addressed in the past study [Citation11,Citation12]. The study described that the thermal and epithermal capture cross section of 241Am and 238Pu would be relatively larger in JEFF-3.2 in comparison with the other libraries. On the other hand, the differences in production and capture reaction rates between ENDF/B-VII.1 and JENDL-4.0 are less than 2% as shown in .
Figure 8. Microscopic production and capture reaction rates of JENDL-4.0 as a function of fuel rod pitch in Phase 1.
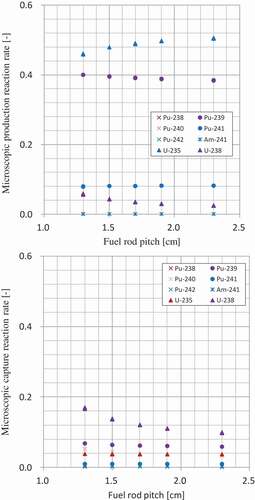
Figure 9. Difference of microscopic reaction rates as a function of fuel rod pitch in Phase 1. (JEFF-3.2–JENDL-4.0).
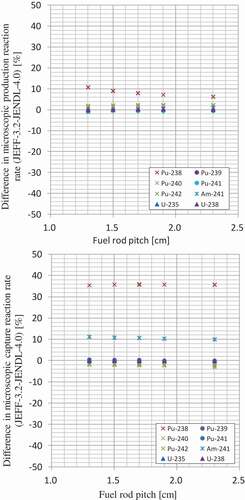
Figure 10. Difference of microscopic reaction rates as a function of fuel rod pitch in Phase 1 (ENDF/B-VII.1–JENDL-4.0).
4. Summary and conclusion
The HTC critical experiment data were analyzed by the MVP-II with the libraries and averaged keff values through phases were within 150 pcm in JENDL-4.0 and ENDF/B-VII.1 and were within 300 pcm in JEFF-3.2. In comparison with the SCALE-6.2, it was realized that the biases of averaged keff values in the MVP-II with JENDL-4.0 were comparable to those of SCALE 6.2. Hence, the MVP-II with JENDL-4.0 was validated using the HTC critical experiment data for the burnup credit criticality calculations.
Microscopic production and capture reaction rates for actinide isotopes were analyzed for a representative case of Phase 1. It indicated that 238Pu and 241Am microscopic capture reaction rates in JEFF-3.2 were ~20% larger than those of JENDL-4.0 for HTC experiment data. On the other hand, the differences in microscopic reaction rates between JENDL-4.0 and ENDF/B-VII.1 were within 2%. Here, since 238Pu cross section was modified in the update from JEFF-3.2 to JEFF-3.3, HTC experimental data need to be also analyzed by MVP-II with JEFF-3.3.
Acknowledgments
The author acknowledges T. Sakai, T. Nakajima, T. Yamamoto, and F. Nagase at Secretariat of Nuclear Regulation Authority for their very efficient and valuable reviews of the paper. The author also acknowledges numerous partners who have contributed to the code validation.
References
- Fernex F, Ivanova T, Bernard F, et al. HTC experimental program: validation and calculational analysis. Nucl Sci Eng. 2009;162:1–24.
- Mueller E, Elam R, Fox B Evaluation of the French Haut Taux de Combustion (HTC) critical experiment data. U.S.: NRC; 2008, (NUREG/CR-6979).
- SCALE: a modular code system for performing standardized computer analyses for licensing evaluations. Tennessee (The U.S.): ORNL; 2005, (ORNL/TM-2005/39).
- U.S. NRC. Interim staff guidance – 8 Revision 3, Division of spent fuel storage and transportation. Washington DC, U.S.: NRC; 2012.
- Nagaya Y, Okumura K, Mori T, et al. MVP/GMVP II: general purpose monte carlo codes for neutron and photon transport calculations based on continuous energy and multigroup methods. Tokai-mura (Japan): Japan Atomic Energy Agency; 2005, (JAERI-1348) [in Japanese, .
- Shibata K, Iwamoto O, Nakagawa T, et al. JENDL-4.0: a new library for nuclear science and engineering. J Nucl Sci Technol. 2011;48:1–30.
- Chadwick M, Herman M, Obloˇzinsky P, et al. ENDF/B-VII.1 nuclear data for science and technology: cross sections, covariances, fission product yields and decay data. Nucl Data Sheets. 2011;112(12):2887–2996.
- The JEFF team. JEFF-3.2: evaluated nuclear data library. 2014. Available from: http://www.oecd-nea.org/dbdata/jeff/
- Scale: a comprehensive modeling and simulation suite for nuclear safety analysis and design. Tennessee, U.S.: ORNL; 2009, (ORNL/TM-2005/39).
- NEA Nuclear Science Committee, International handbook of evaluated criticality safety benchmark experiments. Paris (France): OECD/NEA; 2006, (NEA/NSC/DOC (95)03).
- Yamamoto T, Sakai T. Feedback on neutron capture cross sections of 238Pu and 241Am from analysis of measured isotopic compositions of irradiated LWR fuels and MOX core physics experiments. J Nucl Sci Technol. 2016;53:1235–1242.
- Nakajima K, Sano T, Yamamoto T, Validation of 241Am capture cross section through integral test using criticality data of light-water moderated MOX cores. Proceeding of the Fourth International Symposium on Innovative Nuclear Energy Systems, INES-4, Research Laboratory for Nuclear Reactors, Tokyo Institute of Technology; 2015;71:237–243.