
 ?Mathematical formulae have been encoded as MathML and are displayed in this HTML version using MathJax in order to improve their display. Uncheck the box to turn MathJax off. This feature requires Javascript. Click on a formula to zoom.
ABSTRACT
Solid-moderated cores of the Kyoto University Critical Assembly (KUCA) have an emergency shutdown system to avoid any reactivity-initiated accidents. When a reactor protection system of KUCA detects some abnormal conditions, the emergency system withdraws downward several fuel and reflector assemblies assigned as a central fuel loading from the core in 10 and several seconds. The withdrawal of the fuel loading inserts a very large negative reactivity into the core. The negative reactivity has been measured by the integral count technique; however, the application of the integral count technique to this measurement must have been impossible in principle. The integral count technique assumes an instantaneous insertion of a large negative reactivity but the assumption must fail for this measurement. An accurate measurement of the negative reactivity is of extreme importance from the viewpoint of reactor safety. In this study, the least-squares inverse kinetics method was employed to determine the negative reactivity from time-sequence counts data of a neutron counter. The negative reactivity determined by this method was in good agreement with that calculated by the continuous-energy Monte Carlo code MVP (version 3) with the nuclear data library JENDL-4.0.
1. Introduction
The Kyoto University Critical Assembly (KUCA) [Citation1] comprises two solid-moderated thermal cores designated as A and B, and one water-moderated thermal core designated as C. In the A-core, a pulsed 14MeV neutron source and a pulsed spallation neutron source [Citation2,Citation3] are available, by coupling with a conventional Cockcroft-Walton-type accelerator [Citation4] and the fixed-field alternating gradient (FFAG) accelerator [Citation5], respectively. Besides reactor scram system instantaneously dropping safety (shutdown) rods, these solid-moderated A- and B-cores have an emergency shutdown system to avoid any reactivity-initiated accidents. When a reactor protection system of KUCA detects some abnormal conditions such as a short period, the emergency system withdraws downward several fuel and reflector assemblies assigned as a central fuel loading (CFL) from the core in 10 and several seconds. The withdrawal of the fuel loading inserts a very large negative reactivity into the core.
The negative reactivity has been measured invariably by the integral count technique [Citation6], which has been frequently employed to determine a large negative reactivity from rod drop or source jerk experiment. However, we were sure that the application of the integral count technique to this negative reactivity measurement must have been impossible in principle. This is because the fuel loading is continuously withdrawn from the core and the complete withdrawal requires over 10 seconds, where the prompt drop is expected to be definitely never observed. The integral count technique assumes an instantaneous insertion of a large negative reactivity or an instantaneous jerk of an external neutron source, and determines a subcritical reactivity from a prompt drop of neutron flux caused by the above operations. For the present measurement, the above assumption must fail.
The inverse kinetics method has been also employed as a powerful technique for positive and negative reactivity measurement, however, the rapid withdrawal of the fuel loading suddenly reduces the count rate of a neutron counter and consequently the method must suffer from a large statistical scatter of the reactivity derived. An accurate measurement of the very large negative reactivity is of extreme importance from the viewpoint of reactor safety.
In this study, each withdrawal experiment of the central fuel loading for a highly enriched uranium A-core with polyethylene reflector and another low-enriched uranium B-core with graphite reflector was carried out. Not only the conventional integral count technique but also the least-squares inverse kinetics method (LSIKM) [Citation7–Citation9] were employed to determine the negative reactivity from time-sequence counts data of a neutron counter. The main objective of this study is to demonstrate an applicability of the LSIKM to severe measurement of the very large negative reactivity. The determined negative reactivities were compared with those calculated by the continuous-energy Monte Carlo code MVP (version 3) [Citation10]. In this report, the reactor configuration and the experimental setups are described in Sec. 2, the data analysis method in Sec. 3, and the discussion on the results in Sec. 4 prior to conclusions summarized in Sec. 5.
2. Reactor configuration and experimental setups
2.1. Description of KUCA facility
2.1.1. Configuration of A-core
shows a side view of a fuel assembly referred to as 1/8″P60EUEU. Fuel and moderator plates of the assembly were set in a 1.5 mm-thick aluminum sheath and the cross-section of these plates within the assembly was the square of 2″ (50.8 mm). The fuel assembly was consisted of 60 unit cells. The unit cell was composed of two (1/16″ thick) highly enriched uranium plates with Al cladding and one (1/8″ thick) polyethylene plate. The active axial length of the fuel assembly, namely 60 unit cells, was about 38 cm. Adjacent to the both axial sides of the active region of each fuel assembly, about 55 cm upper and 56 cm lower polyethylene reflectors were attached, respectively. An A-core configuration employed in this study is shown in . The twenty-five above fuel assemblies (mark ‘F’ attached) were loaded on locations (I-M,13–17) of the grid matrix shown in this figure, to constitute the reactor core. The fuel region was surrounded with many polyethylene-reflector assemblies.
Figure 1. Description of 1/8″P60EUEU fuel assembly
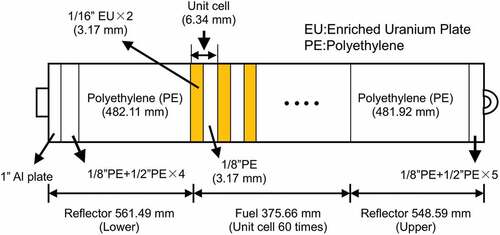
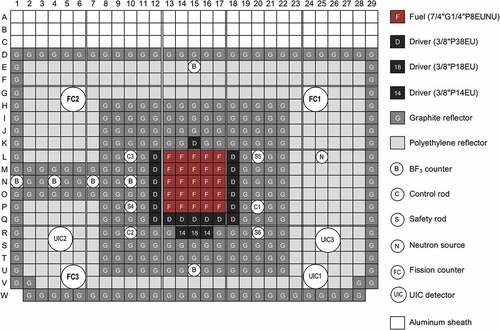
Figure 2. Top view of A-core configuration and neutron detector location
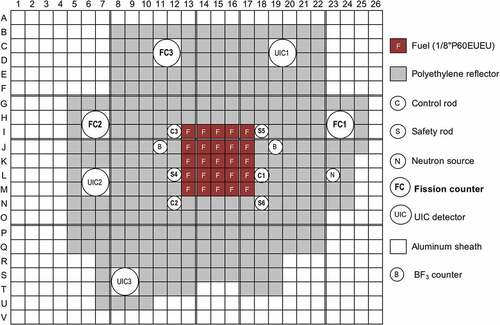
KUCA has six control rods, where three are assigned as safety rods for reactor scram and are referred to as S4 on location (L,12), S5 on (I,18) and S6 on (N,18), respectively. Others are rods for adjustment of reactivity and are referred to as C1 on (L,18), C2 on (N,12) and C3 on (I,12), respectively. To the central fuel loading withdrawn by the emergency system, we assigned three fuel assemblies on locations (I,14–16) and six polyethylene-reflector ones on locations (G-H,14–16) of the grid matrix. A schematic view of the central fuel loading withdrawn downward from the core is shown in . An axial stroke of the withdrawal was about 190 cm and the complete withdrawal required 14.2 sec.
Figure 3. Schematic view of emergency shutdown system
2.1.2. Configuration of B-core
shows a side view of a fuel assembly referred to as 7/4″G1/4″P8EUNU. The fuel assembly was consisted of 8 unit cells. The unit cell was composed of one (1/16″ thick) highly enriched uranium plate, one (1 mm thick) natural uranium plate, three (1/2″ thick) graphite plates, one (1/4″ thick) graphite plate and two (1/8″ thick) polyethylene plates. The active axial length of the fuel assembly was about 43 cm. Adjacent to the both axial sides of the active region of each fuel assembly, about 51 cm upper and 51 cm lower polyethylene reflectors were attached, respectively. An effective uranium enrichment of this fuel assembly was 5.41wt.%. The loadings of only the above low-enriched uranium assembly were expected to make the reactor system subcritical. On this account, several driver fuel assemblies were also loaded to constitute a critical reactor system. shows a side view of the driver fuel assembly referred to as 3/8″P38EU. The fuel assembly was consisted of 38 unit cells. The unit cell was composed of one (1/16″ thick) highly enriched uranium plate and three (1/8″ thick) polyethylene plates. The active length of the driver assembly was about 42 cm. Adjacent to the both axial sides of the active region of each fuel assembly, about 52 cm upper and 51 cm lower polyethylene reflectors were attached, respectively. A B-core configuration employed in this study is shown in . The twenty-five 7/4″G1/4″P8EUNU assemblies (mark ‘F’ attached) were loaded on locations (L-P,13–17) of the grid matrix shown in this figure, to constitute a test region of the core. The 3/8″P38EU driver assemblies (mark ‘D’ attached) were loaded around the test region, to achieve criticality, where the three driver assemblies on locations (R,14–16) had few unit cells to adjust an excess reactivity of the whole core. The two driver assemblies (numeral ‘14ʹ attached) on locations (R,14) and (R,16) had 14 unit cells, while the one driver assembly (numeral ‘18ʹ attached) on locations (R,15) had 18 unit cells. These fuel regions were surrounded with many graphite-reflector (mark ‘G’ attached) and polyethylene-reflector (no mark) assemblies.
Figure 4. Description of 7/4″G1/4″P8EUNU fuel assembly
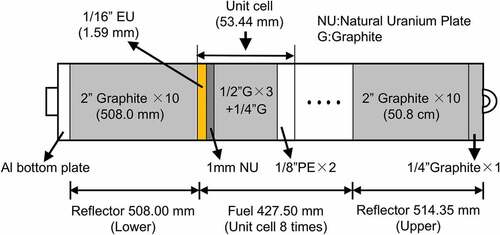
Figure 5. Description of 3/8″ P38EU (driver) fuel assembly
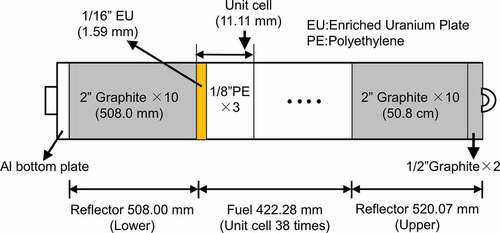
Figure 6. Top view of B-core configuration and neutron detector location
The safety rods S4, S5, and S6 were placed on locations (P,10), (L,20), and (R,20) of the grid matrix, respectively. The control rods C1, C2, and C3 were placed on locations (P,20), (R,10), and (L,10), respectively. To the central fuel loading withdrawn by the emergency system, we assigned one driver fuel assembly on location (K,15), 19 graphite-reflector (K,13–14), (K,16–17), (H-J,13–17) and five polyethylene-reflector (G,13–17) assemblies. The axial stroke of this withdrawal was same as that of the A-core and the complete withdrawal required 12.7 sec.
2.2. Nuclear instrumentation system and experimental conditions
In KUCA, three fission counters (2″ dia.) were employed as reactor startup channel for reactor operation and three uncompensated ionization chambers (UIC1~ UIC3) were assigned as linear power, logarithmic power and safety power channel, respectively. These fission counters were also used for the present experiment. In the A-core, the fission counters placed on locations (H-I,23–24), (H-I,6–7), and (C-D,11–12) are referred to as FC1, FC2, and FC3, respectively, as shown in . In the B core, the fission counters placed on locations (G-H,24–25), (G-H,5–6), and (U-V,5–6) are referred to as FC1, FC2, and FC3, respectively, as shown in . The present nuclear instrumentation system for the fission counters consisted of conventional detector bias-supply, pre-amplifier, spectroscopy amplifier and discriminator modules. Finally, signal pulses from the three fission counters were fed to a multi-channel scaler (MCS) to record a neutron decay behavior.
The experimental procedure is as follows. First, an Am-Be neutron source for reactor startup was inserted on the grid indicated by location (L,23) and (L,25) of the grid matrix shown in and , respectively. Then, three safety rods (S4,S5,S6) and two control rods (C1,C2) were completely withdrawn and the neutron source was taken out of the core. After that, the criticality of each core was adjusted by changing the axial position of control rod C3. The critical positions of the A- and the B-cores were about 679 mm and 682 mm high from a lower limit position, respectively. After confirming the criticality, an acquisition of time-sequence counts data from the fission counters was initiated. The time-sequence counts data at the critical state were recorded over several minutes and then a withdrawal of the central fuel loading was initiated, where gate time width Δt of the MCS was set to 2 ms and 1 ms for the A- and the B-core measurement, respectively. When the fission counters had almost no count, the data acquisition was terminated. Since the fission counters were placed far from fuel region, the background counts originated from inherent neutron source [Citation11–Citation13] could be hardly observed.
3. Data analysis method
In this section, our model [Citation14,Citation15] for the least-squares inverse kinetics method (LSIKM) [Citation7] is carefully described. Assuming the zero-power and one-point kinetics model, the time-dependent neutron behavior of a reactor system with a neutron source of strength s can be described as
where n(t) is number of neutrons, ck(t) number of kth-group precursors in a whole reactor system. Other notations are conventional. Here we define ε, λf and Δt as detection efficiency, fission probability of a neutron per unit time and gate time width, respectively. Multiplying the both sides of EquationEquations (1)(1)
(1) and Equation(2)
(2)
(2) by the product (ελf Δt), these equations can be rewritten as
Where
As the above N(t), time-sequence counts data accumulated during a gate time width Δt of the MCS can be employed to determine the reactivity ρ(t) of the reactor system. EquationEquations (5)(5)
(5) and Equation(6)
(6)
(6) indicate that N(t) and Ck(t) have a unit of neutron count. Usually, the term of the left-hand side of EquationEquation (3)
(3)
(3) is so small relative to the other terms that it can be neglected. This approximation leads to the following equation.
Where
The above equation is a famous formula for the conventional inverse kinetics method. The time-dependent Ck(t) can be obtained by solving numerically EquationEquation (4)(4)
(4) . In this study, the implicit time-integration method was applied to this initial problem [Citation9].
The least-squares inverse kinetics method was originally proposed by Hoogenboom and Van der Sluijs [Citation7] and then various models for the least-squares fitting were examined numerically [Citation8] and experimentally [Citation14] to confirm a robustness and an accuracy of these models and to find out a most accurate and stable model. Consequently, the following equation model has invariably brought the most accurate result [Citation8,Citation14]
In this study, we employed the above equation to determine the negative reactivity from time-sequence counts data. Mathematically the above equation may be similar to EquationEquation (8)(8)
(8) but it should be noted that the reactivity ρ is assumed to be constant. In this LSIKM, the time-sequence Q(t) and N(t) data are plotted on the X-Y coordinate and then the linear least-squares fit of EquationEquation (10)
(10)
(10) to the plotted data is done to determine the reactivity ρ of a subcritical system from a gradient of the fitted line and the effective source strength S from a intercept of the line. When a reactor system has no neutron source, EquationEquation (10)
(10)
(10) can be reduced to
The delayed neutron data and the generation time of the present reactor systems are shown in . The total effective delayed neutron fraction β and the generation time Λ were calculated by the continuous-energy Monte Carlo code MVP (version 3) [Citation10] with the nuclear data library JENDL-4.0 [Citation16], where 30,000 (history/batch) × 10,000 (batch) were taken. The decay constant of each delayed neutron group was referred from 235U thermal-fission delayed-neutron data published by Keepin et al. [Citation17]. The effective delayed neutron fraction βk of kth delayed neutron group was obtained by multiplying the total effective delayed neutron fraction β and a relative abundance ak of kth delayed group referred from the Keepin’s data.
Table 1. Delayed neutron data and generation time of the present reactor systems
4. Results and discussion
4.1. Time-sequence data acquired
shows the time-sequence N(t) and Q(t) data obtained from fission counter FC1, in withdrawing the central fuel loading (CFL) of the A-core. The unit of vertical axis is counts [c] per gate time width Δt. The time-sequence N(t) suddenly decreases with the withdrawal and then asymptotically tends to zero. However, a certain prompt drop induced by an initiation of the withdrawal can be hardly observed. This feature suggests that the integral count technique, which derives a reactivity inserted instantaneously from a prompt drop observed, may be inapplicable. The asymptotical tendency of N(t) to zero indicates that the fission counter must have no background count originated from inherent neutron source and consequently EquationEquation (11)(11)
(11) is applicable in place of EquationEquation (10)
(10)
(10) . The statistical fluctuation of Q(t) defined by EquationEquation (9)
(9)
(9) is slight, compared with that of N(t). This is because the delayed-neutron emission quantity Q(t) is an integral quantity of N(t) over a passing time.
Figure 7. N and Q decay behavior with withdrawal of central fuel loading in A-core
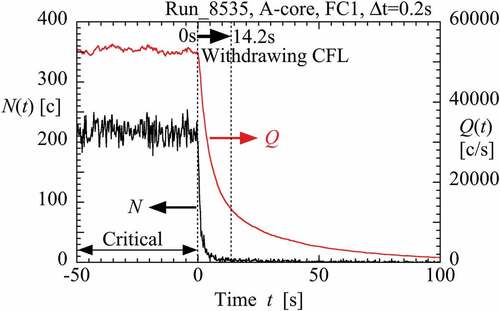
shows the time-sequence N(t) and Q(t) data obtained from fission counter FC3, in withdrawing the CFL of the B core. This apparent behavior of N(t) and Q(t) is the same as that of . Carefully comparing this figure to , however, a ratio of Q(t) to N(t) at critical state in the A-core is about four times larger than that in the B-core. This is because the generation time of the B-core is about four times longer than that of the A-core, as shown in .
Figure 8. N and Q decay behavior with withdrawal of central fuel loading in B-core
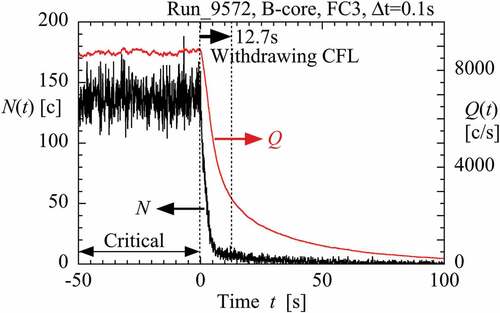
Figure 9. Transient reactivity behavior obtained by conventional inverse kinetics analysis
Figure 10. Plot of variables and fitted line on X-Y coordinate for A-core
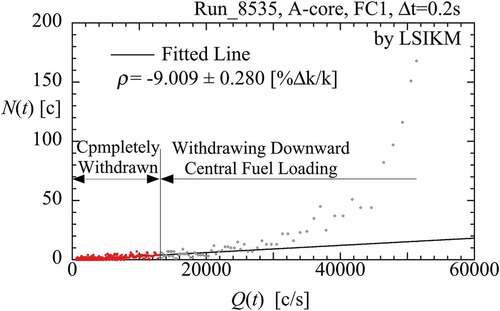
Figure 11. Difference of N between FC1 and FC3 under withdrawing central fuel loading
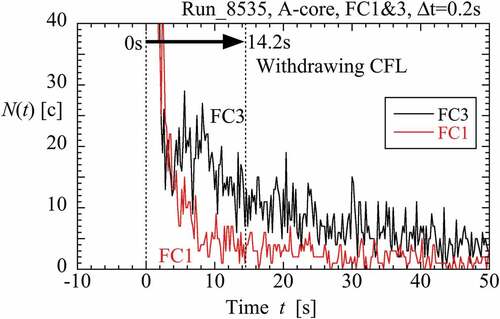
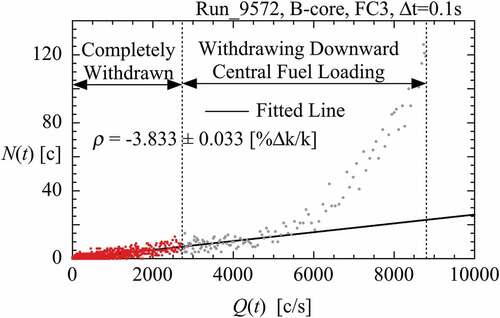
Figure 12. Plot of variables and fitted line on X-Y coordinate for B-core
4.2. Integral count technique
When a control rod is instantaneously dropped into a critical system at t = 0, the integral count technique [Citation6] gives a subcriticality of the perturbed system by the following formula:
The above familiar formula was applied to the present experiment. Prior to a withdrawal operation of the fuel loading, the average count rate represented by N(0) was measured using a conventional counting scaler. Then, the integral count after the operation, which appeared in the denominator of the above equation, was also measured by the scaler. The denominator indicates that the counting time should be infinite. When the fission counters had almost no count, however, the counting was terminated.
shows each subcriticality of the A- and B-cores perturbed by the withdrawal, i.e. each reactivity worth of the fuel loading obtained by the integral count technique. The reactivity worth calculated by the MVP with JENDL-4.0 was included in this table, where the statistical error was one standard deviation ±1σ and number of histories and batches was described in the previous section. In this table, a mark ‘×’ is attached to the reactivity worth derived from a fission counter which looks at the central fuel loading and the fuel assembly region of each core in the same direction, but otherwise another mark ‘○’ is attached. These marks ‘○’ and ‘×’ indicate that the reactivity worth should be adopted as a suitable measurement value or not, respectively. When a local disturbance such as control rod drop is inserted into a reactor core, generally, a neutron counter, which looks at the disturbance and the core in the same direction, suffers from a direct influence of the local disturbance and consequently derives an inaccurate results. In previous rod drop and fuel-loading withdrawal experiments of KUCA, the result derived from the above neutron counter has excluded from measurement results [Citation1,Citation13,Citation18]. Regardless of the above adoption or rejection, the integral count technique fatally underestimates the reactivity worth of the central fuel loading compared with the MVP calculation, as can be seen in .
Table 2. Reactivity worth of central fuel loading obtained by the integral count technique [%▵k/k]
4.3. Inverse kinetics method
shows the transient reactivity behavior obtained by the conventional inverse kinetics analysis from time-sequence data of fission counter FC1, in withdrawing the central fuel loading (CFL) of the A-core, where the last source term of EquationEquation (8)(8)
(8) was neglected. As a trend of the reactivity behavior, the negative reactivity of the reactor core increases with the withdrawal of the fuel loading. However, the inverse kinetics analysis suffers from a large statistical scatter of the reactivity derived. Under a condition of the complete withdrawal, it is absolutely impossible to determine the negative reactivity, i.e. the reactivity worth of the fuel loading. The other inverse kinetics analysis for the B-core also had a large statistical scatter of the derived reactivity and consequently, the reactivity worth could be hardly determined. The inverse kinetics method is useful for reactivity worth measurement for a control rod, where the control rod has relatively less reactivity worth and is more slowly operated. However, this method must be never applicable to the present measurement, where the fuel loading has very large reactivity worth and is rapidly withdrawn.
4.4. Least-squares inverse kinetics method
In , the time-sequence Q(t) and N(t) data obtained from fission counter FC1 in the A-core (i.e. the data of ) are plotted on the X–Y coordinate, where not only the data in a time range (deep red colored) after the completion of withdrawing the fuel loading but also those in another time range (light grey colored) under withdrawing are included. Here, it should be remembered that the LSIKM assumes the subcritical reactivity to be constant. Under withdrawing, the reactivity changes with lowering the fuel loading. Therefore, a least-squares fit of EquationEquation (11)(11)
(11) was done to only the data included in the time range after the completion. This fitted line and the derived reactivity are also shown in . The LSIKM analyses for fission counters FC2 and FC3 were carried out by the same way as the above.
shows the reactivity, i.e. the reactivity worth of the fuel loading determined by the LSIKM. In the A-core, each reactivity worth from FC1 and FC2 agrees with that calculated by the MVP within statistical uncertainty ±1σ. However, another reactivity worth from FC3 is much smaller than those from the other counters. shows a significant difference of N(t) between FC1 and FC3 under withdrawing the fuel loading. As a trend of the counts behavior, N(t) of FC1 monotonously decreases with withdrawing the fuel loading, however, that of FC3 temporarily turns from the decrease to the increase. This is because a large vacancy appears between the counter FC3 and the core region with the withdrawal. The appearance reduces neutronic shielding effect and results in a temporary increase in a number of neutrons arriving at FC3. This local effect specific to FC3 is responsible for the much smaller worth observed above.
Table 3. Reactivity worth of central fuel loading obtained by the least-squares inverse kinetics method [%▵k/k]
In , the time-sequence Q(t) and N(t) data obtained from fission counter FC3 in the B-core (i.e. the data of ) are plotted on the X–Y coordinate. The LSIKM analyses for the B-core were carried out by the same way as the above analyses for the A-core, and the results are also included in . In the B core, a reactivity worth from FC3 agrees with that calculated by the MVP within statistical uncertainty, however, each reactivity worth from FC1 and FC2 is significantly overestimated. These neutron counters, which looks at the fuel loading withdrawn and the core fuel region in the same direction, suffers from a direct influence of the local disturbance. The overestimation originated from the local effects has been frequently experienced in various reactivity measurements of KUCA [Citation1,Citation13,Citation18].
4. Concluding remarks
We carried out each withdrawal experiment of the central fuel loading for a highly enriched uranium A-core with polyethylene reflector and another low-enriched uranium B-core with graphite reflector, to determine the reactivity worth of the fuel loading from time-sequence counts data of a fission counter. The integral count technique fatally underestimated the reactivity worth compared with that calculated by the continuous-energy Monte Carlo code MVP (version 3) with JENDL-4.0. The conventional inverse kinetics method suffered from large statistical scatter of the reactivity derived and consequently, the reactivity worth could be hardly determined. However, the reactivity worth determined by the LSIKM was in good agreement with that calculated by the MVP. This good agreement demonstrates a validity of the MVP code with JENDL-4.0. Quite recently, we reported a series of accurate subcriticality measurements in KUCA [Citation13], where the MVP (version 2) code [Citation19] with JENDL-4.0 was validated. In further subcriticality benchmarks for other reactor than KUCA, the latest MVP code with JENDL-4.0 and the prospective revised nuclear library should be validated.
Acknowledgments
The present work was performed as a joint research program of the KUCA at the Institute for Integrated Radiation and Nuclear Science, Kyoto University.
Disclosure statement
No potential conflict of interest was reported by the authors.
References
- Misawa T, Unesaki H, Pyeon CH. Nuclear reactor physics experiment. Kyoto (Japan): Kyoto University Press; 2010.
- Pyeon CH, Misawa T, Lim JY, et al. First injection of spallation neutrons generated by high-energy protons into the Kyoto University Critical Assembly. J Nucl Sci Technol. 2009;46:1091–1093.
- Pyeon CH, Yamanaka M, Oizumi A, et al. First nuclear transmutation of 237Np and 241Am by accelerator-driven system at Kyoto University Critical Assembly. J Nucl Sci Technol. 2019;56:684–689.
- Ichihara C, Nakamura H, Kobayashi K, et al. [Characteristics of KUCA pulsed neutron generator]. Kumatori (Japan): Kyoto University Research Reactor Institute; 1983. ( (KURRI-TR-240) [in Japanese]).
- Mori Y. Development of FFAG accelerators and their applications for intense secondary particle production. Nucl Instrum Methds Phys Res A. 2006;562:591–595.
- Hogan WS. Negative-reactivity measurements. Nucl Sci Eng. 1960;8:518–522.
- Hoogenboom JE. van der Sluijs AR. Neutron source strength determination for on-line reactivity measurements. Ann Nucl Energy. 1988;15:553–559.
- Tamura S. Signal fluctuation and neutron source in inverse kinetics method for reactivity measurement in the sub-critical domain. J Nucl Sci Technol. 2003;40:153–157.
- Taninaka H, Hashimoto K, Ohsawa T. An extended rod drop method applicable to subcritical reactor system driven by neutron source. J Nucl Sci Technol. 2010;47:351–356.
- Nagaya Y, Okumura K, Sakurai T, et al. MVP/GMVP Version3: General purpose Monte Carlo codes for neutron and photon transport calculations based on continuous energy and multigroup methods. Tokai-mura (Japan): Japan Atomic Energy Research Institute; 2016. (JAEA-Data/Code 2016-018).
- Shiozawa T, Endo T, Yamamoto A, et al. Investigation on subcriticality measurement using inherent neutron source in nuclear fuel. In: Suyama K, Sugawara T, Tada K, et al., editors. Proceedings of the international conference on physics of reactors (PHYSOR 2014); September 28-October 3, 2014; Kyoto, Japan. Tokai-mura (JAPAN): Japan Atomic Energy Agency; 2015. (JAEA-Conf-2014-003 and 2014-003-appendix). DOI: 10.11484/jaea-conf-2014-003.
- Sakon A, Nakajima K, Hohara S, et al. Experimental study of neutron counting in a zero-power reactor driven by a neutron source inherent in highly-enriched uranium fuels. J Nucl Sci Technol. 2019;56:254–259.
- Sakon A, Sano T, Hohara S, et al. An impact of inherent neutron source on subcriticality measurement in a highly enriched uranium core of Kyoto University Critical Assembly. J Nucl Sci Technol. 2019. Published online. DOI:10.1080/00223131.2019.1624652.
- Taninaka H, Hashimoto K Dependence of post-drop reactivity on data analysis model for rod drop experiment in a subcritical reactor with external source. Proceedings of the international topical meeting on reactor physics (PHYSOR 2006); September 10-15; 2006; Vancouver, Canada.
- Taninaka H, Hashimoto K, Pyeon CH, et al. Determination of subcritical reactivity of a thermal accelerator-driven system from beam trip and restart experiment. J Nucl Sci Technol. 2011;48:873–879.
- Shibata K, Iwamoto O, Nakagawa T, et al. JENDL-4.0: A new library for nuclear science and engineering. J Nucl Sci Technol. 2011;48:1–30.
- Keepin GR, Wimett TF, Zeigler RK. Delayed neutrons from fissionable isotopes of uranium, plutonium and thorium. Phys Rev. 1957;107:1044–1049.
- Akino F, Yasuda H, Kaneko Y. Determination of large negative reactivity by integral version of various experimental methods. J Nucl Sci Technol. 1980;17:593–615.
- Nagaya Y, Okumura K, Mori T, et al. MVP/GMVP II: General purpose Monte Carlo codes for neutron and photon transport calculations based on continuous energy and multigroup methods. Tokai-mura (Japan): Japan Atomic Energy Research Institute; 2005. ( (JAERI 1348)).