
ABSTRACT
Since radioactive waste inventory plays an important role in decommissioning scenario development, we developed an estimation method of the amount of radioactive wastes for a research reactor as a case study of the 100 KWth KARTINI reactor. In order to address geometrical complexity of the research reactor with experimental equipment such as beam ports, we calculated the distribution of neutron flux by using Monte Carlo particle transport code, and the radionuclide inventories generated by neutron capture in the reactor components and structures. The amount of radioactive wastes arising from the decommissioning was estimated by assigning radioactive parts according to the clearance criterion of each radionuclide. In addition, the size of a segment of the dismantled biological shielding was considered to estimate the amount of radioactive wastes addressing the actual dismantling activity. It is also found that the amount of radioactive wastes increases with the size of the segment because it includes partially clearance materials.
1. Introduction
There are 82 research reactors in shutdown status and 226 research reactors in operational status approaching to the end of life as of May 2019 [Citation1]. Even their facility size is smaller than nuclear power plants, decommissioning of the facilities must be completed in a safe and economical manner so that they will not become a legacy.
At the very beginning of the planning stage of decommissioning, characterization of the facility is needed to collect sufficient information to predict the radioactive concentration in the reactor components and structures. These will be utilized as a basis for planning decommissioning activities such as decontamination, dismantling, and radioactive waste management. The characterization includes a survey of existing data, calculation, in situ measurements and/or sampling and analyses. Although some studies on the estimation of the amount of radioactive wastes due to neutron activation [Citation2] were done for research reactors, not enough consideration has been given on how non-radioactive and radioactive wastes are separated during the actual dismantling process.
Research reactors are composed of many experimental facilities such as beam ports and a thermal column. During the reactor operation, neutrons stream through beam ports and would activate materials surrounding the beam ports and materials located far from the core. Because of this geometrical arrangement, we have to put attention not only to the core area, but also to other area surrounding the beam ports to estimate the radioactive waste inventory.
In Indonesia, there are two TRIGA reactors, KARTINI and Bandung reactor, which will reach their end of operation license at the end of 2019, and hence the preparation of decommissioning plan is required by the Indonesia`s regulatory body [Citation3]. We therefore need to establish the method to evaluate the amount of radioactive wastes arising from decommissioning of the research reactors. Then, we studied the method to evaluate the amount of radioactive wastes of the KARTINI reactor as a case study in the following steps. First, calculation of the amount of radioactive waste due to activation by neutron. Second, estimation of the amount of radioactive waste due to surface contamination by the reactor water. Last, consideration of segmenting units to estimate the amount of radioactive waste in an actual dismantling activity for the biological shielding. Because uncertainty exists in those steps; the operational history, the content of parent nuclides and the size of the segmentation, we evaluate their effect to the amount of radioactive wastes.
2. Outline of nuclear activities in Indonesia
2.1. KARTINI reactor
The TRIGA type reactor was first presented to the public at the Geneva Conference on Peaceful Uses of Atomic Energy in 1955. After that, approximately 60 TRIGA reactors were constructed all over the world. In Indonesia, there are three research reactors and two of them are TRIGA type. The KARTINI reactor is TRIGA Mark-II type, which had reached its first criticality on 25 January 1979. This reactor could be operated until 250 kW thermal in design, but it was limited to 100 kW thermal in the operation [Citation4,Citation5].
The KARTINI reactor was dedicated for research and development in the fields of physics, material analyses, and educational purposes for students. For those activities, the reactor was equipped with various experimental facilities such as one rotary specimen rack, four beam ports, one thermal column, one thermalizing column, and in-core irradiation facilities. Most of the metal components are made from aluminum alloy except for the rotary specimen rack which has some amounts of stainless steel. Graphite is the main material in the reflector and the thermal column covered by aluminum case. shows horizontal and vertical and plane cross section of KARTINI reactor.
Figure 1. Horizontal and vertical plane views of KARTINI Reactor
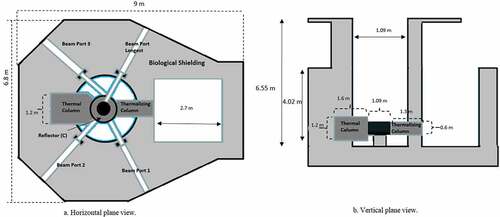
According to the document of Safety Analyses Report (SAR) of KARTINI reactor [Citation5], the assembly of reactor core and reflector is 1.09 m in diameter and 0.58 m in height, which are located at 0.61 m above the tank bottom. Each of the four beam ports has 0.195 m in inner diameter for the outer part and 0.15 m for the inner part. One of the beam port (longest beam port) has its end side at the reactor core, while the other beam ports only reach the outside wall of the reflector. The reactor has a massive biological shielding made from barite concrete as a radiation shielding surrounding the other components.
2.2. Radioactive waste management
In Indonesia, according to their radionuclide concentration, radioactive wastes are categorized into [Citation6,Citation7]:
High Level Radioactive Waste (HLW).
Intermediate Level Radioactive Waste (ILW), and
Low Level Radioactive Waste (LLW);
Relatively LLW (RLLW) (specific activity ˂ 1000 times of exemption level),
Very LLW (VLLW) (specific activity ˂ 100 times of exemption level), and
Short Half-Life LLW (half-life ˂ 150 days).
The clearance levels have been established to remove radioactive materials from any further regulatory control. Any materials which contain radioactive nuclides below the levels can be declared as clearance materials resulting in reuse or disposal of as non-radioactive wastes [Citation8]. Considering the unavailability of final disposal facility and limited space of the radioactive waste storage in Indonesia, it is useful to optimize the amount of radioactive wastes by applying the clearance of materials. The clearance levels of some important radionuclides are listed in [Citation9]. Here we have clearance levels for Co-60, Fe-55, C-14, H-3, Eu-152, and Eu-154 which are the major activation products in this study. By applying the clearance levels as the criteria we can categorize each component (or segment of the components) into radioactive wastes or clearance materials.
Table 1. Clearance levels of some important radionuclides [Citation9]
3. Method of calculation
3.1. Calculation flow
In general, there are two categories of residual radionuclide inventory of a nuclear reactor after shutdown; neutron-activated materials (activation by neutron) and contaminated materials (radioactive contamination) [Citation10]. In this research, the radioactive inventory due to activation by neutron was calculated using a computer code, while components in contact with the water were categorized as contaminated materials. The calculation flow of the amount of the radioactive wastes is summarized in .
Figure 2. Flow of calculations
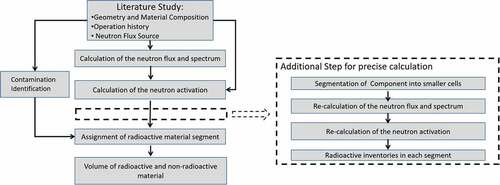
IAEA has presented the standard methodology to calculate neutron-induced activation. This calculation requires information on the reactor operation history, geometry, and material compositions. We improved the methodology by putting more attention on the specific geometrical configuration of the research reactor. There are beam ports in which neutrons stream from the core and activate the materials surrounding the beam ports and locating far from the core. We added the steps necessary for calculating the radioactive inventory more precisely. From the first calculation, we obtained the neutron flux distribution and radioactive inventories in each component. By using this result we decided which area needed to be segmented into smaller cells and re-calculated to obtain more precise radioactive inventory distribution as shown in the additional step in . Here we set 0.25 m thickness of the biological shielding near the beam ports as the unit cell of the calculation considering cutting the biological shielding between 0.5 m × 0.5 m × 0.5 m and 1.0 m × 1.0 m × 1.0 m in the actual dismantling activity. While for core components which are small, we considered disposal of them as one piece (without cutting).
3.2. Calculation conditions
We employed the Monte Carlo particle transport code, PHITS (Particle and Heavy Ion Transport Code System) to calculate neutron flux distribution and DCHAIN-SP to calculate the radionuclide concentration in the reactor components [Citation11]. The geometrical information and material specification were extracted from the SAR and the document of preliminary decommissioning planning of the KARTINI Reactor except some information; the specification of the core grids and the rotary specimen rack were, for example, extracted from standard TRIGA reactor design and other references [Citation2,Citation12–Citation14]. Because the nuclear fuels and control rods will be sent to their origin country when the license is terminated, we excluded those from the calculation. Some simplification was made in the modeling; all the materials were assumed homogeneous in each component, and the neutron flux and radioactive concentration were calculated as component-based except for the biological shielding and the reactor tank, which were segmented into smaller cells.
The neutron flux distribution and spectrum in the reactor core reported by SAR [Citation5] were set up as the neutron sources in the PHITS calculation. We tried to minimize the statistical error by maintaining the relative error to be about 5%.
3.3. Reactor component materials
Most of the metal components such as the beam ports, the core grids, the rotary specimen rack, the core support, and the core column are made from aluminum alloy, AlMg3 which contains Al, Cr, Cu, Fe, Mg, Mn, Si, Ti, and Zn as the main elements. The reactor tank is made from Al 1050 with same main elements as AlMg3 but the different amount in their composition [Citation15]. Stainless Steel is used for the materials of the beam port shields and the rotary specimen rack in small part. The reflector, the thermal column, and the thermalizing column are mainly made from carbon covered by AlMg3 plate. The barite concrete as the biological shielding contains Ba, O, C, Si, Ca, Al, S, Fe, H, and Eu as the elements [Citation12,Citation16,Citation17], which has a big amount of Ba-132 resulting in generation of Ba-133.
In the calculation, we included Li and B impurities regarding H-3 production, N regarding C-14 production, Cl regarding Cl-36 production in graphite components. These contents are 0.040 ± 0.005 ppm, 5.7 ± 0.1 ppm, 15 ± 4 ppm and 15.5 ± 1.2 of Li, B, N, and Cl, respectively, [Citation18,Citation19]. We also assumed the impurities of Co and Eu, 0.035 ± 0.004 ppm and 0.002 ± 0.001 ppm, respectively, in graphite components as the source of Co-60, Eu-152, and Eu-154 [Citation16]. For the stainless steel and the concrete components, we included Co impurity as 750–2570 ppm and 1–26 ppm, respectively [Citation20]. The materials composition in each component is listed in .
Table 2. Material compositions in weight percentage
3.4. Reactor operation history
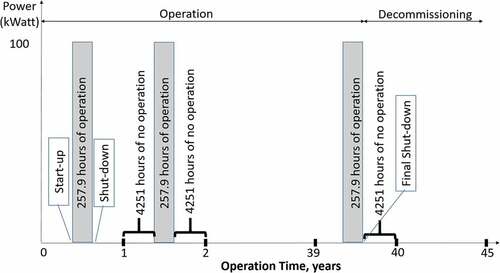
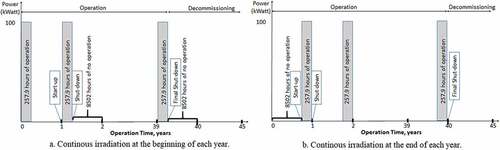
The KARTINI reactor has been operated for 10,093 h in total with the reactor power of 100 kWth since 1979 until 2018 [Citation4,Citation5]. We assumed that the reactor will be operated for 10,317 h in total until the end of 2019. As the basic case, we calculated the radioactive inventory under 257.9 h continuous operation from 1979 to 2019 at the middle of each year, as shown in . It was also calculated until 2024 after reactor shutdown by considering that the 5 years is the duration needed to prepare and complete the decommissioning activities. Different irradiation history (additional 21,685 operation hours) was assigned for the reflector, the core grids, and the core support since they had been actually used by the Bandung reactor operated since 1964 until 1979 [Citation4,Citation5].
Figure 3. Simplified scheme of operation history used in this calculation as the basic case
4. Neutron flux and activation calculation results
shows the calculated neutron flux distribution of total and thermal neutron energy groups. More detailed results of the average neutron flux in each component for three energy range, thermal, epithermal and fast are shown in . It was found that the biological shielding surrounding the beam ports has higher neutron flux compared to the other areas. Thermal neutron flux is the most concern since the cross section of the parent nuclides are large mostly in this neutron energy range. In the calculation, the average of thermal neutron flux in the biological shielding is 1.97 × 10⁵ n/cm2s, while it can reach 4.27 × 10¹⁰ n/cm2s in the longest beam ports contacted to the biological shielding. In the segments which are located far from the beam port, the neutron fluxes are extremely low and even not detected (white color area in ). Therefore, we segmented the biological shielding near to the beam ports into smaller cells to obtain more precise result.
Table 3. Distribution of neutron flux (n/cm2.s) [Citation11]
Figure 4. Neutron flux distribution [Citation11]
![Figure 4. Neutron flux distribution [Citation11]](/cms/asset/dd35d2ad-98f9-47c3-9eb6-452cc7e01209/tnst_a_1667923_f0004_c.jpg)
shows the radioactive inventory, the dominant radionuclides and the D/C in component-base. Since the neutron flux in the top part of biological shielding and spent nuclear fuel pool are very low, we do not consider the radioactive inventory of them. The most dominant radionuclides are Co-60 and Fe-55 in metal components and, C-14 and H-3 in graphite components. These radionuclides play an important role in determining radioactive waste classification. For example, C-14 is the most dominant radionuclide in the reflector, even its specific activity is much lower than H-3 because of its longer half-life and the lower clearance level. The ratio of the specific activity of each nuclide to its clearance level, D/C, is the criteria to determine whether the objects can be categorized as clearance materials or not. To categorize the object as a clearance material, Σ D/C of all nuclides have to be less than 1.0.
Table 4. Radioactive inventories and D/C in components 5 years after reactor shutdown
In the thermalizing column, we considered Co impurity which can be activated into Co-60. Since C0-60 has large D/C even its specific activity is much lower than H-3, it has higher D/C which makes Co-60 is more dominant than H-3.
In the biological shielding, Ba-133, Fe-55, Co-60, and Eu-152 are the dominant radionuclides. The activated barite concrete has high specific activity of Ba-133 because barite concrete contains significant amount of Ba compared to other types of concrete [Citation15,Citation16,Citation20]. Since Ba-133 is not addressed in the Indonesia`s regulation, we used 1.0 Bq/g as the clearance level for Ba-133 as used in Germany [Citation15,Citation16].
To obtain more detailed result, we calculated precisely by dividing the areas for 0.25 m thickness of the biological shielding from the beam ports and the reactor tank surface. In addition, the areas around the beam ports were further divided by 0.25 m from the tank surface to the outer of the biological shielding. The Σ D/C of segments in the biological shielding is shown in . By this approach the highest Σ D/C is about 229.7 in the cell of biological shielding surrounding the longest beam port.
Figure 5. Distribution of Σ D/C in biological shielding segments
5. Discussion
5.1. Sensitivity analyses for radioactive inventory estimation
There is some uncertainty in these calculation results due to the lack of detailed input data for radioactive inventory estimation, they come from:
reactor operation history, and
material impurities.
The effects to the amount of radioactive wastes are discussed in the next sub-chapters.
5.1.1. Reactor operation history
In the basic case, we assumed a continuous irradiation scheme in the middle of each year to simplify the calculation. We neglected the details of the multiple start-up and shutdown cycles within each year. In order to evaluate the effect of the simplification, we did two additional calculations that are intended to bound all the possible variations of the start-up and shutdown cycles within a year. shows the two variations of the operation history, in which we assigned continuous irradiation at (a) the beginning and (b) the end of each year. The operation history in case (a) presents longer decay time of the activation product and results in less radioactive materials than the basic case, while case (b) presents shorter decay time and more radioactive materials.
Figure 6. Operation history assumption
lists the value of Σ D/C in each component calculated under the conditions of (a) and (b). By applying the condition (a), one cell in the biological shielding surrounding the longest beam port was converted from radioactive waste into clearance material (C6:R3 in )). Due to the longer decay time in case (a) than the basic case, the Σ D/C decreases from 1.1 to the 0.9 which is mostly contributed by the Co-60 specific activity. For other components, their category did not change.
Table 5. Σ D/C calculated using lower (a) and higher (b) case of operation history
5.1.2. Material impurities
The effects of impurities on radioactivity concentration were calculated; Li, B, Cl, Co and N for graphite components, Co for steel components, and Co for barite concrete by applying the higher and lower values of the impurity. lists the Σ D/C for lower and higher case of impurities in each component.
Table 6. Σ D/C calculated using lower and higher impurities
The categorization of three cells of the biological shielding surrounding the reactor tank (S1, S3, S6 in )) was converted into clearance material from radioactive wastes by applying the lower impurity. While categorization of two cells of the biological shielding surrounding the reactor tank (S5, S7 in )) and one cell of foundation (F1 in )) was converted into radioactive waste from clearance material by applying the higher impurity.
5.2. The amount of radioactive wastes in the basic case
We estimated the amount of radioactive wastes by applying Indonesia’s radioactive waste and clearance level criteria [Citation6]. On the basis of Σ D/C in each cell, we decided each cell`s category as radioactive wastes or clearance materials. The categorization is done by component base for all components except for the biological shielding.
shows the areas categorizing as radioactive wastes areas with a comparison to the clearance materials. The dark color indicates the clearance materials, the light color radioactive wastes due to neutron activation. The categorization of the biological shielding in is derived from the Σ D/C as shown in . The calculation result shows that all radioactive wastes are categorized as VLLW except for the rotary specimen rack (categorized as RLLW due to Co-60 specific activity) consisting of 25.9 tons of barite concrete, 2.6 ton of graphite, and 0.8 ton of metal (basic case) as shown in .
Table 7. Weight of radioactive wastes at 5 years after reactor shutdown
Figure 7. Horizontal and vertical plane view of KARTINI reactor showing area of categorization
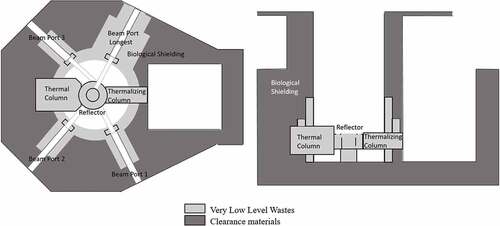
The reactor tank and spent nuclear fuel pool liner have direct contact to the reactor water which is contaminated [Citation4,Citation12]; therefore, these components are categorized as radioactive waste. These components constitute the additional 1.8 tons of the contaminated metal wastes.
5.3. Cutting procedure of the biological shielding
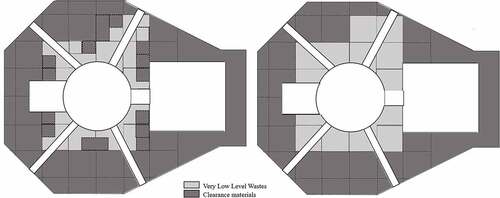
When considering the practical way of cutting biological shielding, it is not easy to cut it precisely at the boundary between radioactive and clearance segments as shown in . We therefore took into account the device capability on preciseness and cutting shapes for estimating the amount of radioactive wastes.
As a case study, we assumed the biological shielding be segmented and disposed of into 0.125 or 1.0 m3 cubes size, which correspond to 0.5 m × 0.5 m × 0.5 m and 1.0 m × 1.0 m × 1.0 m cutting unit size as shown in . By considering these cutting unit sizes, 59.3 or 75.3 tons of radioactive wastes were expected to arise from dismantling the biological shielding. The amount of radioactive wastes is higher than the basic case due to the presence of clearance materials in the segment. There are two options of waste treatment; direct disposal of the segments of the biological shielding, and reduce the amount of radioactive wastes by further cutting the segments. The former treatment results in higher amount of radioactive wastes, while the latter requires more workforce and time.
Figure 8. Radioactive concrete waste distribution map according to simple dismantling cutting line
5.4. Amount of radioactive wastes
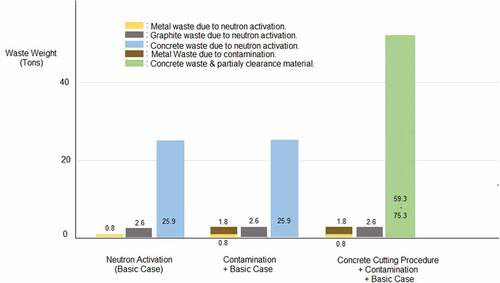
shows the amount of the radioactive wastes estimated by the three cases. The radioactive wastes weight 29.3 tons (0.8 tons of metal + 2.6 tons of graphite + 25.9 tons of concrete) in the basic case, 31.1 tons (2.6 tons of metal + 2.6 tons of graphite + 25.9 tons of concrete) in the contamination consideration and 64.5 to 80.5 tons (2.6 tons of metal + 2.6 tons of graphite + 59.3–75.3 tons of concrete) in the cutting size (and contamination) consideration. Comparing the three cases, the amount of radioactive wastes under the cutting size consideration is more than twice as much as the other cases. The reason is that each segmented unit includes partially clearance materials. So, the effective way to minimize the amount of radioactive wastes is cutting the segmented unit to separate precisely the clearance materials. It will be a decision-making matter of decommissioning plan.
Figure 9. Summary of radioactive waste weight at 5 years after reactor shutdown
This study is not only based on the estimation of the amount of radioactive wastes by neutron activation, but also includes dismantling practice consideration so that the methodology developed in this study could be applied realistically for planning of decommissioning activities.
6. Conclusion
We studied the methodology of radioactive waste inventory estimation of a research reactor for decommissioning scenario development. The amount of radioactive wastes of the KARTINI reactor was calculated as a case study. The conclusions were derived as follows:
Due to the unique design of a research reactor, attention should be put on the components which are located near the beam ports. More than half of the radioactive wastes come from the area surrounding the beam ports.
The parametrical calculations on the reactor operation mode and component material impurities showed that they affect little in the estimation of the amount of radioactive wastes. This basic case of this study could be enough in estimating the amount of radioactive wastes due to the neutron activation for preliminary decommissioning planning.
Planning on the cutting lines played an important role in estimating the amount of radioactive wastes in addition to the neutron activation calculations.
The methodology we developed in this study should be applied for practical estimation of the amount of radioactive wastes for decommissioning planning.
Acknowledgments
The authors would like to acknowledge the Scholarship Program for Research and Innovation in Science and Technologies (RISET-Pro), Ministry of Research, Technology and Higher Education, Republic of Indonesia and BAPETEN-Indonesia in providing the data for this study.
Disclosure statement
No potential conflict of interest was reported by the authors.
References
- Research Reactor Database [Internet]. Austria: International Atomic Energy Agency; cited 2019 Mar 30. Available from: https://nucleus.iaea.org/RRDB/RR/ReactorSearch.aspx?rf=1.
- Raty A, Kotiluoto P. FIR 1 TRIGA activity inventories for decommissioning planning. PREDEC 2016. 2016 February 16–18. Lyon, France.
- Government regulation of republic Indonesia no. 2 year 2014 on licensing of nuclear facilities and materials. Jakarta: BAPETEN; 2014. [in Bahasa Indonesia].
- Operation report of KARTINI reactor trimester II year 2018. Yogyakarta: PSTA-BATAN; 2018. [in Bahasa Indonesia].
- Safety analyses report of KARTINI reactor rev.7. Yogyakarta: PTAPB-BATAN; 2012. [in Bahasa Indonesia].
- Government regulation of republic Indonesia no. 29 year 2008 on licensing of the utilization of radiation source and nuclear material. Jakarta: BAPETEN; 2008. [in Bahasa Indonesia].
- Government regulation of republic Indonesia no. 61 year 2013 on radioactive waste management. Jakarta: BAPETEN; 2013. [in Bahasa Indonesia].
- Application of the concepts of exclusion, exemption and clearance. (Safety Standard Series No. RS-G-1.7). Austria: International Atomic Energy Agency; 2004.
- BAPETEN Chairman Regulation No. 16 Year 2012 on Clearance Level. Jakarta: BAPETEN; 2012. [in Bahasa Indonesia].
- Radiological characterization of shut down nuclear reactors for decommissioning purposes. (Technical Report Series 389). Austria: International Atomic Energy Agency; 1998.
- Sato T, Niita K, Matsuda N, et al. Particle and heavy ion transport code system, PHITS, version 2.52. J Nucl Sci Technol. 2013;50:913–923.
- Decommissioning planning of KARTINI reactor rev.2. Yogyakarta: PTAPB-BATAN; 2013. [in Bahasa Indonesia].
- Tomsio N. Characterization of TRIGA fuel. (GA Project 3442). USA: General Atomic; 1986.
- Description of TRIGA Reactor [Internet]. Slovenia: Ravnik M; cited 2019 Mar 30. Available from: www.rcp.ijs.si/ric/description-s.html.
- Puradwi IW, Nitiswati S, Tjiptono T, et al. Modification and continue monitoring of KARTINI reactor tank liner for long term safe operation. Joint IGORR. 2013 October 13–18. Republic of Korea.
- Meyer F, Steger F. The decommissioning of the ASTRA-MTR research reactor facility. Keswick: IAEA; 2006.
- Nagel R, Sell K, Langowski A. Activation calculations some practical experience and consequences from the new German radiation protection ordinance; Atomic Energy Research Symposium on WWER Physics and Reactor Safety (INIS-SK—2008-003); Hungary; 2001.
- Messaoudi N, Abderrahim HA, Noynaert L. Radiological characterization of the activation of the structure materials of the BR1 research reactor. Belgium: SCK.CEN; 2000.
- Plukiene R, Plukis A, Puzas A, et al. Modelling of impurity activation in the RBMK reactor graphite using MCNPX”. J Nucl Sci Technol. 2011;2:421–426.
- Evans JC, Lepel EL, Sanders RW, et al. Long-lived activation products in reactor materials, (NUREG/CR-3474); Washington DC; 1984.