
 ?Mathematical formulae have been encoded as MathML and are displayed in this HTML version using MathJax in order to improve their display. Uncheck the box to turn MathJax off. This feature requires Javascript. Click on a formula to zoom.
ABSTRACT
This paper presents an approach to uncertainty estimation of spallation particle multiplicity of lead (natPb), primarily focusing on proton-induced spallation neutron multiplicity (xpn) and its propagation to a neutron energy spectrum. The xpn uncertainty is estimated from experimental proton-induced neutron-production double-differential cross-sections (DDXs) and model calculations with the Particle and Heavy Ion Transport code System (PHITS). Uncertainties in multiplicities for (n, xn), (p, xp), and (n, xp) reactions are then inferred from the estimated xpn uncertainty and the PHITS calculation. Using these uncertainties, uncertainty in a neutron energy spectrum produced from a thick natPb target bombarded with 500 MeV proton beams, measured in a previous experiment, is quantified by a random sampling technique, and propagation to the neutron energy spectrum is examined. Relatively large uncertainty intervals (UIs) are observed outside the lower limit of the measurement range, which is prominent in the backward directions. Our findings suggest that a reliable assessment of spallation neutron energy spectra requires systematic DDX experiments for detector angles and incident energies below 100 MeV as well as neutron energy spectrum measurements at lower energies below ∼1.4 MeV with an accuracy below the quantified UIs.
1. Introduction
Monte Carlo particle transport codes are widely used to simulate the transport of incident and secondary particles for neutronic and shielding analyses in various applications (e.g. fission and fusion reactors, accelerators, medical radiation, and space exploration). Among secondary particles produced from nuclear reactions, energy spectrum intensity of spallation neutrons has a particularly significant impact on the neutronic performance, radiation shielding, and radioactive waste management of the accelerator-driven nuclear transmutation systems (ADSs) [Citation1–Citation3] and the spallation neutron sources [Citation4–Citation9]. Reliable assessment of these neutronic characteristics requires detailed information about their uncertainties.
As a method for quantifying the uncertainties of neutronic characteristics, the so-called random sampling technique [Citation10,Citation11] has been developed. In order to apply this technique to the Monte Carlo particle transport calculation, uncertainties in nuclear data or nuclear reaction model parameters must be evaluated beforehand; because the uncertainties are expressed in the form of variance–covariance matrices, they are often referred to as covariance data [Citation12]. To meet this requirement, a great deal of effort has been devoted to assessing the covariance data of the nuclear data libraries (e.g. ENDF [Citation13], JENDL [Citation14], and JEFF [Citation15]) for neutrons below 20 MeV, and various uncertainties in reactor physics parameters have been quantified for the neutronic design of innovative nuclear systems such as ADSs (e.g. effective neutron multiplication factor [Citation16–Citation18], effective delayed neutron fraction
[Citation19,Citation20], burnup reactivity [Citation21], decay heat [Citation22], and
Po production [Citation23]). In the current body of research, few attempts have been made to estimate the uncertainty in nuclear data for protons and neutrons above 20 MeV. Stankovskiy et al. [Citation24] endeavored the first such attempt for lead (
Pb) and bismuth (209Bi) isotopes; however, a satisfactory estimation methodology has yet to be established.
This study focuses on the uncertainty in the spallation particle multiplicity of lead (natPb) and its propagation to a neutron energy spectrum produced and emitted from a thick natPb target, even though the various uncertainties (e.g. nonelastic and elastic scattering cross-sections, energy–angle distributions of produced neutrons, energy loss of charged particles in materials) each affect it. Furthermore, although various particles, such as neutrons, protons, deuterons, pions, and photons, are emitted from the spallation reactions, this study exclusively focuses on protons and neutrons, which are major contributors to the formation of the spallation neutron energy spectrum. While Stankovskiy et al. [Citation24] estimated the uncertainties in the proton-induced spallation neutron multiplicity () and neutron-induced spallation neutron multiplicity (
) using various samples of nuclear reaction models [Citation25–Citation27] and high-energy nuclear data libraries [Citation28–Citation30], in our study, we estimate the
uncertainty on the basis of experimental proton-induced neutron-production
double-differential cross-sections (DDXs) and model calculations using the Particle and Heavy Ion Transport code System (PHITS) version 3.08 [Citation31]. Because experimental
,
, and
DDX data are scarce, uncertainties in the multiplicities for these reactions (i.e.
,
, and
) were inferred from the estimated
uncertainty and the PHITS nuclear reaction calculations, for which the default nuclear reaction model, a combination of the Intra-Nuclear Cascade model of Liège version 4.6 (INCL4.6) [Citation27] and Generalized Evaporation Model (GEM) [Citation32], was employed. For neutrons below 20 MeV, JENDL version 4.0 (JENDL-4.0) [Citation14] was used. Then, the uncertainty in the spallation neutron energy spectrum was quantified using the estimated
,
,
, and
uncertainties via the random sampling technique; hereafter, their collective quantity, or the spallation particle multiplicity, will be referred to as
.
In Section 2, we will describe our estimation method of the uncertainty. Section 3 describes our uncertainty quantification method for a neutron energy spectrum, elucidates our calculation conditions, and offers a detailed discussion of our results. A summary and suggestions for future work are given in Section 4.
2. Estimation of uncertainty in spallation particle multiplicity
Using , the proton-induced neutron-production cross-section (
) and its DDX can be expressed as
and
respectively, where is the incident proton energy and
is the proton-induced nonelastic scattering cross-section. Meanwhile,
is the energy–angle distribution of the outgoing neutrons for
as a function of polar angle
in the laboratory frame and outgoing energy (
), which obeys the following normalization condition:
For simplicity, in this study, we assume that the model calculation provides correct and
values; that is, the relative uncertainty in
is equivalent to that in the magnitude of
and DDX. While the calculated
values should also involve uncertainty, our previous study confirmed that Pearlstein–Niita systematics [Citation33] implemented in PHITS reproduces experimental
data for lead fairly well (see Iwamoto et al. [Citation34]); in other words, this uncertainty is negligible.
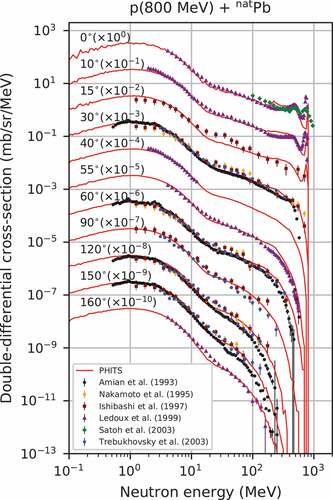
In order to estimate the uncertainty in , experimental spallation neutron multiplicities and their uncertainties were assessed in advance using experimental DDX data taken from the EXchange FORmat (EXFOR) experimental nuclear reaction database [Citation35] as well as experimental data recently measured by Satoh et al. [Citation36]. As an example, compares the PHITS nuclear reaction calculation with the experimental DDX data for the
(800 MeV) +
Pb reaction (Amian et al. [Citation37], Nakamoto et al. [Citation38], Ishibashi et al. [Citation39], Ledoux et al. [Citation40], Satoh et al. [Citation41], and Trebukhovsky et al. [Citation42]). Although PHITS broadly reproduces the experimental data, discrepancies are observed not only between the calculated and experimental values, but also among the experiments that should have been measured under the same projectile, target, and detector angle conditions; this discrepancy is likely linked to unknown experimental uncertainties (e.g. detection efficiency, energy calibration, and geometric measurement conditions). Thus, we first calculated the relative differences between the experimental DDX values and the PHITS calculations for each experiment (
), and counted them as samples, which are expressed as
Figure 1. Comparison of DDX for (800 MeV) +
Pb reaction between the PHITS calculations and experimental data
where and
stand for
th measurement energy and
th measurement angle of the outgoing neutrons, respectively;
denotes the measured DDX value; and
indicates the calculated DDX value. Based on the above assumption, a sample of relative
difference (
) can be written as
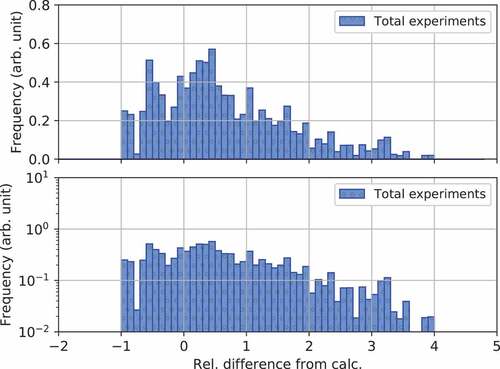
shows histograms of the frequency distribution for the
Figure 2. Histograms of relative difference from the PHITS calculation of DDXs for 20, 34, 48, 62.9, 63, 78, 113, 256, 597, and 800 MeV, as well as 1.0, 1.2, 1.5, 1.6, and 3.0 GeV +
Pb reactions, where the values in each bin are normalized such that the integral value is unity. In each panel, the datapoint with the error bar indicates
and uncertainty width
of the distribution
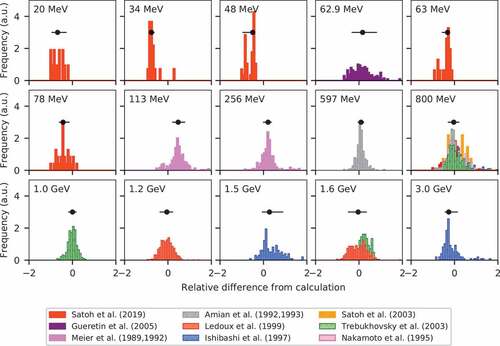
Table 1. Summary of DDX experiments for Pb
reactions and evaluation results for each incident proton energy
where
Here, and
indicate the upper and lower quartiles, respectively. The IQR/1.349 is an index known as the normalized IQR (NIQR), which equals standard deviation (1
) when the population is normally distributed. illustrates a comparison of the proton-induced
Figure 3. Proton-induced natPb spallation neutron multiplicity (top panel: linear scale, bottom panel: logarithmic scale). The dot-dashed lines are the calculations with PHITS. The solid line is the JENDL-4.0/HE evaluation; the dotted line is the TENDL-2017 evaluation; the datapoints with error bars indicate
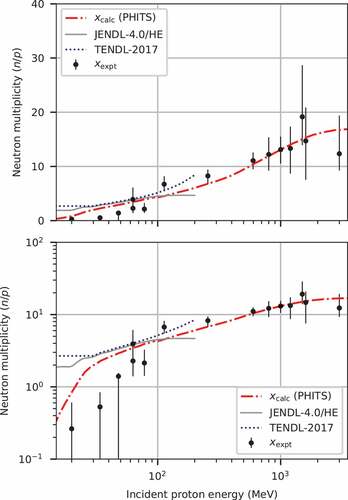
In the above expression, denotes the spallation neutron multiplicity calculated using PHITS. The estimated statistics (
) are also presented in . Although the PHITS results are generally consistent with the estimated experimental values for incident proton energies above 100 MeV, significant overestimation is observed below 100 MeV. In addition, INCL4.6 corroborates the experiments of Guertin et al. [Citation43] according to Boudard et al. [Citation27], but it fails to reproduce the neutron energy distribution for incident protons below 100 MeV at 0° (see Satoh et al. [Citation36]). As suggested by Cugnon and Henrotte [Citation47], these trends may be attributed to the limited application of the INC model, which treats the nuclear reactions as classical kinematics using the classical collision term. Although the threshold of validity of the INC model is uncertain, for the sake of convenience, the uncertainty in
was estimated separately for below and above 100 MeV.
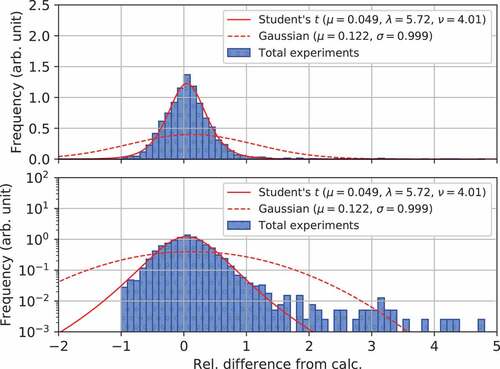
shows a histogram of
Figure 4. Histogram of relative difference from the PHITS calculations for incident proton energies above 100 MeV. The dashed and solid curves indicate a fit to the histogram with Gaussian distribution and Student’s t-distribution, respectively (top panel: linear scale, bottom panel: logarithmic scale)
and
respectively, where is the mean,
is the standard deviation,
is the degree of freedom,
is the precision of the t-distribution, and
indicates the gamma function. Student’s t-distribution is an alternative probability distribution to Gaussian distribution, which is often used for the robust regression analysis (e.g. see Bishop [Citation48]). To find the maximum likelihood solution constrained by the condition that
, this study employed the expectation-maximization algorithm [Citation49]. It can be observed from this figure that the width of the Gaussian fit is excessively large (
). This is likely caused by the presence of outliers originating from large differences at high-energy edges of the neutron energy spectra. In contrast, the robustness of the t-distribution to outliers provides a good fit to the histogram. Based on the statistical analysis and the fitting with Student’s t-distribution,
,
, and
were obtained.
Because PHITS significantly overestimates the below 100 MeV, we first considered a simple fitting function for the estimated
values. Then, the most probable
values with a probability distribution were estimated from the function, which is expressed as
where is the incident proton energy in MeV;
and
are fitting parameters; and
is a free parameter in MeV, which is chosen so that the most probable
line below 100 MeV connects to that above 100 MeV as smoothly as possible. Owing to the much smaller sample size of Satoh et al.’s [Citation36] experimental data compared to that of Guertin et al. [Citation43], both the data were each arranged in 1,000 samples via the bootstrap resampling technique [Citation50]. By fitting these data using the weighted least-squares method, we chose
and optimal values of
and
were obtained. depicts a histogram of relative difference from EquationEquation (12)
(12)
(12) with the optimal values
Figure 5. Histogram of relative difference from EquationEquation.(12)(12)
(12) for incident energies below 100 MeV (top panel: linear scale, bottom panel: logarithmic scale)
From this statistical analysis, and NIQR of the
distribution were measured as 0.485 and 1.109, respectively. Unfortunately, however, no proper parametric function was obtained owing to the presence of many outliers in the prominently asymmetric and multimodal distribution.
The above analytical results are summarized in . Meanwhile, displays the same information as , but it incorporates the estimated uncertainty interval (hereafter, referred to as UI), in which 50% and 90% UIs are drawn with dark and light bands, respectively. Here the upper and lower boundaries of the 50% UI were calculated as 75th and 25th percentiles, respectively, whereas those of the 90% UI were calculated as 95th and 5th percentiles, respectively. It can be observed that the UIs below 100 MeV are much larger than those above 100 MeV. This large uncertainty is due to the lack of systematic experimental data. Among the available references, Satoh et al. [Citation36] measured DDXs for five incident energies (i.e. 20, 34, 48, 63, and 78 MeV) all dedicated to 0°, and Guertin et al. [Citation43] measured DDXs for five detector angles (i.e. 24°, 35°, 55°, 80°, and 120°) but focused on an incident energy of 62.9 MeV. We note that, to reduce this uncertainty, further systematic DDX experiments for detector angles and incident energies below 100 MeV are needed.
Figure 6. Same as , but including the uncertainty estimated from ,
, and
(top panel: linear scale, bottom panel: logarithmic scale). The dotted lines and the dark and light bands are
and 50% and 90% UIs, respectively
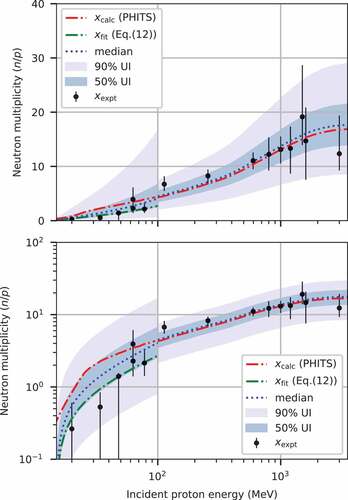
Table 2. Summary of statistical analyses for samples of (
MeV) and
(
MeV)
In contrast to the reaction, few experimental DDX data are available for the
,
and
reactions. However, because the nucleon emission mechanism at higher incident energies is described well by Serber’s classical picture [Citation51], it is expected that the reproducibility of the
,
,
, and
spectra via the PHITS nuclear reaction model based on Serber’s picture should be similar. Therefore, we assume that uncertainties for the
,
,
, and
reactions share the same probability density function. demonstrates the calculated
Figure 7. Neutron-induced spallation proton multiplicity () (left panels), proton-induced spallation proton multiplicity (
) (middle panels), and neutron-induced spallation proton multiplicity (
) (right panels) inferred from the estimated
uncertainty and the PHITS nuclear reaction calculations (top panels: linear scale, bottom panels: logarithmic scale). The dark and light bands are 50% and 90% UIs, respectively
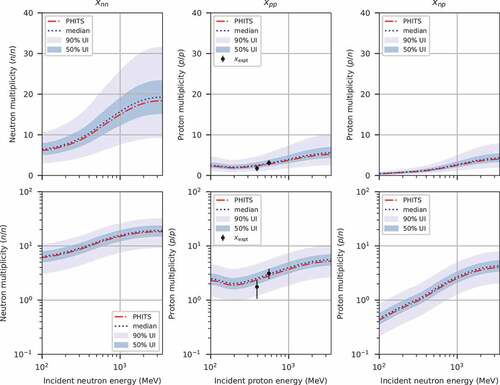
Table 3. Summary of DDX experiments for Pb
reactions and evaluation results for each incident energy
The estimated statistics of ,
,
and
(i.e.
and 50% UI) for representative incident proton energies are listed in . Here, for incident energies below 100 MeV, we did not estimate in this study the uncertainties for
,
, and
owing to the lack of systematic experimental data and theoretical rationale. The nuclear reaction mechanism and its uncertainty in this energy range could be accounted for by some quantum mechanical approach using other nuclear reaction models such as CCONE [Citation54] and TALYS [Citation29]. However, indicates that the CCONE and TALYS, which were utilized in evaluating the JENDL-4.0/HE and TENDL-2017, respectively, presumably have room for improvement.
Table 4. Estimates of ,
,
, and
for
Pb at representative incident energies
3. Uncertainty quantification of a neutron energy spectrum
3.1. Methodology
The variables ,
,
, and
would typically correlate with one another (each correlation coefficient [
] must be in the range between
and 1); however, because the nuclear reaction model treats the particle emission on an event-by-event basis, estimating the correlations is difficult in practice. For simplicity, therefore, in this study, we assume that each set of variables has a total positive correlation; namely,
.
Let be written as
where indicates a random variable obeying a probability distribution. Then, from EquationEquation (1)
(1)
(1) ,
can be expressed as
However, for the aforementioned reason, it is practically impossible to directly treat as a simple random variable. In order to circumvent this problem, we assume that the nuclear reaction is stochastically triggered on the basis of
and conduct the usual nuclear reaction simulation, which is expressed as follows:
where is calculated using the Pearlstein–Niita systematics [Citation33]. Although this assumption does not satisfy the event-by-event nuclear reaction kinematics, EquationEquation (16)
(16)
(16) is formally the same as EquationEquation (15)
(15)
(15) . Thus, we quantified the uncertainty in the neutron energy spectrum according to the following procedure:
Sample
according to a probability distribution.
Multiply
Compile a set of PHITS source files and create a PHITS executable file.
Calculate the neutron energy spectrum using the executable file.
Repeat the above steps
Calculate the uncertainty from the
As for the probability distribution of the uncertainty for incident energies above 100 MeV, we employed Student’s t-distribution assessed in as follows:
where ,
, and
. To avoid unphysical occurrences, that is, a negative
value, samples with
(3.3% of total samples) were omitted. While this procedure slightly shifts the median and mean values from 0.049 to 0.067 and 0.099, respectively, its impact on the distribution shape was negligible. Because no reasonable probability function for incident energies below 100 MeV could be found, we first focused on the propagation of the uncertainty in
above 100 MeV in this section; then, the impact of the
below 100 MeV on the neutron energy spectrum is discussed in the subsequent section.
As an example, responses of random samples to
and
are presented in . Here,
Figure 8. Responses of random samples to
and
for the 800 MeV proton +
Pb reaction (top panel: histogram of the
random samples, right panel: histogram of the
and
output values, middle panel: relationship between
and
[
]). The datapoints with error bars are the calculation values with 1
statistical uncertainties; the solid line is the least-squares linear fit for a set of the points with error bars. The sample size is 300
![Figure 8. Responses of xrel random samples to σpn and σpp for the 800 MeV proton + natPb reaction (top panel: histogram of the xrel random samples, right panel: histogram of the σpn and σpp output values, middle panel: relationship between xrel and σpn [σpp]). The datapoints with error bars are the calculation values with 1σ statistical uncertainties; the solid line is the least-squares linear fit for a set of the points with error bars. The sample size is 300](/cms/asset/e87a8685-282c-43bd-ba92-5e0e5a7c3f3b/tnst_a_1671912_f0008_oc.jpg)
3.2. Calculation condition
This study is based on an experiment of Pb thick-target neutron yields (TTNYs) conducted by Meigo et al. [Citation55] at KEK. In this experiment, neutron energy spectra, which were produced from a thick
Pb target (H15 cm
W15 cm
D20 cm) bombarded with 500 MeV and 1.5 GeV proton beams, were measured using the time-of-flight method with organic liquid-scintillator detectors for six angles (i.e. 15
, 30
, 60
, 90
, 120
, and 150
). This study focuses on the 500 MeV proton-induced neutron energy spectrum. The range for the 500 MeV protons in
Pb is 19.9 cm, for which all incident protons stop in the material. A schematic of the experimental condition is illustrated in . In the PHITS simulation, the experimental geometry and the proton beam profile are precisely modeled.
Figure 9. A schematic of the experimental condition [Citation55]
![Figure 9. A schematic of the experimental condition [Citation55]](/cms/asset/7f965007-7c60-4363-9600-f08e38514bbc/tnst_a_1671912_f0009_oc.jpg)
Using the PHITS experimental model, the neutron energy spectrum () at each detector angle is calculated with
histories (
source histories per one batch times 10 batches). For details, see the PHITS user’s manual [Citation56]. The energy range of the tally is largely divided into four groups, as listed in . Hereafter, we express
with the tally group number
as
.
Table 5. Energy group structure for tally
3.3. Sample size of the random sampling
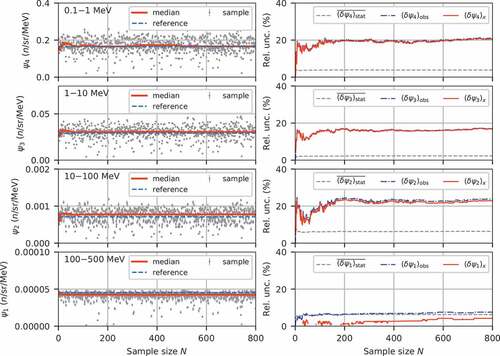
To determine a proper sample size for quantifying the uncertainty, we first examine its convergence for the sample size. displays the convergence of
Figure 10. Convergence of (left panels) and their 1
-equivalent uncertainties (right panels) as a function of the sample size (
) for the detector angle of 30
. For the left panels, the dots with error bars indicate the calculated
samples, the solid line is median of the
sample distributions, and the dashed line is a reference calculated without random sampling. For the right panels, the dashed line indicates
, which is the 1
statistical uncertainty of
averaged over
samples; the dot-dashed line is
, which is the observed statistical uncertainty obtained from
PHITS runs; the solid line is
, which is the uncertainty due to
where is 1
statistical uncertainty of
averaged over
samples and
is the observed statistical uncertainty obtained from
PHITS runs. Here,
is defined as the NIQR of the calculated
distribution:
where and
are the upper and lower quartiles, respectively. For
and
, it is seen in this figure that the
values sufficiently converge at
, and
are almost negligible; that is,
For , although
was so large that EquationEquation (20)
(20)
(20) was not satisfied,
appears to sufficiently converge at
. Therefore, considering the calculation cost and time spent, the random PHITS runs were ended at
, and then the
UIs were quantified via the statistical processing.
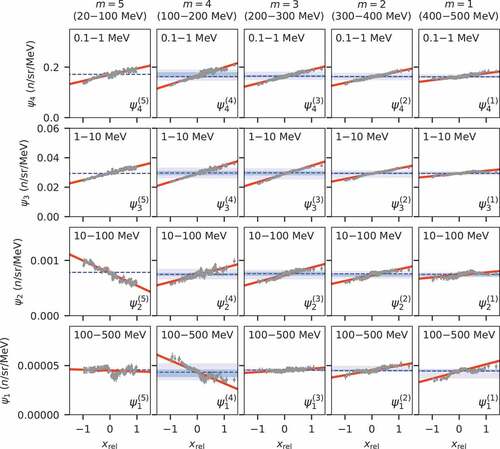
3.4. Propagation to a neutron energy spectrum
The estimated with
and
UIs propagated from the estimated
uncertainty for the six angles are pictured in and , along with the experimental values, which are drawn using logarithmic and linear scales, respectively. Here, the UIs were obtained by the statistical processing of EquationEquation (18)
(18)
(18) from the
distributions for the
samples. It can be observed in these figures that most measurement values are within the
and
UIs for the measurement scope above 1.4 MeV. However, relatively large UIs are seen around a broad peak of several hundred kiloelectron volts, which is out of the measurement scope. This result indicates that true
values likely exist within these UIs. It is important to note that the UIs are derived from the estimated
uncertainty at energies from 100 to 500 MeV; therefore, other uncertainty sources could broaden the UIs. We also note that neutron yields around the peak energy are important for the neutronic performance and radiation shielding of high-energy accelerator facilities, as suggested by Iwamoto et al. [Citation34,Citation57]
Figure 11. Estimated along with experimental data, which is drawn using the logarithmic scale. The dark and light bands indicate 90% and 50% UIs, respectively, propagated from the estimated
uncertainty above 100 MeV
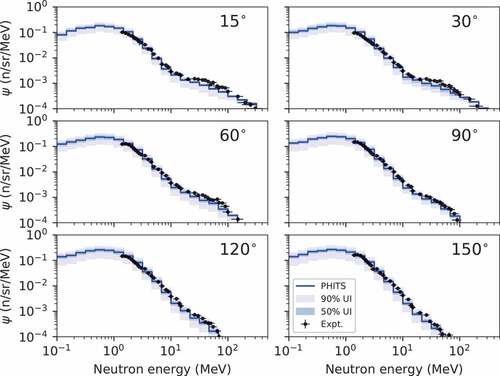
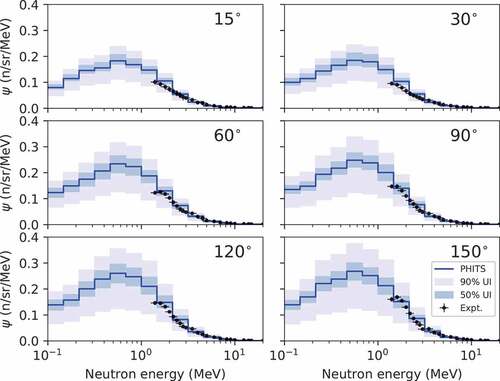
Figure 12. Same as , but drawn with the linear scale
To understand how the uncertainty propagates to the
uncertainties, we examine the relationships between
random samples and
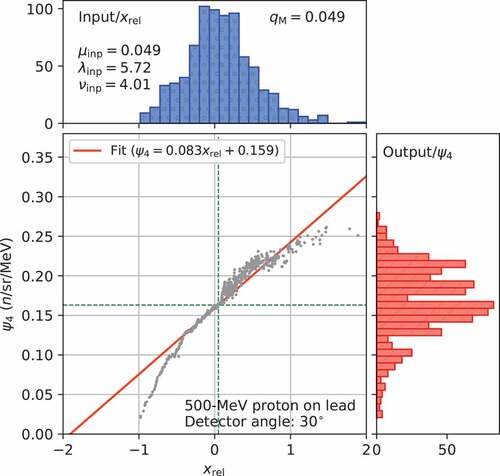
for all the energy groups and detector angles, the results of which are presented in , where, for each panel, the solid line indicates the weighted least-squares linear fit to the samples. Furthermore, as an example of the
distributions, a response of
random samples to
at 30
is shown in . In contrast to , in which the cross-section values increase in proportion to
, the
values exhibit a nonlinear relationship with
, and thus, the resultant
distributions are more asymmetric than those of
, which is most prominent at
. As described in Section 3.5, this asymmetric distribution is likely linked to the balance of neutron production and consumption in the nuclear reactions.
Figure 13. Relationships between random samples and
(
) for the six detector angles in the sampling energy range from 100 to 500 MeV. For each panel, the datapoints with error bars indicate the calculation values with 1
statistical uncertainties; the solid line is the least-squares linear fit for a set of points with the error bars; the dashed line with the dark and light bands indicates
with observed 50% and 90% UIs of
, respectively. The sample size is 200
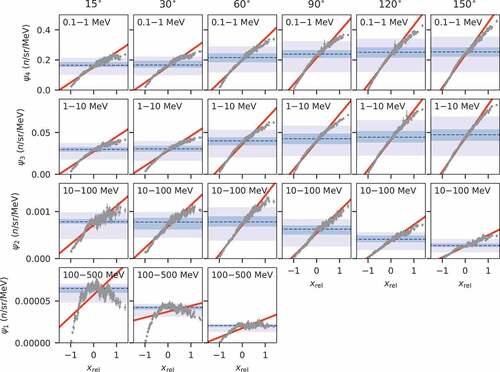
Figure 14. Response of random samples to
(top panel: histogram of the
random samples, right panel: histogram of the
output values, middle panel: relationship between
and
). The datapoints with error bars are the calculation values with 1
statistical uncertainties; the solid line is the least-squares linear fit for a set of points with error bars. The sample size is 800
Moreover, it can be observed from that as the detector angle shifts forward, the median values at energies below 10 MeV decrease. This phenomenon is likely due to the neutron shielding of the target material. Concurrently, we can also see that the median
values at energies above 10 MeV increase as the detector angle shifts forward, which is due to the forward directionality of neutron emission in the intra-nuclear cascade process [Citation25].
3.5. Impact of spallation particle multiplicity on a neutron energy spectrum
In order to examine the impact of on
in detail, the sampling energy range for incident protons from 100 to 500 MeV is divided into four groups, and a group for 20–100 MeV is added. The energy group structure for the random sampling is summarized in . Then, responses of
random samples in each sampling group to
are calculated, where the random seed used for
, and
is kept uniform. Hereafter, we express
with the sampling energy group
as
. For
, we use a continuous uniform distribution function as a noninformative probability distribution function:
Table 6. Energy group structure for random sampling
where and
. demonstrates the energy breakdown of the response of
random samples to
for the detector angle of 30
, where, for each panel, the solid line represents the weighted least-squares linear fit to the samples. Most slopes of the linear fits are positive, but negative slopes are observed in the panel of
and
. These trends are likely attributed to the balance of neutron production and consumption originating from the assumption of EquationEquation (16)
(16)
(16) , which is interpreted as follows. As
increases, more neutrons are produced from the nuclear reactions; therefore,
is generally expected to increase, and the slopes are expected to be positive. However, if most of the produced neutron energies are lower than the lower energy boundary of
, the slopes for
will possibly be negative. Let us take a case of
as an example. As
for
increases, more neutrons, which are mainly composed of evaporation neutrons with energies below 20 MeV, are produced from the nuclear reaction, whereas more neutrons from 100 to 200 MeV are consumed as projectiles. This production and consumption balance yields the positive slopes for
,
, and
and a negative slope for
and eventually involves a strong distortion of the
distribution.
Figure 15. Energy breakdown of the response of random samples to
for the 30
detector angle
depicts a relative sensitivity matrix of
Figure 16. Relative sensitivity matrix of to
for each detector angle
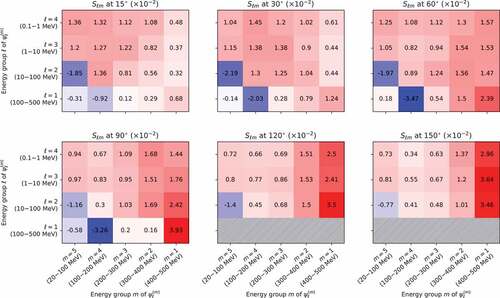
where ;
represents the neutron flux matrix, and
and
are the slope and
-intercept matrices of the linear fits, respectively. It can be observed that, as the detector angle shifts backward, the
values are most sensitive to
, but this trend is mitigated as the detector angle shifts forward. From these phenomena, we can interpret that
at backward directions are formed primarily from neutrons produced from a small number of nuclear reactions, whereas the forward
are formed mainly from neutrons produced from many nuclear reactions when passing through the target materials. These suppositions imply that the
uncertainty below 100 MeV should be considered in quantifying the total
uncertainty, particularly at the forward directions, which also suggests that the
uncertainty below 100 MeV could impact the neutron energy spectra for large-scale spallation target systems involving a large number of nuclear reactions.
4. Conclusions
In this study, we have estimated the uncertainty in from experimental DDXs and the PHITS calculations and inferred the uncertainties in
,
, and
on the basis of the estimated
uncertainty. Using these estimated uncertainties at incident energies from 100 to 500 MeV, we quantified the uncertainty in
produced from the thick
Pb target bombarded with 500 MeV proton beams using the random sampling technique, and propagation to
has been examined. Consequently, we obtained the following findings:
The
For neutron energies below 100 MeV, the 1
Relatively large
Although this study has taken the TTNY experiment of Meigo et al. as an example of the propagation of the uncertainty to
, our approach and findings are expected to be applicable to other TTNY experiments using high-energy proton beams and applications such as ADSs and spallation neutron source facilities. Based on the above findings and expectations, we have drawn the following challenges to be addressed in our future work:
Reliable assessment of
Validation of
Our random sampling approach will be applied to other TTNY experiments, ADSs, and/or spallation neutron source facilities, and subsequent issues on the impact of the
Acknowledgments
We would like to thank Dr. F. Maekawa from the Japan Atomic Energy Agency for his review of the manuscript and his comments.
Disclosure statement
No potential conflict of interest was reported by the authors.
Additional information
Funding
References
- Tsujimoto K, Sasa T, Nishihara K, et al. Neutronics design for lead-bismuth cooled accelerator-driven system for transmutation of minor actinide. J Nucl Sci Technol. 2004;41(1):21–36.
- Nishihara K, Iwanaga K, Tsujimoto K, et al. Neutronics design of accelerator-driven system for power flattening and beam current reduction. J Nucl Sci Technol. 2008;45:8,812–822.
- Van Den Eynde G, Malambu E, Stankovskiy A, et al. An updated core design for the multi-purpose irradiation facility MYRRHA. J Nucl Sci Technol. 2015;52:1053–1057.
- Futakawa M, Maekawa F, Sakamoto S. 1-MW pulsed spallation neutron source (JSNS) at J-PARC. Neutron News. 2011;20:1,15–19.
- Thomason JWG. The ISIS spallation neutron and muon source—the first thirty-three years. Nucl Instrum Methods in Phys Res A. 2019;917:61–67.
- Mason TE, Abernathy D, Andersona I, et al. The spallation neutron source in Oak Ridge: a powerful tool for materials research. Phys B Condens Matter. 2006;385–386:955–960.
- Blau B, Clausen KN, Gvasaliya S, et al. The Swiss Spallation Neutron Source SINQ at Paul Scherrer Institut. Neutron News. 2009;20(3):5–8.
- Chen H, Wang XL. China’s first pulsed neutron source. Nat Mater. 2016;15:689–691.
- Aguilar A, Sordo F, Mora T, et al. Design specification for the European Spallation Source neutron generating target element. Nucl Instrum Methods in Phys Res A. 2017;856:99–108.
- Kawano T, Hanson M, Frankle P, et al. Evaluation and propagation of the 239Pu fission cross-section uncertainties using a Monte Carlo technique. Nucl Sci Eng. 2006;153:1–7.
- Koning AJ, Rochman D. Towards sustainable nuclear energy: putting nuclear physics to work. Ann Nucl Energy. 2008;35:2024–2030.
- Herman M, Trkov A, editors. ENDF-6 Format Manual. United States: Brookhaven National Laboratory; 2010. CSEWG Document ENDF-102, Report BNL-90365-2009.
- Brown DA, Chadwick MB, Capote R, et al. ENDF/B-VIII.9: the 8th major release of the nuclear reaction data library with CIELO-project cross sections, new standards and thermal scattering data. Nucl Data Sheets. 2018;148:1–142.
- Shibata K, Iwamoto O, Nakagawa T, et al. JENDL-4.0: a New Library for Nuclear Science and Engineering. J Nucl Sci Technol. 2011;48:1,1–30.
- Cabellos O, Alvarez-Velarde F, Angelone M, et al. Benchmarking and validation activities within JEFF project. EPJ Web Conf. 2017;146:06004.
- Iwamoto H, Nishihara K, Sugawara T, et al. Sensitivity and uncertainty analysis for an accelerator driven system with JENDL-4.0. J Nucl Sci Technol. 2013;50(8):856–862.
- Iwamoto H, Nishihara K, Sugawara T, et al. Sensitivity and uncertainty analysis for a minor actinide transmuter with JENDL-4.0. Nucl Data Sheets. 2014;118:519–522.
- Romojaro P, Alvarez-Velarde F, Kodeli I, et al. Nuclear data sensitivity and uncertainty analysis of effective neutron multiplication factor in various MYRRHA core configurations. Ann Nucl Energy. 2017;101:330–338.
- Iwamoto H, Stankovskiy A, Fiorito L, et al. Monte Carlo uncertainty quantification of the effective delayed neutron fraction. J Nucl Sci Technol. 2018;55:5,539–547.
- Iwamoto H, Stankovskiy A, Fiorito L, et al. Sensitivity and uncertainty analysis of βeff for MYRRHA using a Monte Carlo technique. EPJ Nucl Sci Technol. 2018;4:42.
- Iwamoto H, Maier M, Nishihara K. Sensitivity and uncertainty analysis of burnup reactivity for an accelerator-driven system. Proc. Int. Conf. on the Physics of Reactors (PHYSOR2014); 2014 Sep 28–Oct 3; Kyoto (Japan): American Nuclear Sciety. [CD-ROM].
- Fiorito L, Buss O, Hoefer A, et al. Decay heat uncertainty quantification of MYRRHA. EPJ Web Conf. 2017;146:09021.
- Fiorito L, Stankovskiy A, Hernandez-Solis, et al. Nuclear data uncertainty analysis for the Po-210 production in MYRRHA. EPJ Nuclear Sci Technol. 2018;4:48.
- Stankovskiy A, Iwamoto H, Çelik Y, et al. High-energy nuclear data uncertainties propagated to MYRRHA safety parameters. Ann Nucl Energy. 2018;120:207–218.
- Bertini HW. Low-energy intranuclear cascade calculation. Phys Rev. 1963;131:1801.
- Mashnik SG, Sierk AJ. CEM03.03 user manual. United States: Los Alamos National Laboratory; 2012. Technical report LA-UR-12-01364.
- Boudard A, Cugnon J, David JC, et al. New potentialities of the Liège intranuclear cascade model for reactions induced by nucleons and light charged particles. Phys Rev C. 2013;87:014606.
- Kunieda S, Iwamoto O, Iwamoto N, et al. Overview of JENDL-4.0/HE and benchmark calculations. Japan: Japan Atomic Energy Agency; 2016. p. 41–46. (JAEA-Conf 2016-004).
- Koning AJ, Rochman D. Modern nuclear data evaluation with the TALYS code system. Nucl Data Sheets. 2012;113(12):2841–2934.
- Watanabe Y, Kosako K, Kunieda S, et al. Status of JENDL high energy file. J Korean Phys Soc. 2011;59(2):1040–1045.
- Sato T, Iwamoto Y, Hashimoto S, et al. Features of Particle and Heavy Ion Transport code System (PHITS) version 3.02. J Nucl Sci Technol. 2018;55:684–690.
- Furihata S, Niita K, Meigo S-I, et al. The GEM code – a simulation program for the evaporation and the fission process of an excited nucleus –. Japan: Japan Atomic Energy Research Institute; 1999. (JAERI-Data Code 2001-015).
- Niita K, Takada H, Meigo S-I IY. High-energy particle transport code NMTC/JAM. Nucl Instrum Methods Phys Res B. 2000;184:406–420.
- Iwamoto H, Nishihara K, Iwamoto Y, et al. Impact of PHITS spallation models on the neutronic design of an accelerator driven system. J Nucl Sci Technol. 2016;53:10,1585–1594.
- Otuka N, Dupond E, Semkova V, et al. Towards a more complete and accurate experimental nuclear reaction data library (EXFOR): international collaboration between nuclear reaction data centres (NRDC). Nucl Data Sheets. 2014;120(6):272–276.
- Satoh D, Iwamoto Y, Ogawa T. Measurement of neutron-production double-differential cross sections of natC, 27Al, natFe, and natPb by 20, 34, 48, 63, and 78 MeV protons in the most-forward direction. Nucl Instrum Methods Phys Res A. 2019;920:22–36.
- Amian WB, Byrd RC, Goulding CA, et al. Differential neutron production cross sections for 800 MeV protons. Nucl Sci Eng. 1992;112(1):78–86.
- Nakamoto T, Ishibashi K, Matsufuji N, et al. Spallation neutron measurement by the time-of-flight method with a short flight path. J Nucl Sci Technol. 1995;32(9):827–833.
- Ishibashi K, Takada H, Nakamoto T, et al. Measurement of neutron-production double-differential cross sections for nuclear spallation reaction induced by 0.8, 1.5 and 3.0 GeV protons. J Nucl Sci Technol. 1997;34(6):529–537.
- Ledoux X, Borne F, Boudard A, et al. Spallation neutron production by 0.8, 1.2, 1.6 GeV protons on Pb targets. Phys Rev Lett. 1999;82(22):4413–4415.
- Satoh D, Shigyo N, Ishibashi K, et al. Neutron-production double-differential cross sections of iron and lead by 0.8 and 1.5 GeV protons in the most-forward direction. J Nucl Sci Technol. 2002;40(5):283–290.
- Trebukhovsky YuV, Titarenko YuE, Batyaev VF, et al. Double-differential cross sections for the production of neutrons from Pb, W, Zr, Cu, and Al targets irradiated with 0.8-, 1.0-, and 1.6-GeV protons. Phys At Nuclei. 2005;68(1):3–15.
- Guertin A, Marie N, Auduc S, et al. Neutron and light-charged-particle productions in proton-induced reactions on 208Pb at 62.9 MeV. Eur Phys J A. 2005;23:49–60.
- Meier MM, Clark DA, Goulding CA, et al. Differential neutron production cross sections and neutron yields from stopping-length targets for 113-MeV protons. Nucl Sci Eng. 1989;102(3):310–321.
- Meier MM, Amian WB, Goulding CA, et al. Differential neutron production cross sections for 256-MeV protons. Nucl Sci Eng. 1992;110(3):289–298.
- Amian WB, Byrd RC, Clark DA, et al. Differential neutron production cross sections for 597 MeV protons. Nucl Sci Eng. 1993;115(1):1–12.
- Cugnon J, Henrotte P. The low-energy limit of validity of the intranuclear cascade model. Eur Phys J A. 2003;16:393–407.
- Bishop CM. Pattern recognition and machine learning. New York: Springer; 2010.
- Dempster AP, Laird NM, Rubin DB. Maximum likelihood from incomplete data via the EM algorithm. J R Stat Soc Series B Stat Methodol. 1977;39:1,1–38.
- Efron B, Tibshirani R. Bootstrap methods for standard errors, confidence intervals, and other measures of statistical accuracy. Statist Sci. 1986;1(1):54–77.
- Serber R. Nuclear reactions at high energies. Phys Rev. 1947;72:1114–1115.
- Iwamoto H, Imamura M, Koba Y, et al. Proton-production double-differential cross sections for 300-MeV and 392-MeV proton-induced reactions. Phys Rev C. 2010;82:034604.
- Beck SM, Powell CA. Proton and deuteron double differential cross sections at angles from 10 degree to 60 degree from Be, C, Al, Fe, Cu, Ge, W and Pb under 558-MeV proton irradiation. United States: NASA Langley Research Center; 1976. (NASA-TN-D-8119).
- Iwamoto O. Development of a comprehensive code for nuclear data evaluation, CCONE, and validation using neutron-induced cross sections for uranium isotopes. J Nucl Sci Technol. 2007;44(5):687–697.
- Meigo S-I, Takada H, Chiba S, et al. Measurements of neutron spectra produced from a thick lead target bombarded with 0.5 and 1.5 GeV protons. Nucl Instrum Methods Phys Res A. 1999;431:521–530.
- PHITS user’s manual [Internet]. Tokai: Japan Atomic Energy Agency; [ cited 2019 Sep 1]. Available from: https://phits.jaea.go.jp/manual/manualE-phits.pdf
- Iwamoto H, Meigo S-I. Validation of PHITS spallation models from the perspective of the shielding design of transmutation experimental facility. EPJ Web of Conference. 2017;153:01016.