
 ?Mathematical formulae have been encoded as MathML and are displayed in this HTML version using MathJax in order to improve their display. Uncheck the box to turn MathJax off. This feature requires Javascript. Click on a formula to zoom.
ABSTRACT
In order to develop a glass production method that inhibits formation of the Mo-bearing secondary phase, the so-called yellow phase (YP), and also to clarify its formation behavior, vitrification tests using a small-scale liquid-fed ceramic melter (LFCM) were conducted. Chemically simulated PUREX liquid waste containing Na, Mo and other fission elements was fed into a molten glass pool in the melter together with several sizes of feed glass. When the glass beads with a diameter of around 2 mm were fed, some YP was contained in the vitrified glass products at 25 wt% waste loading. While, almost no YP was detected in the glass products when glass powder with a diameter of less than 63 μm was used. The microscopic analysis of the cold-cap samples revealed that powderization of the feed glass contributed to the facilitation of Na dissolution to the feed glass in the cold-cap. This quick intake of Na to the feed glass prevented the formation of liquid Na2MoO4 aggregation and provided homogeneous Mo dispersion in the cold-cap with forms of alkali earth and/or rare earth molybdates. The homogeneous dispersion of Mo resulted in the fast and complete dissolution of Mo in the glass melt.
1. Introduction
Reprocessing of spent nuclear fuel by wet processes such as the PUREX process generates highly radioactive liquid waste in which processed raffinate, alkali scrubbing solution, analytical waste, and so forth are included. This liquid waste is a nitric acid solution and contains many elements: fission products, corrosion products, sulfur from analytical waste, phosphorus and sodium from the scrubbing solution. For safe storage and disposal, the waste is stabilized by vitrification in most countries [Citation1,Citation2]. At the Japanese reprocessing plants, the waste is vitrified using a ‘liquid-fed ceramic melter’ (LFCM) [Citation3]. In this melter system, the liquid waste together with glass formers (borosilicate glass beads for the Rokkasho reprocessing plant) is fed continuously into the melter in which the molten glass pool is formed by Joule-heating. The fed waste and the glass beads are calcinated on the top of the glass pool. During the calcination, the waste is dehydrated, denitrated and then becomes oxide, while the glass beads start to fuse. The calcined waste gradually dissolves in the fused beads and finally becomes homogeneous melt in the molten glass pool. Since this calcined layer seems to be a cap of the glass pool, the layer is called ‘cold-cap’. Controlling the size and the inside reactions of the cold-cap is crucial for the quality control of the vitrified product and also for stable melter operation.
Similar vitrification method using LFCM is also adopted in Germany [Citation4]. However, all the vitrification program in Germany has finished by 2010. The other countries such as France and the United States employed different vitrification methods. French melter is a metallic melter which is heated by induction heat [Citation5]. The wastes are pre-heated in a calciner to make dry waste frit. This waste frit and glass material are fed together to the melter. In the United States, the main wastes to be vitrified are historical defense wastes, and slurry which is a mixture of the waste solution and glass reagents is fed to a melter [Citation6,Citation7]. Either way, the composition of the wastes, the conditions of the cold-cap and the operation method of the melter are different from each other. It is thus required for each country to develop their own vitrification technology.
To understand chemical reactions in the cold-cap is one of the most important challenges for further stable operation of the melter. However, previous scientific study was mainly focused on the properties of the vitrified products and very few attentions for the vitrification process. The chemical information about the reaction in the cold-cap in the Rokkasho plant has not been sufficiently obtained. In order to obtain further detailed information about the structure, temperature distribution and chemical reactions in the cold-cap, a small-scale LFCM has been installed in our laboratory and operated since 2011. Although this test melter has about a 1/800 smaller glass pool volume (15 × 15 × 20 cm3) than the actual melter at the Rokkasho plant, the melter design and operation systems closely resemble those of the actual melter: Joule-heating, ceramic refractory wall, continuous direct feed of liquid waste and glass material from the melter top, bottom drain of the molten glass. Therefore, this test melter is useful to predict and elucidate the phenomena occurring in the actual melter.
Our recent research has focused on the development of melter operation techniques to achieve higher loading of the waste into borosilicate glass than the current loading of about 15 wt% at the Rokkasho plant [Citation3]. The increase of the loading contributes not only to the reduction of the waste volume, but it may also play an important role when treating wastes that are generated from high burnup or MOX fuels [Citation8]. One of the required technical developments is the complete dissolution of Mo in the molten glass even at higher waste loading. Fission product Mo has low solubility in borosilicate glass (practically about 3 wt% in MoO3 form [Citation9]) and also has slow dissolution kinetics. It is thus predisposed to remain in the glass product as an undissolved secondary phase at the higher waste loading condition. This secondary Mo phase is mainly composed of sodium molybdate (Na2MoO4) and some minor elements such as other alkali elements, alkali earth elements, rare earth elements, actinides and some anions such as Tc, Cr, S, P may be included [Citation10]. Due to its yellow color given by Cr(VI), this secondary phase is generally called the ‘yellow phase (YP)’. Since YP is a water-soluble compound, any remaining YP in the vitrified product may affect the migration behavior of the radioactive nuclei when the vitrified waste is disposed in underground.
If other types of the glass waste form such as iron phosphate glass [Citation11] and glass-ceramics [Citation12,Citation13] can be used, it may be possible to avoid the formation of the secondary Mo phase even at high loading condition. There is also an idea to remove Mo from the waste solution before the vitirification process [Citation14]. Those ideas would however be difficult to adopt to the current Rokkasho vitrification system in a short term.
In this study, to enhance the reaction between the fed waste and glass in the cold-cap, not only glass beads but also smaller glass powders were used as the feed glass. The increase of the surface area of the feed glass and homogeneity of the cold-cap should facilitate dissolution of the waste into the glass. The relation between the amounts of YP contained in the vitrified products and the size of the feed glass was evaluated. The ‘live’ cold-cap formed on the molten glass was obtained without destroying its shape. The vertical section of each cold-cap sample was observed by electron microscopes. Through the analysis of the cold-cap structures and their elemental distributions, the effect of powderization and the mechanisms of YP formation were elucidated mainly from the chemical point of view.
2. Experimental
2.1 Small-scale LFCM and its operation
The schematic image of the small-scale LFCM is shown in . The glass melting chamber was 15 × 15 × 20 cm3. Two rectangular electrodes were attached to the opposite chamber walls. As an initial setting, 5 kg of glass was loaded in the melter. The glass was heated by a ceiling heater initially at start-up, and after the glass temperature reached around 1100 K, Joule heating was applied with 3.6–4.8 kW and maintained during the tests. Two thermocouples with Pt sheath were directly inserted in the molten glass. One thermocouple was held at the middle level of the glass pool (6 cm higher from the bottom) where the glass temperature was the highest, and the other was inserted to the bottom. The glass temperature measured by the former thermocouple was maintained around 1373–1473 K. The waste solution and the feed glass were then fed onto the molten glass through feed ports located in the center of the top lid. This lid also had three viewing windows which were not only for observation of the inside conditions of the melter but also for access ports to obtain cold-cap samples. The molten glass was drained into a cylindrical stainless-steel container (a canister) through a hole located at the bottom side of the chamber wall by removing the Inconel plug. Off-gas including steam and NOx was continuously evacuated from the melter with a flow rate of 100 dm3/min. Details of the melter properties and operation methods are also described in reference [Citation15].
Figure 1. Schematic image of small-scale LFCM.
2.2 Vitrification tests
Two types of feed glass were prepared. One was glass beads which were almost the same as those used in the Rokkasho plant and were composed of seven oxides; SiO2, B2O3, Na2O, Al2O3, CaO, Li2O, and ZnO. The diameters of the beads were 2 ± 1 mm. Some of the beads were milled to make powder-type feed material. The milled glass powder was then sieved for classification into four sizes: 250–500, 125–250, 63–125 and <63 μm. The composition of the glass beads and the powders were thus identical. The quantitative feed of the beads and the powders was performed by an oscillation feeder and a roller feeder, respectively. The composition of the chemically simulated waste solution used for the tests is shown in . The values shown in the table are the concentration of each element in oxide form. The solution was 2 mol dm−3 nitric acid and all the elements except Mo were added with nitrate forms and Mo was with Na2MoO4. Platinum group metals (Ru, Rh, and Pd) were substituted by Fe, Co and Ni. A peristaltic pump was used for the volumetric feed of the solution. The glass powder and the waste solution were mixed together just before entering into the melter to prevent the powder from scattering.
Table 1. Composition of simulated liquid waste and glass product.
In this study, the fraction of the waste oxide (except Na2O) loaded into the glass product was set at 25 wt% which is higher than the loading fraction of the Rokkasho plant at around 15 wt% [Citation3]. At this loading, the concentration of MoO3, 2.81 wt% in , is still less than its solubility limit. The concentration of Na2O was set at 10 wt% which was the same as the targeted value of the Rokkasho product [Citation3]. The feed rates of the solution and the glass material were at 0.65 dm3 h−1 and 141 g h−1, respectively, and the feed in each test was continued for 7.2 h. This feed produced 1.5 kg glass in the melter. Therefore, after feeding, 1.5 kg molten glass was drained at the end of every test. The amount of glass remaining in the melter was thus again set at the initial mass of 5 kg in readiness for the next feed test. The test using glass beads was conducted first. The test was repeated 6 times with the same conditions. Then the feed glass was changed to the glass powder and continued with another five batches. Each of the four classified powders was used in each batch from larger to smaller and the smallest powder was used twice.
To obtain a cold-cap sample of each batch, a spoon-shaped sampling tool was inserted into the melter through the viewing window and the ‘live’ cold-cap was scooped without destroying its shape except for the test using 250–500 μm glass powder. Sampling for the 250–500 μm test failed with only an insignificant part of the cold-cap being obtained due to its shapeless structure described later in Section 3.2.
2.3 Analytical method
The amount of YP contained in the drained glass was evaluated from the amount of water-soluble molybdates since YP was mainly composed of readily soluble Na2MoO4. Some amounts of YP were observed on the surface of the drained glass. These were first dissolved in pure water and recovered. Then, the drained glass was taken out of the container by striking it with a hammer since the glass and the container had strongly adhered to each other. About 50 g of the glass fragments generated by the striking action were randomly sampled, and were further crushed, milled to make powder less than 0.1 mm, and then shaken with pure water to dissolve YP. The concentrations of Mo in the above two solutions were measured by ICP-AES (Thermo Scientific, iCAP6000).
The collected cold-cap samples were encased in epoxy resin and then cut vertically. The cut surface was polished by sand paper from #400 to #1600 without using any solutions. Elemental distributions of the polished sample surface were determined by wavelength-dispersive X-ray spectroscopy (WDS) using scanning electron microscopes (SEM) (JEOL, JXA-8230). And the phase compositions were analyzed by energy-dispersive X-ray spectroscopy (EDS) (FEI, Quanta250FEG). This analysis was performed by a semi-quantitative analysis (EDAX, TEAM) determined from each specific energy peak area without using standards.
2.4 Thermodynamic equilibrium calculation
To understand the chemical reaction in the cold-cap, thermodynamic equilibrium calculations using commercially available software FactSageTM was performed. In these calculations, initial molar ratio of components and equilibrium temperature were input in the software, and the possible combinations of the generated compounds and their composition under the equilibrium conditions were calculated. Two thermodynamic databases of FactPS for pure substances and FToxide for solution phases consisting of multi oxides were used. Generation of gas phase was omitted from the calculation to save the calculation time.
3. Results and discussion
3.1 Amounts of YP in glass products
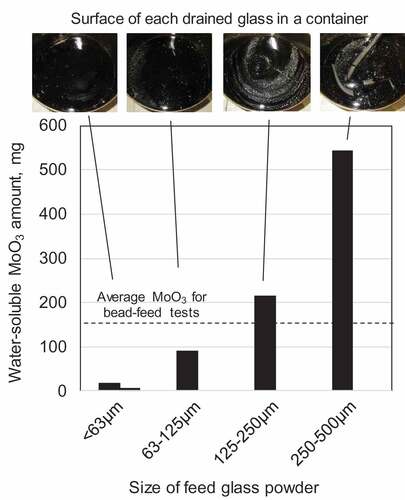
In the tests using the glass beads, yellow-colored secondary phases, namely YP, were clearly observed on the surfaces of all the six drained glasses or glass products. The quantitative analysis revealed that the average of the water-soluble Mo (shown in mass of MoO3 form) was 157 mg per each 1.5 kg glass product. However, the mass of YP contained in each product was varied among 55 and 368 mg even though all the six batches were carried out in the same manner. This was because YP was heterogeneously distributed in the molten glass pool and only 1.5 kg of the glass was drained from the total 6.5 kg glass pool at each test. Another reason was mass balance of the Mo between the mass dissolved in the glass and the mass formed YP. The total mass of Mo added at one batch was about 42 g, and more than 99% of the Mo were dissolved in the glass and less than 1% formed YP. Considering this mass balance, the deviation among 55 and 368 mg could be reasonably small. shows the mass of YP for the tests using the glass powders. The dashed line in the figure shows the average YP amount in the beads tests. Even considering the large variation in the YP amount among the bead tests described above, the results clearly indicate that the amount of YP decreased with the decrease in the powder size. Visual observation of the surface of the glass products shown in the top of also suggests the decrease of the secondary phase. Almost no secondary phase was observed from the two glass products using powder less than 63 μm.
Figure 2. YP amounts contained in each powder-feed test. The top photos show the observed YP on the surface of each glass product.
3.2 Cold-cap conditions
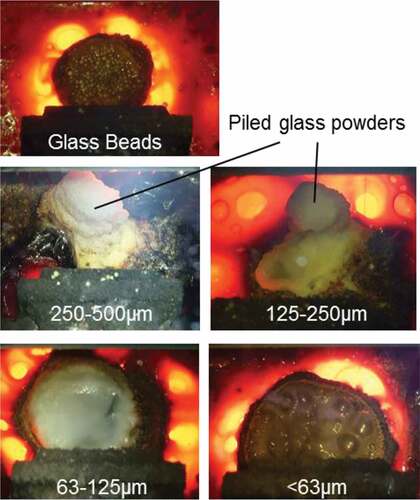
The shape and condition of the cold-cap were observed through the viewing window on the melter. The pictures in are of a typical cold-cap formed on the molten glass pool in each test. The cold-cap formed in the test using glass beads was round in shape and had a pond-like structure, which had a thick rim made of calcined waste. The mixture of the waste solution and the beads stayed inside the rim bank. On the other hand, a shapeless cold-cap formed in the tests using glass powders especially for the larger two powders. These glass powders behaved independently from the waste solution in the cold-cap and formed upward, snow-like piles. The piled powder finally collapsed and started piling up again periodically. Indeterminate shapes of the cold-caps were derived from this piling and collapsing behavior. The amounts of YP in these two tests were larger than the average YP in the tests using glass beads (see ). This might be due to the segregation between the glass powder and the waste solution in the cold-cap. The cold-caps for the smaller two glass powders bore a closer resemblance to that in the bead-feed tests except for the outer rim. The outer rims of these two were very thin and almost no bank existed. Thus, the inner solution-glass mixture overflowed easily from the cold-cap and the spilt mixture immediately dried out there. This overflowing behavior deformed the round shape of the cold-cap. However, the waste solution and the glass powder were homogeneously mixed in the cold-cap, and they overflowed together all the time.
Figure 3. Typical cold-cap conditions of bead-feed and powder-feed tests.
3.3 Elemental distribution in cold-cap samples
In order to elucidate the powderization effect on the YP reduction, cross-sections of the obtained cold-cap samples were observed by SEM. Maps on the elemental distributions of Si, Mo, and Nd are shown in . These three elements are major and representative components of glass, YP and fission products, respectively. There was a wide temperature gap between the top and bottom of the obtained sample. The top temperature was around 373 K since the fed waste solution boiled there. The bottom temperature was close to the bulk molten glass temperature which was around 1400 K. The fed waste and glass material shifted in the cold-cap from the top to the bottom with the increase in the temperature. Although there was no apparent border between the cold-cap and the bulk molten glass, each sample can be largely divided into two regions for descriptive purposes: the upper ‘cold-cap’ region where the fed glass retained its shape without fusing, and the lower ‘molten-glass’ region where the temperature was high enough to deform and fuse the feed glass. The two regions were partitioned by the SEM observation of the fed glass morphology whether the glass was fused or not, and the boundary was shown by white dashed lines on Si mappings. The feed glass starts to deform around 920–970 K; thus, the temperature of the boundary of the two regions was roughly estimated to be around that point.
Figure 4. Elemental distributions of Si, Mo, and Nd on vertical sections of the cold-cap samples. White dashed lines on Si mappings show the boundary of the upper cold-cap region and lower molten-glass region.
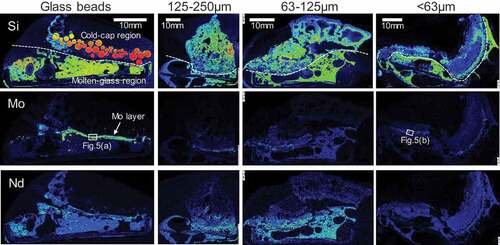
For the bead test sample, specific distribution of Mo was observed. A concentrated Mo layer formed near the boundary. The composition of this Mo layer was identified mainly as Na2MoO4 by EDS (see )). The same Mo condensed layer was observed as well from the previous bead-feed tests [Citation15]. This layer was presumably a liquid phase since the melting point of Na2MoO4 is 960 K [Citation16] which corresponded to the expected boundary temperature. In other words, this Mo layer formed due to the aggregation of fused Na2MoO4. The slow dissolution kinetics of YP could be attributed to the liquid aggregation of Na2MoO4 and decrease of its contact surface area. The relevance of this is also discussed in reference [Citation15]. The reason why fused Na2MoO4 formed ‘layer’ instead of spherical droplet is unknown. One considerable reason is its wetting property. From the previous experience, liquid YP is well wet to glass and oxide ceramics. The fused Na2MoO4 might have wet on the molten glass layer or soaked into the inter-particles of the other oxides by capillary effect.
Figure 5. Backscattered electron images near the boundary between the cold-cap and molten-glass regions for the bead-feed (a) and the powder-feed (<63 μm) (b) samples. The observation areas are marked in . Quantitative analysis by EDS was conducted for the points indicated by arrows, circular, and triangular areas with numbers. The analytical results are shown in .
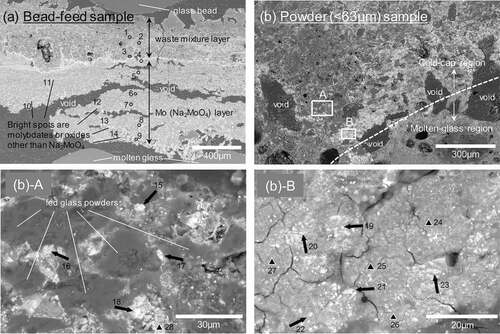
On the other hand, no specific Mo layer was observed from the samples of the powder-feed tests. Slightly concentrated Mo parts may be seen near the boundary for the larger powder samples, but those parts disappeared for the smaller samples. The distribution of Mo resembled that of the other fission products such as Nd. It seems that the powder-feed contributed to prevention of the aggregation and maintenance of high dispersibility of Mo in the cold-cap, which resulted in fast dissolution of Mo in the molten glass.
3.4 Details of compositions of cold-cap components
Improvement of the sub-millimeter scale homogeneity between the feed glass and the waste is undoubtedly one of the reasons that high dispersibility of Mo is tolerable dimensionally. However, we focus on other chemical reasons that contributed to the Mo dispersion and discuss them further here. Chemical forms of Mo in the vicinity of the boundary of the two regions were determined by SEM-EDS and are shown in . Composition of each point shown in the figure is summarized in . The top left image (a) was a boundary of the bead test. A ‘sea’ of Na2MoO4 was observed directly above the molten glass region, and some white spots comprised other molybdates and oxides were detected in the sea like ‘islands.’ On the other hand, no such bulk scale or even single droplet of Na2MoO4 was observed from the powder (<63 μm) test sample shown in the top right image (b). It seems that waste and glass powders were mixed well together in the cold-cap region. To determine the composition of Mo near the boundary, two areas (area A and B) were selected and further magnified. Bright white spots indicated by thick arrows were composed of Mo, Ba, Sr, Na, O and the elemental ratio Mo:Ba:Sr:Na was 10:10:2:0–3. Thus, the major chemical form would be BaMoO4. The slightly pale white area marked with solid triangles contained Mo, LN (Nd+other lanthanides (La, Ce, Gd)), Ca, Na and several other waste elements, and the ratio in this order was 10:3–11:2–7:1–3:0–9. The main components were presumed to be a mixture of LN2(MoO4)3 and CaMoO4. The ratio of Na was very small in both phases, and there was no apparent pure Na2MoO4 in the samples. Melting points of alkali-earth molybdates, either Ba-, Sr- or Ca-MoO4, are around 1720 K which is sufficiently higher than the molten glass temperature. Melting points of molybdates with lanthanoids increase along with the mass number of the lanthanoids; the lowest La2(MoO4)3 is slightly above 1273 K [Citation17], Nd2(MoO4)3 is around 1360 K [Citation17] and Gd2(MoO4)3 is 1420 K [Citation17]. The small amounts of Na contained in lanthanoid molybdates increase their melting points [Citation17]. The mixture of lanthanoid molybdates and alkali-earth molybdates forms eutectic compounds [Citation18], and thus the melting point of the mixture decreases several tens of degrees from that of the pure lanthanoid molybdate. However, this temperature is still higher than the boundary temperature, 920–970 K. Therefore, the high dispersibility of Mo in the powder-feed samples was provided by the formation of solid-state molybdates and the avoidance of liquid aggregation observed in the bead-feed sample.
Table 2. Composition of each analytical spot shown in (mol%).
Compositions of the glass-powder particles located in the cold-cap regions near the boundary for ) were examined by EDS. The elemental ratio of Na/Si of each powder particle was plotted in the upward distance from the boundary in . The ratio increased as the distance to the boundary decreased. This was because the Na that was originally contained in the waste solution gradually transferred into the glass particles with the increase in temperature. It seems that the ratio near the boundary is constant, and the ratio corresponded well with that of the final composition of the glass product Na/Si = 0.48. This result indicates that all the Na in the liquid waste was fully transferred into the glass before the glass started fusing, and this might be the reason why the Mo could form solid molybdates without forming Na2MoO4.
Figure 6. Alteration of the elemental ratio of Na/Si in fed glass powders relating to the upward distance from the boundary between the cold-cap and molten-glass regions. The dashed line shows final Na/Si ratio of the vitrified products.
3.5 Thermodynamic calculations of glass-MoO3-Na2O system
Thermodynamic equilibrium calculation using a commercially available software, FactSageTM, was conducted to understand equilibria among the glass-MoO3-Na2O-BaO system and to confirm the validity of the phenomena observed in the above EDS analysis. In this software, several solution models for oxide mixtures are integrated, which enables further realistic and accurate equilibrium calculations for molten glass. Although these models contain no database on the compatibility between glass and molybdates, the calculation results are reliable due to the negligibly low solubility of molybdates in the glass at least for the target cold-cap temperature range, up to 1100 K. All the calculations were conducted for the temperature range of 573 to 1573 K with increments of 100 K to observe the possible equilibrium across the entire temperature range in the melter.
The equilibrium calculation was started from the simple MoO3-Na2O-BaO ternary system with no glass component. This ternary system is used to confirm relative stability between Na2MoO4 and BaMoO4, which were the major molybdate forms observed in . Then, the glass components of SiO2, B2O3 and CaO were added into the system step by step to understand the role of each glass component. shows a summary of the calculation results. Due to the instability of MoO3 and Na2O, these two oxides are predisposed to forming Na2MoO4 in the ternary MoO3-Na2O-BaO system across the entire temperature range and no BaMoO4 is formed (calculation 1). When Na was added in nitrate form as NaNO3 (calculation 2) to the ternary system, BaMoO4 formed at a lower temperature and Na2MoO4 started to form at temperatures higher than 873 K. This was because Na was stabilized by nitrate and thus MoO3 could combine with BaO. However, denitration of NaNO3 and formation of Na2O occurred around 873 K, which concluded in the same reaction as calculation 1. Thus, counter acidic compounds to combine with Na2O even at a higher temperature are required to maintain BaMoO4. Calculations 3 to 5 are systems in which the primary components of the glass, SiO2 and B2O3, are included (as counter compounds). The ratios of the initial components are set to be equal to the final glass composition of the above melter experiments. In the case of SiO2, Na2O was stabilized by the formation of Na2Si2O5 and BaMoO4 formed at below 673 K. The addition of B2O3 can stabilize Na up to 873 K with forms of mainly NaBO2 and slight Na2B4O7. The co-addition of SiO2 and B2O3 is more effective and Na formed NaBSiO4 below 973 K. It seems NaBSiO4 is an important compound for holding Na in the cold-cap. However, either system produced Na2MoO4 at higher temperature. The addition of SiO2 and B2O3 alone was not enough to keep Na2O away from MoO3. Even if the glass held Na and BaMoO4 formed at a lower temperature, Na and Ba finally switched at a higher temperature. This was because BaO was very stable in the silicate and borosilicate melts. From the FactSage calculation results, the activity of BaO in those melts was substantially (about three or four orders of magnitude) lower than that of the other alkali earth oxides such as CaO. The addition of CaO in the system as a support cation to hold MoO3 at higher temperature would thus be important to avoid Na2MoO4 formation across the entire temperature range in the melter. Calculation 6 confirms the CaO effect and is also the most realistic calculation simulating the actual experiments. As was expected, MoO3 formed BaMoO4 below 873 K and the chemical form changed to CaMoO4 over 973 K. The formation of Na2MoO4 was successfully prevented across the entire temperature range, which could explain the observations obtained in the cold-cap samples of powder-feed tests.
Table 3. Results of equilibrium calculations for glass-MoO3-Na2O-BaO system.
Calculation 7 is the condition when excess Na2O is added to the system. In this case, Na2MoO4 again formed over 873 K. From calculation 5, Na was mainly stabilized by the form of NaBSiO4 and from the stoichiometry, B2O3 can hold Na2O up to 1:1. The excess addition of more Na2O than Na2O/B2O3 >1 in calculation 7 might thus have resulted in the formation of Na2MoO4. The Na2O/B2O3 ratio increases with the increase in the waste loading since the ratio of the waste (= Na2O) to the glass (= B2O3) increases. However, the loading can increase up to 29.8 wt% by maintaining the Na2O/B2O3 ratio at less than one. In other words, current waste loadings in these experiments, 25 wt%, or in the Rokkasho plant, around 15 wt%, are low enough to have sufficient B2O3 over Na2O.
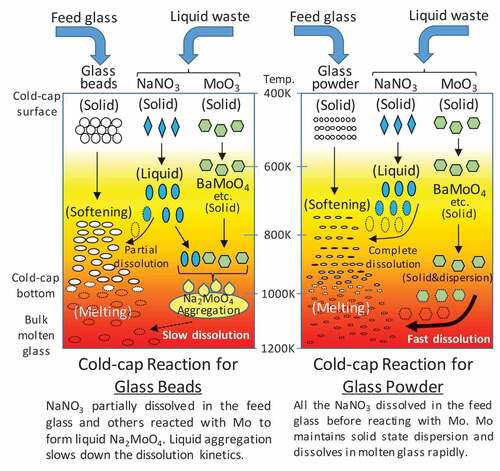
The above calculations reveal two important points. The first relates to the formation of Na2MoO4. shows our concluded reaction model in the cold-cap. When considering the thermodynamic equilibrium conditions, Na2MoO4 does not form at any stage of the vitrification process. In either bead-feed or powder-feed, MoO3 mainly combined with alkali earth elements at the initial calcination stage in the cold-cap while Na2O forms NaNO3 and gradually transfers to the feed glass. However, when the transfer of Na2O to the glass is slow, excess Na2O is locally produced by the decomposition of NaNO3 and reacts with Mo to form Na2MoO4. From the EDS analysis in ), higher amounts of Na were detected in the waste mixture layer (which was above the Na2MoO4 layer). These were the Na that did not react with the glass beads but would react with Mo at a later stage in the lower Na2MoO4 layer. Also, some of the BaMoO4 phases observed as bright spots in the Na2MoO4 layer might be initially formed molybdate surviving without reacting with Na2O. Therefore, the second point, fast dissolution of Na2O into the feed glass is a key to the prevention of Na2MoO4 formation. Powderization of feed glass is effective for providing faster transfer of Na2O in terms of both larger contact surface and shorter diffusion distance.
Figure 7. Cold-cap reaction model regarding ternary glass-NaNO3-MoO3 derived from experimental and thermodynamic calculation results. The left is the model for the bead feed and the right is for the powder feed.
shows the transfer rate of Na into the feed glass depending on the glass particle size. The rate was estimated by the one-dimensional diffusion model in a spherical body. This estimation was made under the hypotheses that all the fed Na located on the surface of the fed glass homogeneously in the initial condition and the transfer of the Na from the outside to the inside at the boundary of the glass surface is negligibly fast. The Na then transfers from the surface to the center of the spherical glass particle with one-dimensional diffusion. The Na2O concentration at the surface was set to be a constant value at 10 wt% which was the final Na2O concentration of the vitrified product. The mean concentration of Na2O in the particle thus increased up to the maximum 10 wt% with time, and once it reaches the 10 wt% it means that the fed Na is fully transferred into the feed glass. In the actual calculation, the following discretization equation was solved by using Microsoft EXCEL with 2 μm mesh (Δr) and time step (Δt) of 0.01 s.
Figure 8. Alteration of Na2O concentration in the feed glass depending on the glass size. The vertical axis shows the mean Na2O concentration in the feed glass particle estimated from the one-dimensional diffusion model in the spherical body. The maximum Na2O concentration was equal to the final concentration in the vitrified product, 10 wt%. The left graph is for DNa = 10−12 m2/s and the right graph is for DNa = 10−11 m2/s.
Here, cn(t) is the Na2O concentration at nth mesh at time t, DNa is diffusion coefficients of Na, rn is the radius of nth mesh. From the literature data of similar glass compositions [Citation19,Citation20], the diffusion coefficients of Na (DNa) in our glass were estimated to be around 10−12–10−11 m2/s below the glass fusing temperature of 773–873 K. When the particle size was 64 μm, the mean Na2O concentration reached 10 wt% within 1 min at DNa = 10−11 m2/s. Even at DNa = 10−12 m2/s, more than 95% of Na was transferred in 5 min. This transfer rate of Na would probably be fast enough for the melting rate of the cold-cap described in Section 3.6, which shows that the fed glass would take about 10 min to start fusing. On the other hand, the transfer rate of Na decreased with the increase in the particle size. The 2 mm beads absorbed only 25% of the fed Na in 10 min even in the fast case of DNa = 10−11 m2/s. The other 75% of Na which remained outside the feed glass would become candidates for the reaction with Mo. Although the above estimation is quite simple and rough, the estimated transfer rates agreed well with the experimental and thermodynamic calculation results. This estimation significantly shows the effectiveness of the powderization at this initial stage of the study.
3.6 Melting rate of cold-cap
In addition to the YP suppression effect, another advantage regarding the melting rate of the cold-cap was observed from the powder-feed test. The melting rate of each cold-cap was roughly estimated from the time required for complete dissolution of the cold-cap into the molten glass pool after feeding was stopped at the end of each test. The dissolution time was measured by visual observation of the cold-cap. The results are shown in . The dissolution time decreased with the decrease in the powder size. Nearly 20 minutes were required in the case of the glass beads. Larger glass powder required more time than the glass beads, which was due to the pile up phenomenon described above. Whereas, the time was almost halved for the glass powder of less than 63 μm. Another advantage of powderization of the feed glass is that it may improve the production speed in the vitrification process. The actual melting time of the cold-cap might be longer than the above dissolution time due to the steady existence of the waste pool in the center as a heatsink. However, the obtained dissolution time scale, to the order of 101 minutes, will be a topic for next stage discussion and further understanding of the cold-cap reactions including kinetics.
Figure 9. Relationship between size of fed glass powder and dissolution time of the cold-cap. The dashed line shows the average dissolution time for the bead-feed tests.
As was described in the above sessions, the feed of glass powder was advantageous for the suppression of YP generation and the increase of the throughput of the melter. However, several drawbacks were also revealed: difficulty of the quantitative feeding and increase of the amount of off-gas transfer. Handling of the glass powder was more difficult than that of the beads. The powder got easily stuck in the feeding system, flew and traveled to the off-gas treatment system and they caused clogging the off-gas pipes. Taking into account a practical use, feed of other type of the glass materials, which have large surface area as powder, e.g. fiber cartridge and porous glass, may be adequate for the vitrification process. Furthermore, as a future work, it is important to confirm whether the same reaction in the cold-cap would occur in the actual melter at the Rokkasho plant or not. Scale-up and eventually full mock-up tests will be required for this confirmation. These larger scale tests will also provide important information regarding the physical influences on the cold-cap, which are, e.g. the influence of the thermal balance in the melter and the convection of the molten glass.
4. Conclusion
In the vitrification process of liquid waste generated from PUREX reprocessing of spent nuclear fuel, the feeding of smaller glass powder instead of larger glass beads or grains decreased the Mo-bearing undissolved secondary phase, namely YP, contained in the vitrified product. This was because smaller glass powder facilitates the cold-cap reaction especially for the Na dissolution reaction. All the Na contained originally in the liquid waste rapidly dissolved into the feed glass at the early stage of the calcination in the cold-cap before reacting with Mo. This quick intake of Na inhibited the formation of liquid Na2MoO4 while enabling the formation of solid molybdates combined with alkali earth and/or rare earth elements. These solid molybdates dispersed homogeneously in the cold-cap, which resulted in the fast dissolution of molybdates in the molten glass at a later stage of the process in the melter.
Acknowledgments
This work was carried out as a part of the basic research programs of vitrification technology for waste volume reduction supported by the Ministry of Economy, Trade and Industry, Japan.
Disclosure statement
No potential conflict of interest was reported by the authors.
References
- Donald IW, Metcalfe BL, Taylor RNJ. The immobilization of high level radioactive wastes using ceramics and glasses. J Mater Sci. 1997;32(22):5851–5887.
- National research council of the national academies. Waste forms technology and performance: final report. Washington D.C.: The national academies press; 2011. p. 29–86.
- Sakai A, Koikegami H, Miura N, et al. Development of glass melter technology for HLLW vitrification in Japan. Proc. Int. Conference Nucl. Eng; 2014 Jul 7–11; Prague (Czech Republic): ICONE. p. Code109131.
- Fleisch J, Gruenewald W, Roth G, et al. Cold test operation of the German VEK vitrification plant-8326. Proc. Int. Conference Waste Management; 2008 Feb 24–28; Phoenix, AZ, USA.
- Petitjean V, De Vera R, Hollebecque JF, et al. La Hague continuous improvement program; enhancement of the vitrification throughput. Proc. Int. Conference Waste management; 2006 Feb 26–Mar 2; Tucson, AZ, USA.
- Marra SL, Peeler DK, Occhipinti JE, et al. The Savannah River site accelerated clean-up mission; sludge retrieval and immobilization. Proc. Int. Conference Waste management; 2003 Feb 23–27; Tucson, AZ, USA.
- French RT, Wodrich DD. The office of river protection – managing and disposing of Hanford site’s high-level waste. Proc. Int. Conference Waste management; 2000 Feb 27–Mar 2; Tucson, AZ, USA.
- Kawai K, Sagara H, Takeshita K, et al. High burn-up operation and MOX burning in LWR; effects of burn-up and extended cooling period of spent fuel on vitrification and disposal. J Nucl Sci Technol. 2018;55(10):1130–1140.
- Caurant D, Majerus O, Fadel E, et al. Effect of molybdenum on the structure and on the crystallization of SiO2-Na2O-CaO-B2O3 glasses. J Am Ceram Soc. 2007;90(3):774–783.
- Usami T, Uruga K, Tsukada T, et al. Properties of crystalline phase in waste glass. Proc Global; 2013 Sep 29–Oct 3. Salt Lake City (US); p. Paper8171.
- Bai J, Hsu J, Sandineni P, et al. The structure and properties of cesium loaded Mo-Fe-phosphate glasses. J Non-Crystal Sol. 2019;510:121–129.
- Crum JV, Turo L, Riley B, et al. Multi-phase glass-ceramics as a waste form for combined fission products: alkalis, alkaline earths, lanthanides, and transition metals. J Am Ceram Soc. 2012;95(4):1297–1303.
- Pinet O, Hollebecque JF, Hugon I, et al. Glass ceramic for the vitrification of high level waste with a high molybdenum content. J Nucl Mater. 2019;519:121–127.
- Nakase M, Matsuzawa Y, Takeshita K. Continuous separation of molybdenum and zirconium from simulated high-level liquid waste with a Taylor–Couette contactor. J Nucl Sci Technol. 2018;55(11):1317–1323.
- Uruga K, Tsukada T, Usami T, et al. Study for generation of yellow phase using small-scale Joule heating melter. Proc Global; 2015 Sep 20–24; Paris (France), p. Paper5191.
- Ohki M, Ohsawa T, Tanaka M, et al. Kagaku Dai-Jiten. Tokyo: Tokyo Kagaku Doujin; 1989. [ Japanese].
- McHale AE, Roth RS. Phase equilibria diagrams. Vol. XII. Westerville, Ohio: The American Ceramic Society; 1996. Oxides. p. 178.
- Roth RS, Dennis JR, McMurdie HF. Phase diagrams for ceramists. Vol. VI. Westerville, Ohio: The American Ceramic Society; 1987. p. 274&310.
- Kumar S, Rawat N, Kanekar AS, et al. Sodium diffusion in sodium borosilicate glass used for immobilization of high level liquid waste. J Radioanal Nucl Chem. 2007;274(2):225–228.
- Wu X, Diechmann R. Sodium tracer diffusion in glasses of the type (Na2O)0.2[(BO1.5)x(SiO2)1-x]0.8. J Non-Crystal Sol. 2011;357:2846–2856.