 ?Mathematical formulae have been encoded as MathML and are displayed in this HTML version using MathJax in order to improve their display. Uncheck the box to turn MathJax off. This feature requires Javascript. Click on a formula to zoom.
ABSTRACT
The neutron-emission spectrum from a 197Au target excited with a 16.6 ±0.2 MeV, monoenergetic, linearly polarized photon beam was measured using the time-of-flight method at the NewSUBARU-BL01. Two components were clearly detected in the neutron spectrum produced by photonuclear reactions. One component [component (A)] shows an evaporation-like spectrum with energies up to 4 MeV. The spectrum of the other component [component (B)] is shaped like a bump and energies ≥4 MeV. The intensity of the component (A) does not show any definite angular dependence, whereas, that of the component (B) follows the relation [a+ b cos(2Θ)] as a function of the angle Θ between the polarization and detector directions.
1. Introduction
The study of photonuclear reactions is useful for understanding the elementary processes of nuclear physics. To date, experiments on neutron production caused by the photonuclear reactions have been performed much in the region of the giant dipole resonance (GDR). Many of the experimental data are summarized in Refs [Citation1,Citation2]. These references provide the neutron yield, total neutron production, total photoabsorption cross-section, and so on. The photonutron cross-section of a nearly monoenergetic photon beam has been measured by several groups [Citation3–Citation6].
Experimental data on neutron energy spectra for reactions in the GDR region have been reported by several groups [Citation7–Citation16]. These data indicate that the neutron energy spectrum has two components, a low-energy evaporation-process component and a high-energy direct-process component. The angular distribution of the neutrons emitted in the evaporation-process component is isotropic, and the angular distribution of the direct-process component is anisotropic. Hayward [Citation17] shows the polar angle and azimuthal angle dependence of the emitted particle intensity from the photonuclear reaction considering only the electric dipole transition. Since these experiments used bremsstrahlung as a photon source, the incident photons were unpolarized, and the results were averaged over the polarization directions. Therefore, any effect on the photoneutrons due to the polarization of the incident photons did not get observed in these experiments.
In recent years, Laser Compton scattering (LCS) method can be applied by developments of accelerator and laser-physics technologies, and the LCS method allows the use of the polarized photons as a source of the experiment. A monoenergetic LCS photon beam with energies up to 70 MeV is now available for the experimental use at the NewSUBARU-BL01, the University of Hyogo, Japan. The polarization of the LCS photons can be controlled by changing the polarization of the incident laser. By using LCS photons, the neutron-emission yield data are likely to be obtained in the GDR region using monoenergetic photons that include the effects of polarization.
Using a linearly polarized beam, the angular distribution of the emission cross-section for the reaction has previously been measured by Blackston et al. [Citation18]. In addition, the anisotropy of neutron azimuthal angle distributions for photonuclear reactions in the GDR region was measured by Horikawa et al. [Citation19] and Hayakawa et al. [Citation20] with linearly polarized photon beams. Horikawa et al. showed that the intensity of the high-energy component of the photoneutron depends on the azimuthal angle when the incident photon is linearly polarized. Their data indicate that anisotropy depends on emitted neutron energy. Thus, the intensity of the high-energy direct-process component observed in experimental results with bremsstrahlung should depend on the polar and the azimuthal angles, and the intensity of the evaporation-process component is almost isotropic. However, neutron energy spectra have not previously been measured with linearly polarized photons.
This paper describes the experimental methods of the energy spectra of photoneutron in the GDR region using polarized LCS photons, and aims to experimentally demonstrate the polarization dependence of the direct-process component.
2. Experimental
To obtain the neutron spectra and the yields, we have determined both the number of incident photons and the neutron-detector efficiency. For the material of the neutron-production target, we chose Au, since it showed a great dependence on polarization [Citation19].
2.1. Experimental setup
Because an overview of BL01 and the apparatus used to generate the LCS photons are described elsewhere [Citation21,Citation22], only outline is provided in this section.
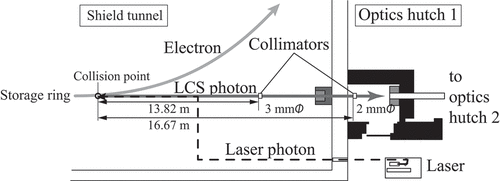
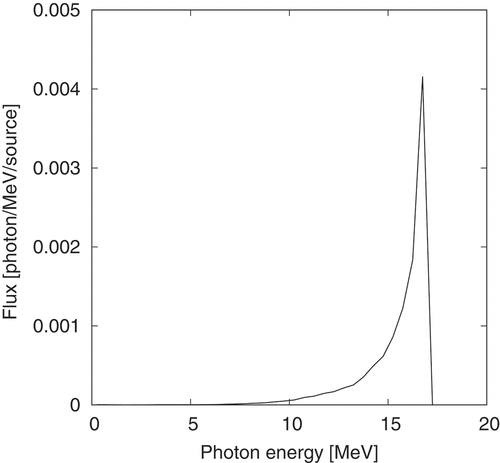
shows a schematic drawing of the BL01. An LCS photon beam was generated by the scattering of laser photons from electrons in the storage ring, which was operated in the single-bunch mode with top-up. During the experiment, the typical stored beam current was 30 mA, and the electron energy was 982.4 MeV. An Nd:YVO laser system provided laser photons at a wavelength of 1.064 µm while the laser power was 20 W. Under these conditions, the maximum energy of the LCS photon beam was 16.95 MeV at a scattering angle of 180°. The LCS photon beam was collimated using two collimators, one with inner diameter of 3 mm at 13.82 m away from the collision point within the straight section of the storage ring in the shield tunnel, and the other with inner diameter of 2 mm in the optics hutch 1 at 16.67 m from the collision point. After passing through these collimators, the beam was led to optics hutch 2. shows the LCS photon spectrum obtained from a simulation by using EGS5 code [Citation23]. As the simulation, the collimator sizes are as described above and other conditions are referred to in [Citation24]. A peak energy of the LCS photon spectrum was obtained 16.6
0.2 MeV (
) with considering the electron beam size of 240 µm and the divergence of 170 µrad.
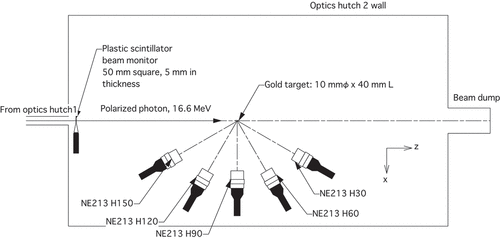
displays a schematic drawing of target and detector layout in the optics hutch 2. At the beam entrance to the hutch, a plastic scintillator plate (PLS) of 10 10 cm
and 0.5 cm thick, coupled to a photomultiplier tube, was placed on the path of the LCS photon beam to monitor the beam intensity. A cylindrical
Au target was placed at 1.4 m downstream from the PLS, with the axis of the target parallel to the beam line. The target was 10 mm in diameter and 40 mm long.
As neutron detectors, five NE213 organic liquid scintillators coupled to photomultiplier tubes were used. Each scintillator was 12.7 cm in diameter and 12.7 cm thick. The positions of the NE213 detectors are shown in and listed in . shows the relationship of the angle symbols used in this paper. shows a schematic drawing showing the polarization directions of the photons. The quantities and
are the polar and the azimuthal angles, respectively, respect to the incident photon beam. The angle
is measured with respect to the z-axis while
is the angle relative to the xz-plane. The H90 detector is located on the x-axis (see ). The other detectors (i.e., H30, H60, H120, and H150) were placed at other angles on the xz-plane.
Figure 4. Schematic diagram showing the relationship of the angle symbols used in this paper. and
are the polar angle and the azimuthal angle, respectively, respect to the incident photon beam.
is the angle between the direction of polarization and direction to one of the detectors.
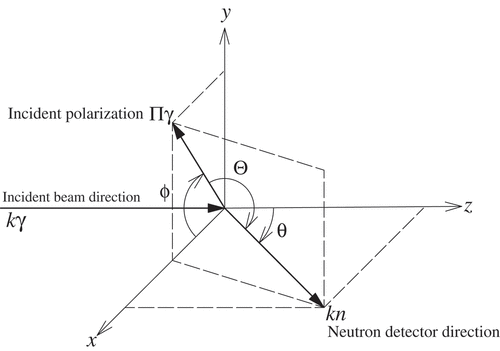
Figure 5. Schematic diagram showing the polarization directions of the photons. (a) Polarization in the direction = 0°. (b) Polarization in the direction
= 90°.
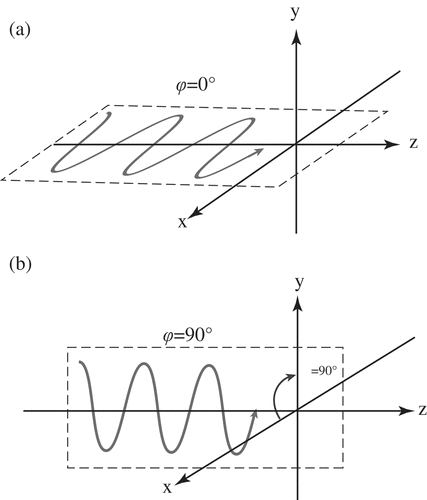
Table 1. Positions of the NE213 detectors. The flight path is the distance from the centre of the target to the front surface of the detector. is the polar angle with respect to the incident photon beam.
The light output of the NE213 detectors was calibrated using Cs,
Na, and
Co
-ray sources prior to the LCS photon beam experiment. The detection efficiencies for each detector were determined as a function of the light output bias.
2.2. Directions of linear polarization
The H30, H60, H90, H120, and H150 detectors were placed on the xz-plane. Since is the z-axis direction, the direction to each of these detectors is expressed in terms of the corresponding unit vectors
. On the other hand, the direction of linear polarization of the photons was restricted to one of the four directions
= 0°, 30°, 60°, or 90° on the xy-plane. Since
is the x-axis direction, as shown in , the direction of the linear polarization is expressed in unit vectors
.
When is the angle between the direction of polarization and direction to one of the detectors,
is given by
2.3. Readout electronics
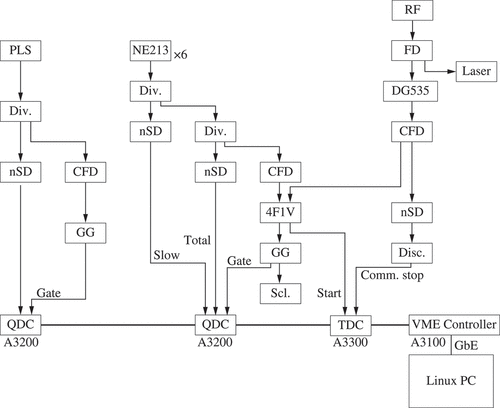
illustrates a block diagram of the readout electronics. Using the time difference from the RF signal of the storage ring for time-of-flight (TOF) measurements, the analogue signals from the NE213 detectors were divided into three to obtain timing and pulse-height integral data (PH), with ‘total’ and ‘slow’ gates for pulse-shape discrimination (PSD). Only beam-coincident events were selected using a 4-fold, 1-veto coincidence module to generate the gate and TDC start signals. The RF signal was used to trigger the laser to generate the LCS photons and to stop TDC. The analogue signal from the PLS was divided into two signals to obtain the total pulse integral. The data acquisition system is an A3000 system, which includes an A3200 charge-to-digital converter (QDC), an A3300 time-to-digital converter (TDC) modules and a VME controller (Nikiglass Co. Ltd.). The modules were operated in free-run list mode, which accumulates data from these modules and adds time stamps with a 100 ns time resolution. The time stamps were used to find pairs of PH and TOF data in offline analysis. The data were stored in a Linux PC HDD that was connected to the VME controller via the gigabit ethernet interface.
Figure 6. Block diagram of the electronics circuits. PLS is the plastic scintillator, NE213 is the liquid organic scintillator, Div. is a divider, DG535 is a digital delay, RF is storage ring RF, FD is frequency multiplier, nSD is a nanosecond delay, CFD is a constant-fraction discriminator, 4F1V is the 4-fold, 1-veto coincidence module, GG is the gate and delay generator, Disc. is a discriminator, Scl. is a scaler, QDC is a charge-to-digital converter, TDC is a time-to-digital converter, and GbE is a gigabit ethernet.
2.4. Data-taking procedure
Before collecting the neutron data, the alignment of the collimators and target were first verified using the LCS photon beam. To align the collimators, the target was replaced by a gadolinium orthosilicate scintillator (GSO), which was shaped as a rectangular parallelepiped with dimensions 76 mm76 mm
180 mm. The photon intensity was monitored using the GSO by changing the positions and angles of the collimators. The final positions and angles were chosen to maximize the count rate of the LCS photons. To confirm the target position, a piece of imaging plate was attached on the front face of the target. The LCS photon beam size on the target was 2.3 mm in diameter. The polarization of the laser was confirmed to be the degree of 99.3
polarization using the transmitted laser beam through the straight section of the storage ring.
3. Data analysis
3.1. The number of LCS photons
To obtain the number of LCS photons, the detection efficiency of the PLS was determined by using the EGS5 code [Citation23]. In the EGS5 calculation, the geometry included aluminum foils of 72 µm on upstream and 24 µm on downstream surfaces of the PLS for a radiator and the light reflection, as well as an 11 m air between the vacuum window and PLS.
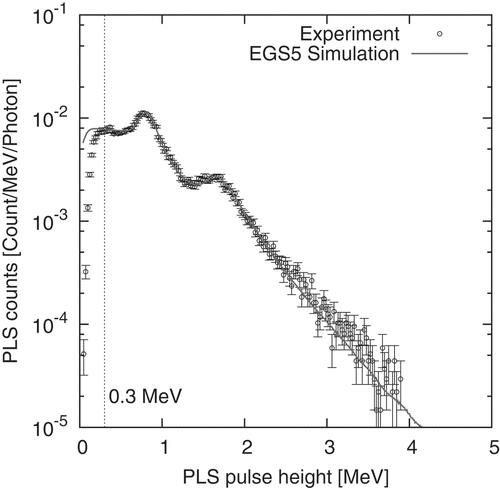
displays a typical PLS response determined from this experiment. By comparing the measured signals with the calculations, the efficiency of the PLS was determined to be for the number of events whose deposit energy is more than 0.3 MeV. The efficiency value was used to determine the number of photons for each run.
3.2. Neutron and gamma separation
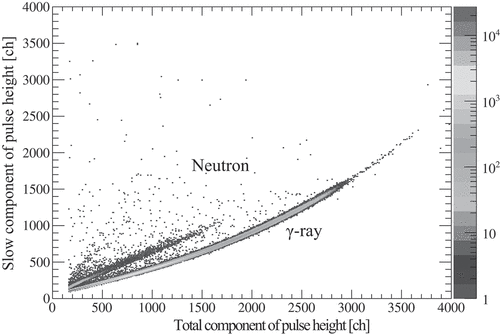
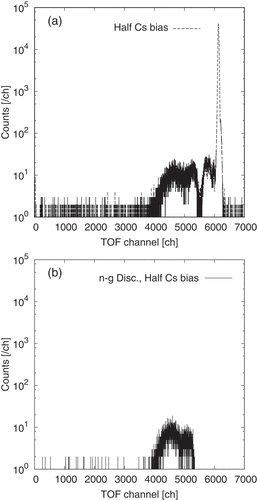
shows a 2D plot of the slow pulse height component vs the total of all events having data greater than 0.25 MeVee (equivalent to half of the Cs bias). A clear neutron- separation for all the detectors was obtained. shows the TOF spectrum for the raw data and data after neutron-
separation. The neutron component and peak generated by the
-ray events are separated clearly. From the FWHM of the prompt
-ray peak, the time resolution of 0.81 ns was obtained. The
-ray events appear around 5800 ch were due to backscattering from the beam dump.
3.3. Neutron detection efficiency
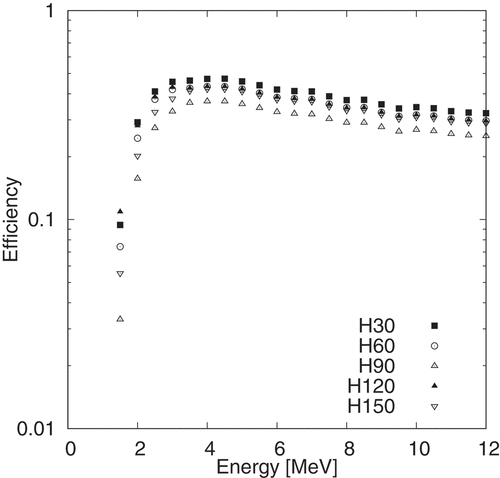
The efficiencies of the NE213 detectors, which are required to transform the TOF spectrum into an energy spectrum, were assessed using the SCINFUL-QMD code [Citation25]. Generally, it is difficult to determine the efficiency of the detectors in the low-energy region by calculation only, because of the detector-dependent pulse-height resolution. Therefore, the efficiencies of the NE213 detectors were obtained experimentally for energies 3 MeV using the neutron source of
Cf. The source was placed at the target position with a trigger detector that provided trigger signal instead of RF. The count rates for each energy were obtained by TOF. The detector efficiencies are obtained by taking ratios between the count rates and fission neutron spectrum of
Cf obtained by the National Bureau of Standards (NBS) [Citation26]. The NBS spectrum,
, is given by
where is in MeV, and the values of
are listed in [Citation27]. The relative efficiencies were obtained by dividing the observed energy distribution
of the
Cf fission neutrons by
:
Table 2. The values of in EquationEquation (2)
(2)
(2) [Citation27].
where is a normalization factor.
The detector efficiencies determined from the Cf fission neutron measurement and SCINFUL-QMD code for a 0.25 MeVee bias are illustrated in . To determine the efficiencies for energies
3 MeV, the
Cf measurements were normalized to those obtained from the SCINFUL-QMD code between 3 and 5 MeV.
3.4. Neutron attenuation and scattering within the target
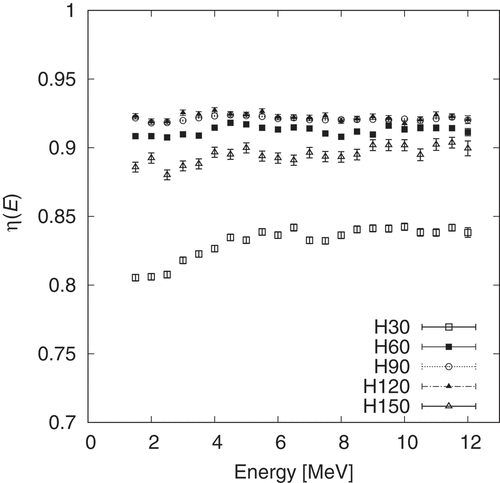
The neutron spectra emitted from photonuclear reactions are distorted by attenuation and scattering within the target. Because the transmission lengths through the Au target depends on directions of detectors from the target, the effect of the attenuation and scattering also differs. The influence is defined as
where is the incident spectrum and
is the spectrum detected by the NE213 detector after passing through the Au target.
was determined by using the Monte Carlo code PHITS 2.82 [Citation28]. For the calculation, neutron-emission positions were established considering that the 17 MeV photons were attenuated exponentially in the Au target. The quantity
is the average of the spectra obtained from the NE213 detectors. shows
for the Au target for each detector. These coefficients were used to determine the energy spectra and angular distributions.
3.5. Uncertainty
The estimated uncertainties are listed in . The uncertainty in the measured number of neutrons was evaluated from the statistical uncertainty for each energy bin. To obtain the number of LCS photons, the detection efficiency of the PLS was determined by using EGS5 with the incident photon spectrum shown in . Thus, the uncertainty of the energy spread of incident photon energy is included in the uncertainty element of ‘Number of photons’ in . The uncertainty in the solid angle was evaluated from the uncertainties in the detector positions. The uncertainty in the detection efficiency was taken to be the uncertainty obtained from the SCINFUL-QMD code. Uncertainty for neutron energy coming from timing resolution and time resolution ambiguity reached to approximately 10 for 10 MeV neutron.
Table 3. Uncertainties in this measurement.
4. Results and discussion
4.1. Energy spectra
shows the energy spectra of neutrons from the Au target produced by photonuclear reactions with the linearly polarized photons. The energy spectrum is given by
where is the neutron spectrum measured by the NE213 detector,
is the number of photons,
is the solid angle, and
is the detector efficiency.
Figure 12. Neutron energy spectra generated from the Au target due to photonuclear reactions with linearly polarized photons at (a) H30, (b) H60, (c) H90, (d) H120, and (e) H150.
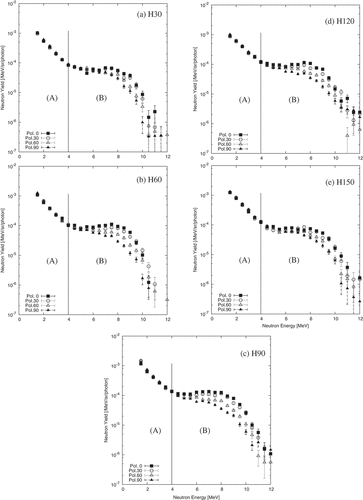
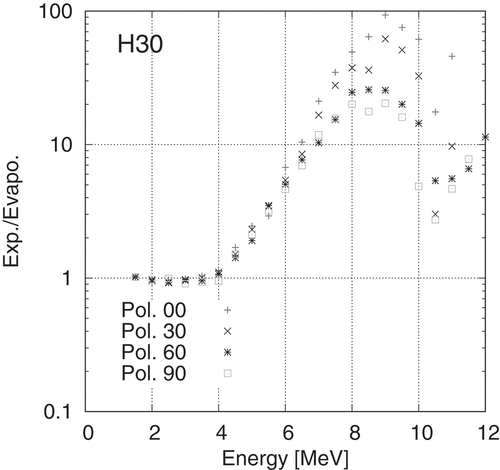
The neutron energy spectrum comprises two components. Here in, the branching energy was set between the two components at 4 MeV as explained later. The evaporation component of the emitted neutrons in the GDR region follows an exponential function as indicated in the Ref [Citation17]. Therefore, the ratios between the experimental values and an exponential function obtained by fitting the experimental values to the five low-energy bins were calculated. The branching energy was set to 4 MeV in order to separate the component that can be reproduced with the exponential function from the other components. As an example, the ratio of the fitting function to the experimental value at H30 is presented in . Both components were separated by 4 MeV. The reason is that the spectrum obtained by the experiment could be reproduced well with an exponential function in the energy region below 4 MeV as shown in . One component shows an evaporation-like spectrum at energies up to 4 MeV [(A) in ]. The spectrum of the other component, with energies 4 MeV, is shaped like a bump [(B) in ]. These results support the previous experimental results for the energy spectrum in the GDR region [Citation7–Citation16].
For linearly polarized photons with = 0° (Pol. 0 in ), the spectrum for neutron energies
4 MeV, which is considered in the same direction as the linear polarization, is higher than the spectra in the other directions. To show clearly the differences due to the polarization, the integrated values are described in the next subsection.
4.2. Angular distribution
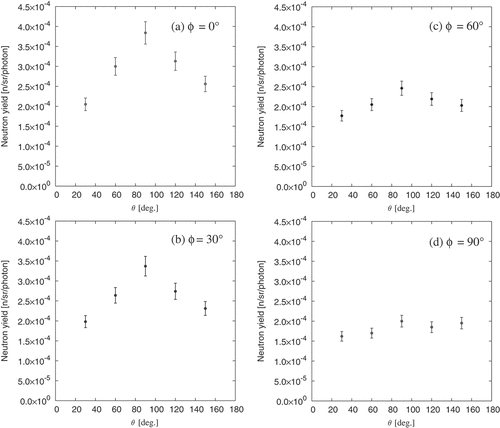
shows the integrated values of the neutron yield 4 MeV as a function of the polar angle
with respect to incident photon beam. This experimental result indicates that the neutron yield increases when the polarization direction is close to the detector direction.
Figure 14. Integrated values of the neutron yield at energies 4 MeV generated by linearly polarized photons at (a)
= 0°, (b) 30°, (c) 60°, and (d) 90°.
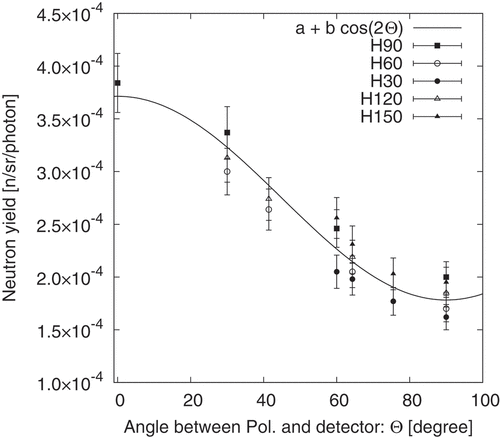
shows the integrated values of the neutron yield at energies 4 MeV as a function of the angle
between the polarization and detector direction. The solid line is obtained from
fitting using
where and
. By applying EquationEquation (1)
(1)
(1) to Hayward’s formula, EquationEquation (6)
(6)
(6) is obtained. EquationEquation (6)
(6)
(6) shows that the intensity of the direct-process component depends on the angle formed by the direction of the incident electric field vector and the emission direction, and the emission intensity increases as the angle decreases. As shown in , although there is some variation, the experimental data basically depend on
, and it can be seen that the arrangement of EquationEquation (6)
(6)
(6) is effective.
4.3. Anisotropic parameters of the direct-process component
In the past, the investigators have measured the angular distributions of the direct- and evaporation-process components obtained with unpolarized bremsstrahlung photons. The angular distribution of the direct-process component can be expressed as an expansion in Legendre polynomials [Citation29]:
The angular distribution of the direct-process component is anisotropic, and the parameter in EquationEquation (7)
(7)
(7) represents the dipole component of the interaction. We considered the average of the cases with
and
to compare the data obtained in this experiment, using polarized photons with those from unpolarized photons. From EquationEquation (6)
(6)
(6) , EquationEquation (8)
(8)
(8) was obtained.
where . On the other hand, by considering only the electronic dipole transition, EquationEquation (7)
(7)
(7) can be rewritten as
Comparing the coefficients of in EquationEquation (8
(8)
(8) –Equation10
(10)
(10) ) was obtained.
From the values of and
shown in the previous subsection,
was calculated for this experiment. The uncertainty in this value was estimated at
from the regression calculation.
summarizes a list of values calculated for the anisotropic parameter, , for the Au target in this experiment and previous experimental works [Citation30–Citation32]. Also, Courant [Citation33] showed that the angular distribution of nucleons emitted by unpolarized photons depends on the angular momentum before and after absorption. For a transition
, the angular distribution is proportional to
Table 4. Anisotropic parameter for the Au target.
Since neutrons in the Au nucleus fill quantum level up to
, then
and
. By substituting
, the parameter
is
and showing reasonably consistent with other data. There are factors that can change values in both experiments and calculations. Although the calculations presented in this paper use the single most likely value for
before and after the transition, in practice multiple orbits with various
are involved. Also,
changes depending on the incident energy. In the future, detailed calculations that take into account the distribution of
,
, and
before and after the transition will be required.
5. Conclusion
In summary, the angular dependence of neutrons generated by photonuclear reactions was obtained by injecting a beam of quasi-monoenergetic, linearly polarized photon at the energy of 16.6 MeV MeV onto an Au target and measuring the absolute energy spectrum. It was found that the neutron energy spectrum comprises two components, i.e. one component (A) that shows an evaporation-like spectrum for energies up to 4 MeV. The spectrum of the second component (B) that shows a direct-process component for energies
4 MeV. The intensity of the component (A) does not display any definite angular dependence, but the intensity of the component (B) is found to follow the relation [
] as a function of the angle
between the polarization and detector directions.
Disclosure statement
No potential conflict of interest was reported by the authors.
References
- Varlamov AV, Varlamov VVRudenko DS. Atlas of giant dipole resonances. Parameters and graphs of photonuclear reaction cross sections. IAEA Tech Rep. INDC(NDS)-394. IAEA; 1999.
- Blokhin AI, Chadwick MB, Fukahori T, et al. Handbook on photonuclear data for applications: cross sections and spectra. Vienna: IAEA; 2000.
- Veyssiere A, Beil H, Bergere R, et al. Photoneutron cross sections of 208Pb and 197Au. Nucl Phys A. 1970;159:561–576.
- Bramblett RL, Caldwell JT, Berman BL, et al. Photoneutron cross sections of Pr 141 and I 127 from threshold to 33 MeV. Phys Rev. 1966;148:1198–1205.
- Berman BL, Bramblett RL, Caldwell JT, et al. Photoneutron cross sections for As 75, Ag 107, and Cs 133. Phys Rev. 1969;177:1745–1754.
- Kelly MA, Berman BL, Bramblett RL, et al. Effect of nuclear polarization on the giant dipole resonance of Ho 165. Phys Rev. 1969;179:1194–1211.
- Ratner BS, Sergiyevsky AN, Verbitsky SS. Intermediate structure of the giant dipole resonance in 54Fe and 56Fe. Nucl Phys. 1977;A285:71–83.
- Eyss HJ, Lührs GZ. Photoproduction of high-energy neutrons in thick targets by electrons in the energy range 150 to 270 MeV. Physik. 1973;262:393–412.
- Kuchnir FT, Axel P, Criegee L, et al. Neutron spectra from monoenergetic photons on Bismuth. Phys Rev. 1967;161:1236–1248.
- Kaushal NN, Winhold EJ, Augustson RH, et al. Absolute neutron yields and energy spectra from 18 targets bombarded by 55 and 85 MeV bremsstrahlung. J Nucl Energy. 1971;25:91–100.
- Gayther DB, Goode PD. Neutron energy spectra and angular distributions from targets bombarded by 45 mev electrons. J Nucl Energy. 1967;21:733–747.
- Mutchler GS. The angular distributions and energy spectra of photoneutrons from heavy elements. Cambridge: Massachusetts Institute of Technology; 1966.
- Firk FWK. Energy spectra of photoneutrons from the reactions O16(γ, n), S32(γ, n) and Ca40(γ, n). Nucl Phys. 1964;52:437–448.
- Askew RF, Batson AP. Energy spectrum of the photoneutrons from gold. Nucl Phys. 1960;20:408–416.
- Cavallaro S, Emma V, Milone C, et al. Photoneutrons from Au. Nuovo Cimento. 1958;9:736–739.
- Bertozzi W, Paolini FR, Sargent CP. Time-of-flight measurement of photoneutron energy spectra. Phys Rev. 1958;110:790–791.
- Hayward E, Photonuclear reactions NBS monograph 118: national bureau of standards; 1970. [cited 2019 Oct 12]. Available from: https://www.govinfo.gov/content/pkg/GOVPUB-C13-0c46d22d2b1bf546a4752e467755ec0b/pdf/GOVPUB-C13-0c46d22d2b1bf546a4752e467755ec0b.pdf or https://archive.org/details/photonuclearreac118hayw.
- Blackston MA, Ahmed MW, Perdue BA, et al. First observation of the splittings of the E1 p -wave amplitudes in low energy deuteron photodisintegration and its implications for the gerasimov-drell-hearn sum rule integrand. Phys Rev C. 2008;78:034003-1~9.
- Horikawa K, Miyamoto S, Mochizuki T, et al. Neutron angular distribution in (γ, n) reactions with linearly polarized γ -ray beam generated by laser compton scattering. Phys Lett B. 2014;737:109–113.
- Hayakawa T, Shizuma T, Miyamoto S, et al. Spatial anisotropy of neutrons emitted from the Fe56 (γ,n) Fe55 reaction with a linearly polarized γ -ray beam. Phys Rev C. 2016;93:044313-1~4.
- Asano Y, Miyamoto S. Shielding design of laser electron photon beamlines at SPring-8. Prog Nucl Sci Tech. 2014;4:252–256.
- Miyamoto S, Asano Y, Amano S, et al. Laser Compton back-scattering gamma-ray beamline on NewSUBARU. Radiat Meas. 2007;41:179–185.
- Hirayama H, Namito Y, Bielajew AF, et al. The EGS5 code system, SLAC-R-730 and KEK Report 2005-8. Japan: High Energy Accelerator Research Organization; 2005.
- Itoga T, Nakashima H, Sanami T, et al. Measurement of neutron energy spectra for Eg =23.1 and 26.6 MeV mono-energetic photon induced reaction on nat C using laser electron photon beam at NewSUBARU. EPJ Web Conf. 2017;153:07010-1~6.
- Satoh D, Kunieda S, Iwamoto Y, et al. Development of SCINFUL-QMD code to calculate the neutron detection efficiencies for liquid organic scintillator up to 3 GeV. Nucl Sci Tech. 2002;2:657–660.
- Grundl J, Eisenhauer C Cardiovascular effects of the new inhalation anaesthetic isoflurane in man (author’s transl).. Proceedings of the first ASTM-EURATOM symposium on reactor dosimetry; 1975. p. 425–454.
- Grundl JA, Spiegel V, Eisenhauer CM, et al. A californium-252 fission spectrum irradiation facility for neutron reaction rate measurements. Bigelow J Nucl Technol. 1977;32:315–319.
- Sato T, Niita K, Matsuda N, et al. Particle and heavy ion transport code system, PHITS, version 2.52. Nucl Sci Tech. 2013;50:913–923.
- Baker RG, McNeill KG. Angular distribution of fast photoneutrons. Can J Phys. 1961;39:1158–1171.
- Price C. Energy spectra and angular distributions of photoneutrons from heavy nuclei. Phys Rev. 1954;93:1279–1285.
- Tabliabue F, Goldemberg J. Angular distributions of fast photoneutrons. Nucl Phys. 1961;23:144–152.
- Reinhardt G, Whitehead W. Angular distribution of fast photoneutrons. Nucl Phys. 1962;30:201–214.
- Courant ED. Direct photodisintegration processes in nuclei. Phys Rev. 1951;82:703–709.

