 ?Mathematical formulae have been encoded as MathML and are displayed in this HTML version using MathJax in order to improve their display. Uncheck the box to turn MathJax off. This feature requires Javascript. Click on a formula to zoom.
ABSTRACT
The thermal-neutron capture cross-section (σ0) and resonance integral (I0) were measured for the 135Cs(n,γ)136Cs reaction by an activation method and mass spectrometry. Because of difficulty in the preparation of pure 135Cs samples, we used 135Cs contained as an impurity in a normally available 137Cs standard solution. An isotope ratio of 135Cs and 137Cs in a standard 137Cs solution was measured by mass spectrometry to quantify 135Cs. Cesium-135 impurity along with the 137Cs standard solution was irradiated at the hydraulic conveyer of the research reactor in the Institute for Integral Radiation and Nuclear Science, Kyoto University. Wires of Co/Al and Au/Al alloys were used as neutron monitors to measure thermal-neutron fluxes and epi-thermal Westcott’s indices at an irradiation position. A gadolinium filter was used to measure the σ0, and a value of 0.133 eV was taken as the cut-off energy. Gamma-ray spectroscopy was used to measure induced activities of 137Cs, 136Cs and monitor wires. On the basis of Westcott’s convention, the σ0 and I0 values were derived as 8.57 ± 0.25 barn, and 45.3 ± 3.2 barn, respectively. The value of σ0 obtained in the present study agreed within the limits of uncertainties with the past-reported value of 8.3 ± 0.3 barn.
1. Introduction
Disposal of nuclear wastes generated from nuclear power reactors, especially long-lived fission products (LLFPs) and minor actinides (MAs), continues to be still an open issue. Solving the issue of nuclear waste disposal shall lead to a step towards public acceptance of nuclear power. Therefore, researches and developments aimed at actively improving safety have been promoted to effectively dispose of nuclear wastes generated by the operations of nuclear power reactors. The mainstream of these researches and developments was called as ‘OMEGA (Options Making Extra Gains from Actinides and Fission Products)Project’ from 1988 [Citation1]. In this project, the ‘nuclear transmutation’ has been extensively studied. To transmute MA and FP nuclides with extremely long half-lives into short-lived and/or stable ones using nuclear reactions could reduce the burden of waste disposal, and then help to positively improve the safety.
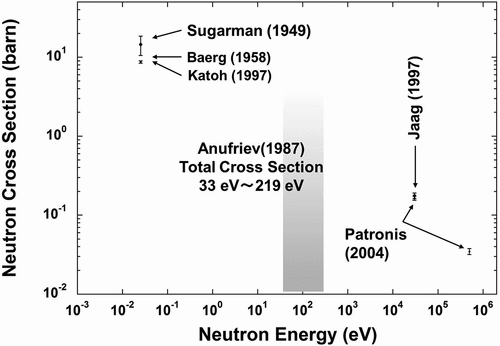
In recent years, transmutation researches have been revived. The ‘ImPACT’ program (Impulsing Paradigm Change through Disruptive Technologies Program) [Citation2] incorporates one of these movements into its program as a project. The ImPACT program aims to create scientific and technological innovation that will bring great change to the way of industry and society when realized. One of the projects in this program is ‘Reduction and Resource Recycling of High-level Radioactive Waste through Nuclear Transmutation’, which discovers an unprecedented and new route of transmutation and establishes a rational transmutation method, and then the project will challenge the problem of nuclear radioactive wastes. In this project, LLFP nuclides to be transmuted are listed as 107Pd, 93Zr, 135Cs, and 79Se. When considering transmutation of these LLFP nuclides by using neutrons, accurate data of neutron capture cross-sections are required to evaluate transmutation or reaction rates. For two nuclides (107Pd [Citation3] and 93Zr [Citation4]) among them, neutron capture cross-section measurements have been performed at Japan Proton Accelerator Research Complex and Institute for Integrated Radiation and Nuclear Science, Kyoto University. For the remaining two nuclides of 135Cs and 79Se, it is very difficult to obtain even standard solutions in commercial as well as simple substances. For this reason, the measured cross-section data for 79Se(n,γ) reaction are not at all available. On the other hand, experimental cross-section data for the 135Cs(n,γ)136Cs reaction are plotted in [Citation5–Citation10]. A few measurements have been reported for the neutron capture cross-sections of 135Cs from the year 1950s to the beginning of the 2000s. References [Citation5–Citation9] discuss measurements of the cross-sections of the 135Cs(n,γ)136Cs reaction by neutron activation method. For example, Katoh et al. [Citation7] derive the thermal-neutron capture cross-section by performing neutron irradiation with JRR-3M using 135Cs contained as an impurity in a standard 137Cs solution. Anufrev et al. [Citation10] first irradiated natural CsCl samples with reactor neutrons for a long period, and produced the sufficient amount of 135Cs nuclide required for the experiments by the double neutron capture reaction: 133Cs(2n,γ)135Cs. Next, they conducted transmission experiments with the generated 135Cs samples to derive resonance parameters of 135Cs in the neutron energy region shaded in .
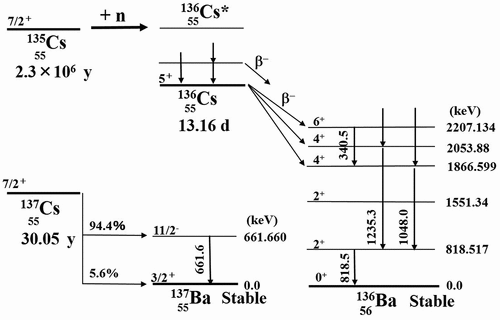
Thus, there is still a little data of neutron cross-sections of 135Cs because mono-isotopic 135Cs samples, as well as some kinds of standard solutions, are not available. When trying to chemically separate 135Cs from fission products via the 235U(n, f) reaction, 135Cs cannot be isolated because other Cs isotopes have the same chemical behavior. One option is to produce relatively pure 135Cs from the 134Xe(n,γ)135Xe reaction, although it is not so realistic. This is because this option requires long-term neutron irradiation and also enormous costs. Byproducts such as 136Xe, 137Xe, and 137Cs are also generated and the issue of isotope separation still remains. Furthermore, it would cost a great deal of money for neutron irradiation to product samples. This is the reason why isolated or enriched 135Cs samples are not available in the commercial. If a difficult isotope separation procedure is used in reverse, it results in 135Cs, which will be mixed in a relatively available standard solution of 137Cs. In this regard, the literature [Citation7] demonstrated that 135Cs was included as an impurity in a 137Cs standard solution. This idea of using an impurity as an experimental sample gave the authors the prospect of obtaining a 135Cs sample. Therefore, the authors selected 135Cs among LLFPs as a target nuclide for the cross-section measurement from the viewpoint of transmutation using the neutron capture reaction. illustrates a partial decay scheme of 136Cs [Citation11]. Although 135Cs has an extremely long half-life of 2.3 × 10⁶ years [Citation12,Citation13], it produces 136Cs through neutron capture reaction, which has a half-life of only 13.16 days [Citation12,Citation13]. When considering transmutation by reactor neutrons, not only the thermal-neutron capture cross-section σ0 for a thermal-neutron flux but also the resonance integral I0 for an epi-thermal neutron flux are required. (See Section 3.1 for definitions.)
Thus, this work is aimed to derive the thermal-neutron cross-section σ0 and resonance integral I0 of the 135Cs(n,γ)136Cs reaction.
2. Experiments
2.1. Mass analysis
A 137Cs standard solution (0.5 mol/L(M) HCl) was prepared for mass analysis and irradiation, which was supplied by Japan Radioisotope Association. Its product code was CS005, and its specific activity corrected on the reference date (27 September 2016) was 1.203 × 10⁵ Bq per gram of solution.
The isotope ratio of 135Cs and 137Cs (from now on, we will abbreviate this to ‘135Cs/137Cs ratio’) was examined for this standard solution by Thermal Ionization Mass Spectrometry (TIMS). The mass spectrometer TRITON-T1 (Thermo Fisher Scientific, Inc. USA) was used to analyze the sample. Since the sample is radioactive, its handling amount should be as low as possible to suppress contamination of the mass spectrometer. However, it is better to increase the sample amount as much as possible in order to measure the isotope ratio with high statistical accuracy. Mass analysis should be performed by satisfying these conflicting requirements. In this study, the target level of the precision of the 135Cs/137Cs ratio measurement was set as 0.5% in a relative standard deviation. It was confirmed that a 0.5% level was achievable with 1 pico-gram of Cs [Citation14], and then a sample amount of 5 Bq activities of 137Cs (ca. 1.5 pg) was used for mass spectrometry.
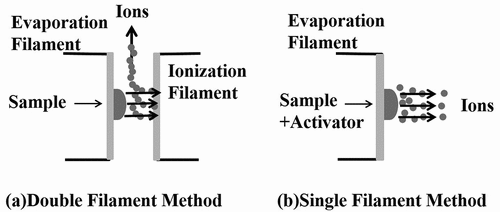
shows ionization according to the specification of the filament. In TIMS, evaporation and ionization processes occur at an ion source, and the double (or multi) filament method and the single filament method are usually used. The double filament method can perform evaporation and ionization at different temperatures, and it is effective for the analysis of an element with a high ionization potential. On the other hand, the single filament method causes evaporation and ionization simultaneously, and therefore this method is effective in the case of an element with a low ionization potential, or when enhancement of ionization can be expected by using activators. We first focused on the low ionization potential of Cs (3.9 eV [Citation15]). This suggests that the single filament method is suitable for ionization of Cs, and then we examined 10 types of activators such as tantalum oxide (TaO) [Citation16,Citation17], glucose [Citation14,Citation18], and silicotungstic acid (abbreviated as ‘W system’) [Citation14,Citation19] for effective ionization. Among these activators, it was confirmed that TaO, glucose, and W system showed superiority in terms of ionization efficiency of Cs. Moreover, it was found that glucose has the large suppression effect of dummy peaks from a viewpoint of the occurrence of dummy peaks ascribe to organic substances. The results were as follows: the ionization efficiency was in the order of W system > TaO > glucose, and in the suppression, effect was in the order of glucose > TaO > W system. More details would be published elsewhere [Citation14]. In this study, both TaO and glucose were used as the ionization activators in consideration of the suppression effect of dummy peaks in order to obtain the isotope ratio accurately. When using each activator, it was confirmed that the results of isotope ratios agreed with each other within the limits of uncertainties. For the above reasons, we adopted the single filament method and performed mass spectrometry using TaO and glucose as the activators for the present mass analysis.
Figure 3. Ionization scheme by filament types: (a) Double Filament Method, and (b) Single Filament Method.
Mass spectrometry was performed under the following conditions: About 5 Bq of 137Cs standard solution was loaded onto a rhenium filament and dried. The loaded rhenium filament was heated until the Cs ion beams showed the enough intensity. After the optimization of the ion lens for the Cs ion beam and the confirmation of the stability of the Cs ion beam, the 135Cs/137Cs ratios were measured. Because of the loading amount of Cs, the mass spectrometry of Cs was conducted with a secondary electron multiplier detector (SEM) and the peak jump method [Citation17,Citation20]. This measurement corresponds to 10 blocks of 10 cycles, and the ion beam intensity of each Cs isotope was integrated for 4 sec. During the analytical procedure, the vacuum around the ion source was kept better than 5.0 × 10⁻⁶ Pa.
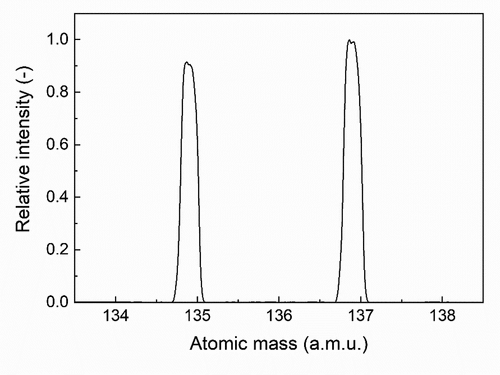
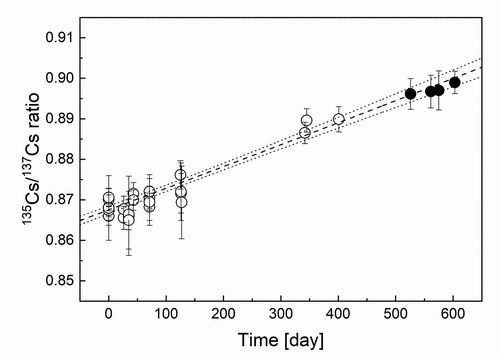
The typical mass spectrum obtained by the measurement is shown in . From mass yields of Cs isotopes in this spectrum, the 135Cs/137Cs ratio was found to be 0.8684 ± 0.0019 (number of replicate = 5) with an accuracy of 0.2%. Mass spectrometry was performed with high accuracy beyond the target accuracy of 0.5% which was initially set. Fission yields of 135Cs and 137Cs are produced approximately one to one. In the purification process of the 137Cs standard solution, a chemical behavior of 135Cs and 137Cs was naturally the same, and thus the isotopic ratio is almost maintained and 135Cs is included as an impurity. Here, the half-life of 137Cs was checked from the time change of the isotopic ratio to confirm whether or not the obtained mass ratio had no influence by impurities contained in the 137Cs sample. As shown in , the isotopic ratios were measured for about 2 years for the same 137Cs standard solution. It was obtained that the isotopic ratio was 0.868 ± 0.001 at the same timing as above mentioned by analysis of the isotopic ratios. From the slope of the broken line in , the half-life of 137Cs was found to be 31.02 ± 1.12 years, which is in agreement with the evaluated one: 30.07 years [Citation12] within the limits of uncertainties. This is the strong evidence for the accuracy of the determination of the isotopic ratio in this measurement.
2.2. Target preparation and irradiations
Since the emission probability of the 662 keV γ-ray in the decay of 137Cs is well known, in this study, the amount of 137Cs can be quantified by the γ-ray spectroscopy for 662 keV γ-rays. In Section 2.1, the 135Cs/137Cs ratio was determined, and therefore the amount of 135Cs can be also quantified from the amount of 137Cs. As you can see from , the 819 keV γ–rays are emitted from the 136Cs generated after neutron irradiation. After neutron irradiation, the amounts of both 135Cs and 137Cs can be obtained by measuring 662 keV and 819 keV γ-rays simultaneously. There is no need to take care of sample loss in sample handling before and after neutron irradiation. There are further advantages: the dead times in the γ-ray measurements are canceled, and it is enough to use relative detection efficiencies, which lead to reducing measurement uncertainties.
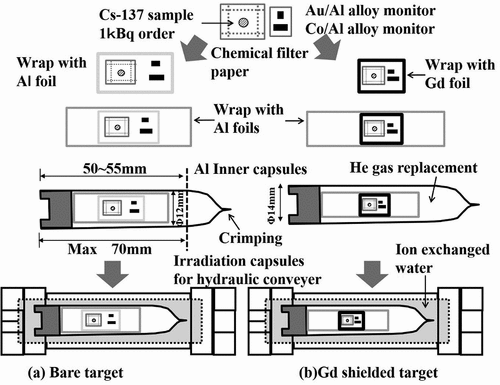
schematically gives an outline of target compositions. The 137Cs standardized solution equivalent to 1 kBq was dropped onto a glass microfilter by a glass capillary. Two such filters were prepared. The filters were dried by an infrared lamp. After drying, each filter impregnated with the 137Cs standard solution was wrapped with a high-purity aluminum foil, whose thickness was 15 μm. These were used as the 137Cs samples. Wires of Au/Al alloy (Au: 0.112 ± 0.001 wt%, 0.510 mm in diameter) and Co foils (Co: 0.46 ± 0.01 wt%, 0.381 mm in diameter) were used to monitor neutron fluxes at an irradiation position. Since 59Co and 197Au have different sensitivities to thermal and epithermal neutrons, these nuclides are appropriate to determine thermal and epi-thermal fractions in a neutron flux. The amount of 59Co and 197Au contained in each wire and foil was determined by weight measurements with the model XP6 microbalance (METTLER TOLEDO Inc. USA). Nuclear data [Citation12,Citation21] for monitor wires are listed in . A set of 59Co and 197Au monitors were wrapped with a 15-μm-thick high-purity Al foil and placed near the 137Cs sample so that the samples would not interfere with each other during neutron irradiation. The 137Cs sample with the monitor set was used as an irradiation target (called ‘a bare target’). The target was wrapped with an Al foil and housed in an inner capsule. For the other 137Cs sample, the same monitor set was attached to the Cs sample, and then the 137Cs sample and monitor set were sandwiched by a Gadolinium (Gd) foil (called ‘a Gd filtered target’) to determine the thermal-neutron capture cross-section by subtracting the contribution of the epi-thermal neutrons. In this type of measurement, Cadmium (Cd) is usually used as a neutron filter to separate thermal and epithermal neutrons. In addition, a value of 0.5 eV is taken as cut-off energy for separating neutrons, and then Cd with the thickness that gives such cut-off energy is used. Katoh et al. [Citation7] used a 1-mm-thick Cd capsule and performed measurements by taking 0.55 eV as the cut-off energy from the effective thickness of the capsule. In accordance with this, the authors initially planned to conduct experiments using a Cd shield giving the cut-off energy of 0.5 eV to compare with the past reported values [Citation7]. However, there is no information whether or not resonances of 135Cs are present in a low neutron energy region, and therefore it is not certain that there is no resonance near the setting cut-off energy. Thus, it was decided to perform measurements with a cut-off energy smaller than 0.5 eV with paying attention to unknown low-lying resonances in a thermal-neutron energy region of 135Cs. If no resonance exists in the thermal-neutron energy region, the result of the thermal-neutron capture cross-section should be consistent with the past reported values with the limits of uncertainties independently of the cut-off energy. When setting the cut-off energy to low energy using Cd, it is necessary to prepare a thin Cd shield. However, it is difficult to sufficiently shield neutrons in the low energy region due to the behavior of the neutron capture cross-section of Cd. Therefore, we adopted Gadolinium (Gd) with large cross-sections as well as Cd, and compactly shielded a sample using Gd foils [Citation22]. In the present experiment, a 25-μm-thickness Gd foil was chosen to take a value of 0.133 eV as the cut-off energy as described in Ref [Citation23]. A 10 mm × 25 mm × 25 μmt size Gd foil was folded in two and the samples were sandwiched there. The Gd filtered target was also wrapped with an Al foil, and housed in another inner capsule. The inner capsules were crimped after being evacuated and replaced with Helium gas three times. The sealed inner capsule was set in an irradiation capsule, and the inside of the irradiation capsule was filled with ion exchange water and then covered.
Table 1. Nuclear data of monitor wires used in the analysis [Citation13,Citation21].
Neutron irradiations were carried out in the Kyoto University Research Reactor (KUR) of the Institute for Integral Radiation and Nuclear Science, Kyoto University. The KUR was operated at the thermal power of 5 MW, and the thermal neutron flux was about 1 × 10¹⁴ n/cm2/sec. Irradiation targets were transported from the top of the KUR to the center of the core by the hydraulic conveyer.
Irradiations for the bare and Gd filtered targets were performed for 3 and 6 h, respectively.
2.3. Activity measurements
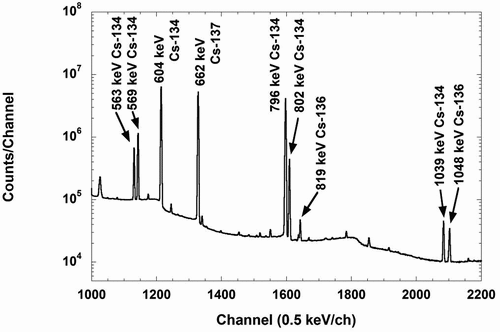
After irradiations, the irradiated targets were transferred to the canal of hot cave room at the hot laboratory in the KUR and allowed to cool for about a week. After cooling, the targets were pulled up into the cell in the hot laboratory, where the targets were opened and then the samples were collected. The samples were freshly sealed again with vinyl bags and used as measurements samples. Gamma rays from the irradiated samples were measured by a high-purity Ge-detector, of which performance was characterized by a relative efficiency of 70% to a 7.6 cm×7.6 cmΦ NaI (Tl) detector and an energy resolution of 1.9 keV full width at half-maximum at the 1.33 MeV peak of 60Co. The peak detection efficiencies were determined with a set of calibrated mixed sources: 109Cd, 57Co, 139Ce, 113Sn, 137Cs, 88Y, and 60Co. The uncertainty of the detection efficiency due to the uncertainties of the calibration γ source intensities was 1.5%. The activities of irradiated 137Cs samples and flux monitors were measured at a distance of 100 mm from the surface of the detector head to the samples. shows a γ-ray spectrum obtained by the 137Cs bare target. The measurement time was 112 h. A large amount of 134Cs was generated by the neutron capture reaction of 133Cs contained in the 137Cs solution as a fission product, and many γ-rays attributed to 134Cs were observed as shown in . Despite such conditions, the 662 keV γ-ray due to 137Cs and weak γ-ray with the energy of 819 keV ascribed to 136Cs were measured with a good signal-to-noise ratio.
3. Analysis
3.1. Westcott’s convention
Since the details of Westcott’s convention used to determine the thermal-neutron capture cross-section and resonance integral were described elsewhere [Citation24,Citation25], here we mention only a simple outline of the convention.
The reaction rate R is given by:
where nυ0 is the ‘neutron flux’ defined by the convention with the neutron density n, including thermal and epithermal neutrons, and with the velocity υ0 = 2,200 m/s for thermal neutrons; σ0 is the thermal-neutron capture cross-section; g is a parameter that represents the deviation of cross-sections from the 1/υ law; r is an ‘epithermal index’ in Westcott’s convention; T is neutron temperature and T0 is 293.6 K; the quantity r(T/T0)1/2 gives a fraction of epithermal neutrons in a neutron spectrum. The symbols Gth and Gepi denote self-shielding coefficients for thermal and epithermal neutrons, respectively. These self-shielding coefficients were calculated from the neutron cross-sections and densities of samples [Citation26]. The parameter s0 is then defined by:
where I0ʹ is the ‘reduced resonance integral’, i.e. the quantity obtained by subtracting a 1/υ-component from the resonance integral I0. Since the resonance integral is a cross-section that indicates the likelihood of capture reaction with epithermal neutrons, the parameter s0 represents sensitivity to epithermal neutrons. The resonance integral I0 is then expressed by:
where the first term I(1/υ) in the right side is the 1/υ contribution to the I0 above the cut-off energy Ec. The component I(1/υ) is calculated as:
where E0 is the thermal-neutron energy of 0.0253 eV.
3.2. Neutron flux and cross-section determination
From EquationEquation (1)(1)
(1) , reaction rates are written in simplified forms as [Citation27]:
for the bare target, and then
for the Gd shielded target. Here the prime (‘) means irradiation with the Gd filter. The Φ1 and Φ1’ are neutron flux components in the thermal energy region from 5 meV to 0.5 eV; the Φ2 and Φ2’ are those in the epi-thermal energy region from 0.5 eV to 1 keV.
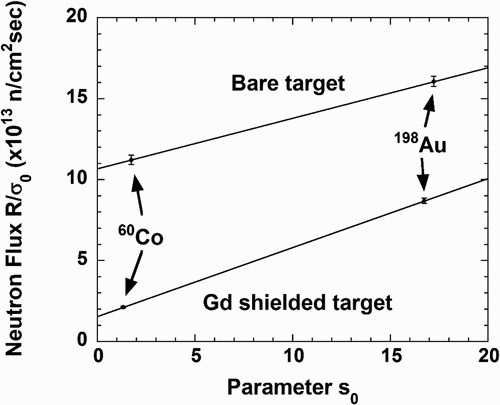
First, let us describe the derivation of neutron flux components from these equations. The reaction rates R and R’ were obtained from peak counts of γ-rays emitted from 60Co and 198Au. shows the experimental relations between R/σ0 (R’/σ0) and s0 obtained by the flux monitors. The data used in this analysis are listed in . The neutron flux components Φ1 and Φ1’ are derived with the relation in ; the slope of each solid line gives the epi-thermal flux components: Φ2 and Φ2ʹ. Intercepts along the y-axis in give the thermal flux components. For example, the thermal-neutron component was found to be (1.07 ± 0.03)×1014 n/cm2/sec from . summarizes the results of reaction rates R and R’for the flux monitors and neutron flux components Φ1, Φ2, Φ1ʹ and Φ2ʹ. From EquationEquations (1)(1)
(1) and (Equation5
(5)
(5) ), the quantity r(T/T0)1/2 is experimentally determined from the results in by taking the ratio of Φ1 and Φ2, and then found to be about 3%. The systematic uncertainties for these results of the flux monitors were examined quantitatively as summarized in .
Table 2. Reaction rates for monitors and neutron flux components at Hydraulic conveyer of the KUR.
Table 3. Systematic uncertainties for flux monitor measurements.
Second, the reaction rates for the 135Cs(n,γ)136Cs reaction can be derived in the following way. When the differential equation based on the decay scheme shown in is solved, the reaction rate R of the 135Cs(n,γ)136Cs reaction can be given by the following equation:
where subscripts 0, 1 and 2 denote 135Cs, 136Cs, and 137Cs, respectively. The symbol n is the number of nuclei in the target; for example, n0 represents the number of 135Cs target nuclei; Iγ is the γ-ray emission probability; εγ is its γ-ray detection efficiency; λ is the decay constant given by the half-life T1/2. In terms of time parameters, tirr represents the irradiation time in the reactor, tc the interval time (or cooling time) from the end of the irradiation to the start of measurement, and tm the time of γ-ray measurement; y is the yield of γ-rays obtained by γ-ray measurement.
The symbol rmass is the isotope ratio of 135Cs and 137Cs obtained by mass analysis described in Sec. 2.1, and given as the following equation:
where n2 is the number of nuclei of the 137Cs sample, which is determined from the yield of 662 keV γ-rays emitted in the decay from 137Cs and can be written as:
From EquationEquations (8)(8)
(8) and (Equation9
(9)
(9) ), the number of nuclei n0 in EquationEquation (7)
(7)
(7) is given by:
Neutron irradiations of the bare and Gd shielded targets are performed, and then the reaction rates R and R’ can be derived using the above equations from the yields of γ-rays from 136Cs and 137Cs obtained by γ-ray measurements of each sample. Data such as physical constant used for the present analysis are summarized in . Furthermore, summarizes measurement conditions, obtained γ-ray yields, and the reaction rates derived from the equations above.
Table 4. Data used for the present analysis [Citation13].
Table 5. Experimental conditions, obtained gamma-ray yields and reaction rates.
Finally, we will explain the derivation of the thermal-neutron capture cross-section and resonance integral. When EquationEquations (5)(5)
(5) and (Equation6
(6)
(6) ) are solved for the parameter s0, it can be written as follows:
The parameter s0 is derived from the ratio of R to R’ obtained by irradiations of Cs targets and also the neutron flux components Φ1, Φ2, Φ1ʹ and Φ2ʹ obtained by flux monitors listed in . The value of unity was taken as Westcott’s g-factor [Citation24] for 135Cs. The σ0 is obtained by substituting the value of the s0 into EquationEquation (5)(5)
(5) , and then the I0ʹ is derived from EquationEquation (2)
(2)
(2) . For the cut-off energy Ec= 0.133 eV, the 1/υ contribution to the resonance integral is estimated to be I(1/υ) = 0.872 σ0 from EquationEquation (4)
(4)
(4) . The resonance integral I0 is finally given as:
4. Results and discussion
Using the reactions rates in , the thermal-neutron capture cross-section σ0, the parameter s0, and the resonance integral I0 derived in the present work are summarized in together with past reported values. Furthermore, uncertainty factors related to the results are listed in . The uncertainties of these factors were actually shaken, and then propagation of the uncertainties given to the reaction rates was evaluated. The estimated uncertainties were finally taken into account for the uncertainties of σ0, s0, and I0.
Table 6. Experimental results of the thermal neutron capture cross-section and the resonance integral of the 135Cs(n,γ)136Cs reaction.
Table 7. Uncertainties propagated to the reaction rates ascribe to uncertainties of the data used in the present analysis.
The present result of the σ0 was in agreement with the results by Baerg et al. [Citation6] and Katoh et al. [Citation7] within the limits of uncertainties. Regardless of different reactors, different samples and irradiation conditions, we obtained the value of σ0 consistent with the previous ones. From this result, it is considered that there would be no resonance in a neutron energy range from 0.1 eV to 0.5 eV, which affects the reaction rate.
Speaking in detail, there is about one standard deviation in the main value between the result by Katoh et al. [Citation7] and the present one. Concerning the above discussion, the half-life data used in the analysis are considered to be one of the origins of the slight difference. When we study the reported data of 136Cs half-life so far, the situation is summarized as . Radiation emitted from 136Cs generated by some kind of reactions is measured with a proportional counter, NaI spectrometer, and Ge detector over a period of several times the half-life of 136Cs, and values in order of 12.9 days to 13 days are reported. Flynn et al. [Citation28] measured eleven 136Cs samples using a proportional counter and a NaI spectrometer, and then reported the half-life of 13.16 ± 0.03 days. This experimental value seems to be adopted in the recent compilation [Citation11]. Katoh et al. [Citation7] followed γ-rays emitted from 136Cs for a period of 30 days with a high-purity Ge detector and fitted the decay curve of the measured γ-rays with two parameters of reaction rate and half-life, and then found the half-life as 12.63 ± 0.04 days. They suggested that longer half-life values in the past measurements may have been reported due to a problem of pile-up correction. On the other hand, Patronis et al. [Citation9] similarly studied the decay of 136Cs with a Ge detector for 37 days after reactor activation, and then obtained the half-life of 13.04 ± 0.03 days. Here, they performed the half-life measurements carefully in terms of pile-up correction, and then they concluded that a pile-up correction was negligible because counting rates of the Ge detector used for measurements were small. From the current situation of the half-life data, the present analysis was performed using the evaluated value of 13.16 ± 0.03 days [Citation12,Citation13]. Thus, the difference between the half-life value by Katoh and that of the most recent compilation is only 3%; however, it is very sensitive to the analysis of the neutron cross-section of 135Cs. In the present work, the analysis was performed using the most recent compilation (13.16 ± 0.03 days) to obtain 8.57 ± 0.25 barn as σ0. If analysis would be performed using 12.63 ± 0.04 days by Katoh et al. [Citation7], the results derived with the present measurement data are as follows: σ0 = 8.37 ± 0.25 barn, s0 = 5.08 ± 0.44, and I0 = 45.0 ± 3.5 barn. That is, from our experimental data, we can derive the thermal-neutron capture cross-section which is very consistent with that by Katoh et al. [Citation7].
Table 8. Data reported for the half-life of 136Cs.
Now the argument is moved to the result of the resonance integral. As for the resonance integral, the cut-off energies were taken differently, and therefore the plot is drawn with cut-off energies as parameters as shown in , where the present result and the past experimental values are plotted for comparison. A solid line in denotes the behavior of the resonance integral obtained from JENDL-4.0 as a function of the cut-off energy. One finds that the current evaluation is located in the middle of the experimental data. If we consider values that are roughly 25% smaller than the evaluated data, they look like a dotted line in . The behavior of the dotted line seems to be consistent with the results of the present work and Katoh et al. [Citation7]. From this fact, the evaluation of the resonance integral might be overestimated by about 25%. Therefore, it might be desirable that further measurements of the neutron cross-sections of 135Cs in the resonance region are performed in detail.
Figure 9. Change of the resonance integral by the way of taking the cut-off energy. The solid line shows a behavior in the resonance integral calculated by the JENDL-4.0 library, and then the dotted line is a plot of values that are 25% smaller than the values according to the JENDL-4.0 [Citation33].
![Figure 9. Change of the resonance integral by the way of taking the cut-off energy. The solid line shows a behavior in the resonance integral calculated by the JENDL-4.0 library, and then the dotted line is a plot of values that are 25% smaller than the values according to the JENDL-4.0 [Citation33].](/cms/asset/771a108f-544a-4019-ba81-c4ddfc698920/tnst_a_1691077_f0009_b.gif)
5. Conclusion
From the viewpoint of the transmutation study, the present work measured the thermal-neutron capture cross-section and resonance integral for the 135Cs(n,γ)136Cs reaction by the activation method. Cesium-135 impurity contained in the 137Cs standard solution was used as irradiation samples. In order to quantify 135Cs, the 135Cs/137Cs ratio was determined by mass spectrometry. We analyzed 137Cs samples as small as 0.5 Bq and then succeeded in measuring the 135Cs/137Cs ratio with high accuracy of 0.2%. The mass-analyzed 137Cs samples were irradiated at the hydraulic conveyer of the KUR. The Co/Al and Au/Al alloy wires were used as monitors to determine thermal-neutron fluxes and epi-thermal Westcott’s indices at the irradiation position. The 25-μm-thick gadolinium filter was used to measure the σ0 by subtracting the contribution from the epi-thermal neutrons. The cut-off energy was set to 0.133 eV from the thickness of the Gd filter. The activities of 137Cs, 136Cs and monitor wires were measured by γ-ray spectroscopy. On the basis of Westcott’s convention, the σ0 and I0 values of the 135Cs(n,γ)136Cs reaction were derived from reaction rates of 135Cs and neutron fluxes and then found to be 8.57 ± 0.25 barn, and 45.3 ± 3.2 barn, respectively. The σ0 obtained in the present study was in agreement with the past reported data [Citation6,Citation7] within the limits of uncertainties regardless of different experimental conditions, reactors and Cs samples. Although there is a slight difference between the resent result of the σ0 and that by Katoh et al. [Citation7], it was found that this discrepancy was reduced by the half-life data of 136Cs used in the analysis. As for the resonance integral I0, it was found that the evaluation [Citation33] might be overestimated by about 25%.
In order to further discuss the present results obtained by the activation method, it is desirable that the energy-dependent neutron capture cross-section of 135Cs shall be measured by the time-of-flight method in future.
Acknowledgments
This work has been carried out in part under the Visiting Researcher’s Program of the Institute for Integrated Radiation and Nuclear Science, Kyoto University. The authors would like to appreciate the staff of Kyoto University for their support: Prof. Tsutomu OTSUKI, Messrs Daisuke MAKI, Ryo OKUMURA, Hisao YOSHINAGA, and Yuto IINUMA. The authors would also like to express our gratitude to Dr. Jun-ichi HORI for the great effort to manage the Kyoto University Research Reactor.
One of the authors (S.N.) would also like to express our gratitude to Dr. Hideo HARADA of JAEA for his constructive comments.
Disclosure statement
No potential conflict of interest was reported by the authors.
Additional information
Funding
References
- HiroHiroaki U. Outline of OMEGA project, research and development on partitioning and transmutation of actinoids and fission-products searching for new possibilities of nuclear technology. At Energy Soc Jpn. 1989;31(12):1317–1323. in Japanese.
- [ cited 2019 Aprille 5]. Available from: http://www.jst.go.jp/impact/hp_fjt/en/
- Nakamura S, Kimura A, Kitatani F, et al. Cross section measurements of the radioactive 107Pd and Stable 105,108Pd nuclei at J-PARC/MLF/ANNRI. Nucl Data Sheets. 2014;119:143–146.
- Hori J, Takamiya K, Fukutani T et al. AESJ fall meeting. 2010. p. I12. (in Japanese)
- Sugarman N. Characteristics of the fission product Cs135. Phys Rev. 1949;75(10):1473–1476.
- Baerg AP, Brown F, Lounbury M. The cross section for the reaction Cs135(n, γ)Cs136. Can J Phys. 1958;36:863–870.
- Katoh T, Nakamura S, Harada H, et al. Measurement of thermal neutron capture cross section and resonance integral of the reaction 135Cs(n, γ)136Cs. J Nucl Sci Technol. 1997;34(5):431–438.
- Jaag S, Käppeler F, Koehler P. The stellar (n γ) cross section of the unstable 135Cs. Nucl Phys A. 1997;621:247–250.
- Patronis N, Dababneh S, Assimakopoulos PA, et al. Neutron capture studies on unstable 135Cs for nucleosynthesis and transmutation. Phys Rev C. 2004;69:025803.
- Anufriev VA, Babich SI. Measurement of total neutron cross section of 134Cs and 135Cs radionuclides. Atomnaya Energiya. 1987;63(5):346–347.
- Sonzogni AA. Nuclear data sheets for A=136. Nucl Data Sheets. 2002;95:837.
- Firestone RB, Shirley VS, Baglin CM, et al. Table of Isotopes. 8th ed. New York: John Wiley and Sons; 1995.
- Nucleide-LARA on the web. [ cited 2019 Aug 21]. Available from: http://www.nucleide.org/Laraweb/index.php
- Shibahara Y, et al. In progress.
- Handbook of chemistry and physics. 70th ed. Boca Raton, FL, Tables E: CRC press Inc.; 1989–90. p. 80–81.
- Brick JL. Precision K-Rb-Sr isotopic analysis: application to Rb-Sr chronology. Chem Geol. 1986;56:73–83.
- Shibahara Y, Kubota T, Fujii T, et al. Analysis of cesium isotope compositions in environmental samples by thermal ionization mass spectrometry-1. A preliminary study for source analysis of radioactive contamination in Fukushima prefecture. J Nucl Sci Technol. 2014;51(5):575–579.
- Dunne JA, Richards DA, Chen HW. Procedures for precise measurements of 135Cs/137Cs atom ratios in environmental samples at extreme dynamic ranges and ultra-trace levels by thermal ionization mass spectrometry. Talanta. 2017;174:347–356.
- Li CF, Chu ZY, Wang XC, et al. Sr isotope analysis of picogram-level samples by thermal ionization mass spectrometry using a highly sensitive silicotungstic acid emitter. Anal Chem. 2019;91(11):7288–7294.
- Shibahara Y, Kubota T, Fujii T, et al. Analysis of cesium isotope compositions in environmental samples by thermal ionization mass spectrometry-3. measurement of isotopic ratios of Cs in soil samples obtained in Fukushima prefecture. J Nucl Sci Technol. 2017;54(2):158–166.
- Mughabghab SF. Atlas of neutron resonances. Vol. 1 and 2. 6th ed. Netherlands: Elsevier Science; 2018.
- Nakamura S, Ohta M, Harada H, et al. Thermal-neutron capture cross section and resonance integral of americium-241. J Nucl Sci Technol. 2007;44(12):1500–1508.
- Nakamura S, Kitatani F, Kimura A, et al. Measurements of thermal-neutron capture cross-section and resonance integral of neptunium-237. J Nucl Sci Technol. 2019;56(6):493–502.
- Westcott CH, Walker WH, Alexander TK. Proceedings of Second International Conference Peaceful Uses Atomic Energy, Geneva; 1958. 16. p. 70.
- Walker WH, Westcott CH, Alexander TK. Measurement of radiative capture resonance integral in a thermal reactor spectrum, and the thermal cross section of Pu-240. Can J Phys. 1960;38:57–77.
- Scherbakov O, Harada H. Resonance self-shielding corrections for activation cross section measurements. J Nucl Sci Technol. 2002;39(5):548–553.
- Sekine T, Hatsukawa Y, Kobayashi K, et al. Measurement of thermal neutron cross section and resonance integral of the reaction 137Cs(n, γ)138Cs. J Nucl Sci Technol. 1993;30(11):1099–1106.
- Flynn KF, Glendenin LE. Independent yields of 84Rb, 86Rb and 136Cs for thermal-neutron-induced fission of 233U, 235U and 239Pu. J Inorg Nucl Chem. 1975;37:869–872.
- Olsen JL, O’kelley GD. The decay of Cs136. Phys Rev. 1954;95(6):1539–1540.
- Wille RG, Fink RW. Activation cross sections for 14.8-MeV neutrons and some new radioactive nuclides in the rare earth region. Phys Rev. 1960;118(1):242–248.
- Reising R, Pate BD. The decay of 12.9 d Cs136. Nucl Phys. 1965;65:609–634.
- Baba S, Baba H, Natsume H. Half-lives of some fission product nuclides. J Inorg Nucl Chem. 1971;33:589–595.
- Shibata K, Iwamoto O, Nakagawa T, et al. JENDL-4.0: a new library for nuclear science and engineering. J Nucl Sci Technol. 2011;48(1):1–30.

