
 ?Mathematical formulae have been encoded as MathML and are displayed in this HTML version using MathJax in order to improve their display. Uncheck the box to turn MathJax off. This feature requires Javascript. Click on a formula to zoom.
ABSTRACT
Monitoring only neutron flux in a nuclear reactor core has an advantage of offering reactor power monitoring accuracy. We started the development of a new nuclear instrumentation based on the measurement of prompt gamma rays emitted from metals placed at the neutron flux monitoring positions. The thermal neutron flux at the position of each placed metal piece can be monitored by measuring the prompt gamma rays as the count rate of each energy. The gamma-ray energy range was limited from 6 to 10 MeV to mitigate the interference of environmental gamma rays. Four metals, Ti, V, Ni, and Cu, were chosen as candidates in consideration of their neutron emission rates and self-absorption. In an experiment with a high-purity germanium semiconductor detector, we considered the identification of individual peak energies in an assumed situation where prompt gamma rays were emitted from the four different metals at the same time. Energy resolutions of the peak with the largest energy gap from the nearest energy peak of the other candidate metals were smaller than the gap. Thus, we confirmed that at least one peak for each candidate metal was able to be separated from the peaks derived from other candidate metals.
1. Introduction
We are studying a new nuclear power monitoring system using ex-core detectors for boiling water reactors (BWRs). Nuclear power is monitored to ensure the proper operation of the nuclear reactor from its startup to its shutdown. One of the monitored items is the neutron flux in the reactor core. When reactor power becomes excessive, the neutron monitoring system emits a signal to scram or to block the control rod to be withdrawn in order to prevent damage to the fuel cladding. For rated power monitoring in BWRs, local power range monitors (LPRMs) are used. Typically, 52 LPRM assemblies are installed in an advanced BWR core. Four LPRM detectors are installed as a single LPRM assembly and they measure the local power at each position in the LPRM assembly.
Conventionally, fission chambers are adopted as the LPRM detectors. However, it is difficult to separate neutron detection signals from gamma-ray detection signals with a fission chamber in a high dose rate environment. The detector in the reactor core detects too many signals to separate neutron signals from all signals. Part of the current value of the fission chamber does not follow instantaneous changes of the reactor power because decay gamma rays from structure materials and delayed gamma rays from fission products have a time lag for response. Thus, we considered a reactor power monitoring system with the detector located outside the reactor pressure vessel (RPV) by converting neutrons into prompt gamma rays by a neutron capture reaction. Naito et al. [Citation1,Citation2] evaluated such an ex-core nuclear power monitoring system as a way to decrease the number of RPV penetrations and extend the detector life. That system was applied to neutron detectors outside the RPV. In addition, Majid et al. [Citation3] used prompt gamma rays for nuclear power monitoring. In that system, prompt gamma rays emitted from the nuclear fuel were used. We considered a method for measuring prompt gamma rays as a different approach in order to monitor only neutrons from the reactor core by using different metals to convert the thermal neutrons into prompt gamma rays.
Prompt gamma activation analysis (PGAA) is known as an elemental analysis method using prompt gamma rays. In the early days, PGAA was performed using NaI(Tl) scintillators [Citation4]. The discovery of high energy resolution Ge (Li) semiconductor detectors had made it possible to analyze complex energy spectra. And the energy distribution of prompt gamma rays emitted by the neutron capture reaction was measured [Citation5]. Ge (Li) semiconductor detectors were also used in PGAA [Citation6–Citation8]. Molnár et al. [Citation9] systematically summarized the PGAA methodology and principles. In recent years, PGAA methods have been developed. For archeology, Sekimoto et al. [Citation10] performed neutron radiography and PGAA simultaneously to get the information of the inner structure and elemental components of the pottery sample at the same time. Toh et al. [Citation11,Citation12] developed an analytical technique that combines PGAA and time-of-flight elemental analysis by using an intense-pulsed neutron beam. We studied the local power monitoring method of the reactor using PGAA. In general PGAA, the purpose is to quantify elements in a target (sample). In contrast, our method quantifies each neutron flux that is simultaneously irradiated to known elements located at different locations within the reactor.
2. Nuclear power monitoring method
2.1. Concept of the neutron power monitoring system
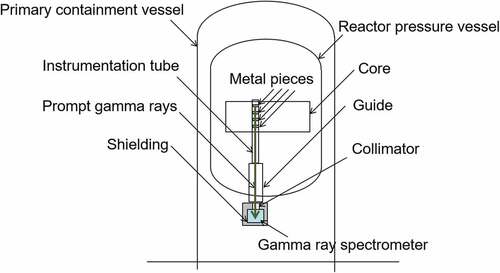
We proposed a new reactor power monitoring method based on a technique to measure only neutrons. When detectors like fission chambers are installed in the reactor core, both the neutron signals and gamma-ray signals are measured during rated power operation because there are too many detection signals to discriminate the neutron signals from all signals. Therefore, we considered that detectors were placed outside the RPV. The concept is shown in . Four different metals are placed in the neutron flux monitoring positions in the instrumentation tube which is a dry tube installed in place of an LPRM assembly. Prompt gamma rays are emitted by neutron capture reactions between the placed metals pieces and neutrons. The prompt gamma rays are measured by a gamma-ray spectrometer located outside the RPV. The energy distribution of the prompt gamma rays is specific for each metal and the prompt gamma-ray intensity is proportional to thermal neutron flux at the position of each placed metal. Therefore, the thermal neutron flux at each metal position can be monitored by measuring the prompt gamma rays as the count rate of each gamma-ray energy. Another advantage of this method is that no detectors need to be installed in the reactor core where the radiation dose rate is extremely high. Therefore, this method can be expected to facilitate access when instrumentation maintenance is carried out.
Figure 1. Concept of the reactor power monitoring system which uses four different metals in the reactor core and positions the gamma-ray spectrometer outside the RPV.
2.2. Selection of metals
We limited the measurement of energy range from 5 to 10 MeV. Environmental gamma rays including decay gamma rays from radiated materials and scattering gamma rays mainly have energies less than 3 MeV. When a high energy gamma ray is detected, a double escape peak is seen in the energy spectrum. The double escape peak is a peak having an energy 1.022 MeV lower than the energy of the gamma ray entering the detector. Thus, the lower energy limit of 6 MeV for the emitted prompt gamma ray was determined for the separation of prompt gamma rays from environmental gamma rays in the energy spectrum. When the energy of the gamma rays is more than 10 MeV, the probability of a photonuclear reaction like (γ, n) suddenly increases. The photonuclear reaction causes damage to the detector material through nuclear transmutation and we wanted to avoid that. The nuclear reactor components that emit prompt gamma rays above 10 MeV are the control rods. B-10, which is a boron isotope contained in the control rod, emits 11.44 MeV prompt gamma rays by a neutron capture reaction. In reality, because interaction occurs in the surrounding structures, it is expected that the probability is low for the gamma rays to reach the spectrometer without decreasing in energy. Therefore, there is little damage to the detector due to this boron-derived 11.44 MeV prompt gamma ray.
We surveyed metals which emitted high energy and high-intensity prompt gamma rays. Neutron capture reactions, which are caused between the neutron and the nucleus in the metal pieces, are used for thermal neutron monitoring. The high energy prompt gamma ray is emitted when the neutron capture reaction occurs between a specific isotope in the metal piece and the thermal neutrons. Thus, the gamma-ray emission rate depends on the neutron capture reaction cross section and the gamma-ray emission probability of the prompt gamma ray. In this survey, we used prompt gamma-ray emission cross sections [Citation9,Citation13]. These values incorporate both the neutron capture cross section and the gamma-ray emission probability. The emitted prompt gamma ray was attenuated by self-absorption before the gamma ray was released from the metal. We used the model of to estimate the attenuation rate of the self-absorption of the high energy prompt gamma ray. Because neutrons cause various nuclear reactions in metals, their intensity decreases as they are transmitted through the metal. Thus, the optimal radial length differs for each kind of metal. As a countermeasure, for example, as shown in , it is conceivable to form a cylindrical shape having different outer and inner diameters for each kind of metal. If the volume per axial length is the same for the four types of the cylindrical metal shapes, the smaller the outer diameter, the thicker the radial direction. By adopting such a design specification, it is possible to construct a structure in which the prompt gamma rays are not shielded by the metal below. The neutron capture reaction occurs at point P. The gamma ray generated at point P moves to the detector. The average attenuation rate is expressed by the following equation.
Figure 2. Gamma ray attenuation model for estimation of self-absorption.
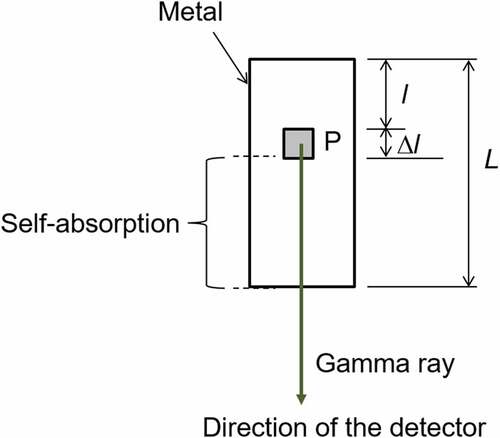
Figure 3. An example of conceptual shapes of metal pieces in the instrumentation tube.
Here is the average attenuation rate [-],
is the gamma ray energy [MeV],
is the thickness of the metal [cm],
is the attenuation coefficient [cm−1] [Citation14], and
is the distance from the top of the metal to the position P [cm]. By using the gamma ray emission cross section and the average attenuation ratio, gamma-ray release rate from the metal is expressed by the following equation.
Here, is gamma-ray release rate [cm−1],
is the prompt gamma-ray emission cross section [cm2], and
is atomic density [cm−3]. When
is large, many gamma rays enter the gamma-ray spectrometer. It is necessary to make
large to measure the neutron flux with high statistical precision. The parameters except for
depend on the metal material. Only
is a design parameter. It is assumed that the incident neutrons to the metal are coming from all directions. For the neutrons entering from a side of the metal, the thicker the metal is, the larger the number of released prompt gamma rays. We determined that the metal thickness of 2.5 cm was equivalent to the length of the LPRM detector.
2.3. Candidate metals
We chose six candidate metals with the large gamma-ray release rate based on four conditions.
Melting points were more than 700 degrees Celsius which is sufficiently higher than BWR normal operation temperatures.
The intensity was more than 1/10 of the total intensity of the gamma rays with higher energy for the same metal.
The number of gamma rays of energy over 6 MeV was less than 10.
The number of gamma rays of energy over 5 MeV was less than 15.
The peak appearing in an energy spectrum may be buried among Compton scattering components of higher energy gamma rays. The peak Compton ratio depends on the gamma-ray energy, the kind of detector and detector size. For example, the peak Compton ratio of a high-purity germanium semiconductor detector (HPGe) with a relative efficiency of 10% to 160% for gamma rays below 10 MeV is 40:1 to 110:1 for each energy [Citation15]. Thus, we surveyed gamma rays which have an intensity exceeding 1/10, which included margins, of the total intensity of higher energy gamma rays from the same metal. The gamma ray peaks meeting this condition (condition b) are able to be detected without being buried in Compton scattering released by the same metal. We determined that the lower limit energy of the monitoring gamma rays was 6 MeV. Thus, the number of gamma rays with energy more than 6 MeV emitted by any one metal was limited to 10 (condition c) in order to identify the gamma ray peaks because too many gamma-ray emissions make identification of the gamma rays derived from other metals difficult. For the case to use the escape peaks for identification of the gamma rays, the number of gamma rays with energy of more than 5 MeV emitted by any one metal was limited to 15 (condition d). In fact, for the prompt gamma rays, energies less than 6 MeV are dominant.
Among elements meeting the conditions a, b, c, and d, the six elements with large values of the gamma-ray release rate are shown in .
Table 1. Candidate metals.
We quickly excluded Fe from the candidate metals because Fe is commonly present in neighboring structures such as the RPV or piping. Gamma rays from V and Nd interfere with each other. We eliminated Nd and chose V by consideration of the neutron capture reaction cross section as explained in the next paragraph. Ti was considered because it emits high-intensity gamma rays and has few interfering gamma rays. The highest energy gamma ray should not be buried among Compton scattering components. Ni emits the highest energy gamma ray with high intensity among the candidate metals except for Fe which was excluded. Thus, Ni was a promising candidate. Likewise, Cu was a promising candidate because Cu emits a higher energy gamma ray with high intensity than all other candidate metals except Ni.
In making the self-absorption estimation using the model of , we assumed that the same neutron flux was obtained in any region of the metal piece. However, neutron flux was attenuated as the neutrons were transmitted into the metal depth. Therefore, actually, neutron flux was low as the deep part of the metal piece corresponded to the total cross section. shows the total cross sections of the thermal neutrons calculated with JENDL4.0 [Citation16]. The macroscopic cross section of Nd was bigger than that of V. Therefore, the mean free path of V was longer than that of Nd. Because thermal neutrons enter the metal from the periphery of the nuclear reactor and higher energy neutrons lose energy in the metal by scattering, it is difficult to evaluate thermal neutron flux in the metal in a simple way. However, according to this comparison of nuclear reaction cross sections, we supposed thermal neutron flux in V to be larger than that of Nd, and we chose V. In summary, Ti, V, Ni, and Cu were chosen as candidate metals from the above facts.
Table 2. Total thermal neutron cross section and mean free path of candidate metals.
These four metals were evaluated in terms of neutron absorption. The mean free path () was used as the transmission distance of the thermal neutrons in the metal. We assumed that the shorter the mean free path, the thinner the metal radial direction. Therefore, in , metal 1 was Ti, metal 2 was V, metal 3 was Cu, and metal 4 was Ni. In this arrangement, when thermal neutrons passed through half the mean free path for all metals, the radial diameter, which was the same as the outer diameter of metal 4, was about 2.33 cm. Thus, a transmission distance of half the mean free path per inch of inner diameter of the instrument tube was able to be secured. The axial thickness cannot be uniquely determined because the neutron flux varies from reactor to reactor. For this reason, it is determined for each metal according to the amount of prompt gamma-ray emission required for each reactor.
2.4. Detector shieldings
The gamma-ray spectrometer does not detect only prompt gamma rays emitted from the target metal. The spectrometer also detects decay gamma rays and scattered gamma rays from surrounding structures. In addition, the spectrometer detects gamma rays that are emitted from structures in the RPV and transported through the instrumentation tube. The dominant background is considered to be gamma rays derived from Fe. These unexpected gamma rays are background components. These background gamma rays cause pileup, signal processing saturation, and gamma-ray energy competition. According to , prompt gamma rays emitted from candidate metals can be energetically separated from prompt gamma rays emitted from Fe.
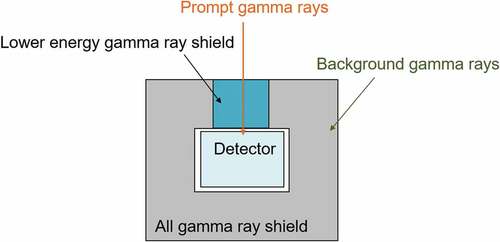
Since most decay gamma rays are 3 MeV or less, they can be separated energetically from the prompt gamma rays to be measured. However, the decay gamma rays cause pileup and signal processing saturation when detected in the spectrometer. Therefore, shields are installed to cover the spectrometer. The concept of the shielding structure is shown in . Pb is a suitable shielding material, the numbers of detected gamma rays are able to be decreased by more than the order of magnitude with a 5 cm thick Pb shield [Citation14].
Figure 4. An example of the conceptual structure of the detector shield.
Some of the prompt gamma rays emitted by capture reactions between Fe and neutrons have high energy. Many of these prompt gamma rays are emitted at the core in the RPV which includes the instrumentation tubes. These background prompt gamma rays enter the spectrometer through the instrumentation tube. We assumed that the distance between the spectrometer installed at the bottom of the RPV and the core is about 10 m, and the diameter of the instrumentation tubes is about 2.5 cm. With this design, the instrumentation tube functions as a collimator. Many of the prompt gamma rays that are emitted by Fe in the RPV and incident on the spectrometer undergo multiple scattering in the instrumentation tube. The energy of the gamma rays decreases. Thus, the main target energy of the shielding is lower than the energy of the prompt gamma rays emitted from Fe. Some Fe-derived prompt gamma rays are emitted in the direction of the spectrometer and enter without any scattering. They are energetically separated.
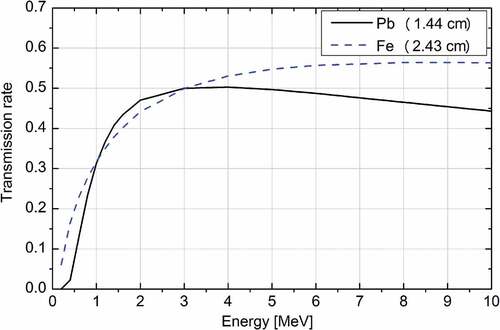
From the above, most of the background components have lower energy than the gamma rays to be monitored. The shield placed toward the direction of prompt gamma rays to be monitored has to be constructed of a material that cuts only low energy gamma rays. shows the gamma-ray transmission rate of Pb and Fe calculated using the attenuation coefficient [Citation14]. Thickness of the Pb was 1.4 cm and that of Fe was 2.4 cm. These thicknesses were set as 50% shielding of 3 MeV gamma rays. Both Pb and Fe cut 50% or more of the gamma rays of 3 MeV or less. Fe has a relatively high transmittance for gamma rays of 5 MeV or higher. For this reason, we assumed that Pb was used as the shielding except in the core direction, and Fe was used as the shielding in the core direction. Thus, Fe was suitable as the shielding in the direction of instrumentation tube.
Figure 5. The gamma-ray transmission rate of Pb and Fe.
3. Experiment
We conducted a thermal neutron irradiation experiment for the candidate metals in the Kyoto University Research Reactor (KUR) in order to validate the nuclear data and confirm that there were no unexpected interfering gamma rays. We obtained the energy spectrum above 5 MeV for the candidate metals. shows a schematic drawing of the experimental setup in the KUR facility. The irradiation neutron flux to the candidate metals was 107 cm−2s−1. The thermal neutron beam size was 1 cm in width and 7 cm in height. Because there were Cd sheets in the beam line, many prompt gamma rays were emitted by a neutron capture reaction between the thermal neutrons and the Cd sheets. In addition, there were some shelves and devices made of stainless steel. Therefore, prompt gamma rays were emitted by a neutron capture reaction between the thermal neutrons and the Fe-containing structures.
Figure 6. Schematic drawing of experimental setup at KUR.
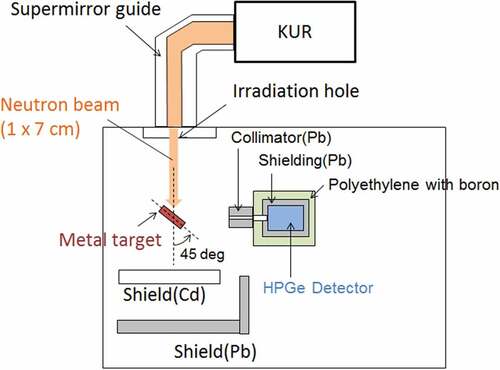
The detector was a HPGe (ORTEC, trans-SPEC) with the relative efficiency of 33.4%. shows the dimensions of target metal pieces. The surface area of each piece was larger than the incident area of the thermal neutron beam. The target metal piece was inclined 45° in the direction of the thermal neutron beam. The HPGe was inclined 90° in the direction of the thermal neutron beam. A Pb collimator 2 cm in diameter was installed in front of the HPGe to prevent the incidence of scattering gamma rays and neutrons. In addition, the HPGe was surrounded first by a Pb box of 5 cm thickness and then by a box made of borated polyethylene of 5 cm thickness.
Table 3. Dimensions of target metal pieces.
4. Results and discussion
4.1. High energy gamma-ray spectra
shows the energy spectra of the candidate metals. Labeled energies are full of energy peaks. Escape peaks are marked by the letters S (single escape peak) and D (double escape peak). The full energy peaks, single escape peaks and double escape peaks of the target gamma rays (shown in ) have their energies shown using bold red numbers. The peaks which are not labeled were obtained from the environmental structures that included metals such as Cd or Fe.
Figure 7. Energy spectra of candidate metals. Full energy peaks are shown as the energy. Escape peaks are marked by letters S (single escape peak) and D (double escape peak). The full energy peaks, single escape peaks and double escape peaks of the target gamma rays (shown in ) have their energies shown using bold red numbers. The peaks which are not labeled were obtained from the environmental structures that included such metals as Cd or Fe.
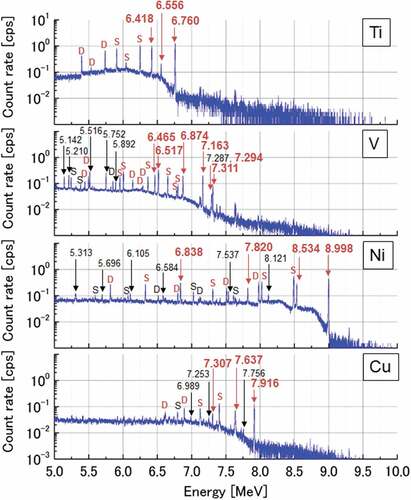
The full energy peaks of all target gamma rays were observed. Furthermore, single escape peaks and double escape peaks of these gamma rays were observed. For Ti, there were no high energy peaks observed excluding the target gamma ray. Thus, Ti is suitable for our neutron monitoring system. For V, many peaks including the gamma rays other than those of the target were observed. If the gamma rays derived from V do not interfere with gamma rays from other metals, V can be applied to our neutron monitoring system. For Ni, high energy gamma rays of more than 8.0 MeV were observed. These gamma rays did not interfere with gamma rays from other metals. Thus, Ni is suitable for our neutron monitoring system. For Cu, high-intensity gamma rays of more than 7.0 MeV were observed. However, peak count rates were less than the target gamma ray peaks of other candidate metals. Thus, if Cu is applied to our neutron monitoring system, the prompt gamma-ray release rate from the Cu target needs to be increased by using large metal pieces in the instrumentation tube, for example.
4.2. Consideration of simultaneous peak identification using four metals
We considered the identification of the peaks assuming prompt gamma rays were emitted from four different metals at the same time. The peaks of Ni were able to be identified because only prompt gamma rays from Ni were observed at energies exceeding 8.0 MeV. For the three remaining metals, it would be necessary to separate at least one peak from the spectra of the other metals.
The peaks with the largest energy gap from the nearest energy peak of other candidate metals are given in . The peak derived from Ti with the largest energy gap from the nearest energy peak was 6.418 MeV of the full energy peak. The nearest energy for the peak was the full energy peak of V at 6.465 MeV. The energy gap was 0.046 MeV. Energy resolution (FWHM, full width at half maximum) necessary to separate these two peaks within 3 σ was 0.28% of 6.418 MeV. However, according to the nuclear data [Citation9], Cu emits the 6.395 MeV prompt gamma ray. In this experiment, we did not observe this prompt gamma ray. The emission cross section of the gamma ray was 0.0503 barn. On the other hand, the cross section of the 7.916 MeV gamma ray which was the target gamma ray derived from Cu was 0.896 barn. The emission cross section of the target gamma ray was 10 times larger than the emission cross section of the 6.395 MeV prompt gamma ray. Thus, we supposed that the gamma ray was not observed because it was buried among Compton scattering components. For the 6.395 MeV gamma ray, the energy gap from 6.418 MeV was 0.024 MeV. Energy resolution (FWHM) necessary to separate these two peaks within 3 σ was 0.14% of 6.418 MeV. The FWHM of the 6.418 MeV peak in this experiment was 0.080%. The energy resolution was lower than the necessary energy resolution. Thus, the peak of Ti was able to be identified using the HPGe.
Table 4. Separation peaks. FE is the full energy peak and SE is the single escape peak.
The peak derived from V with the largest energy gap from the nearest energy peak was 6.363 MeV of a single escape peak derived from the 6.874 MeV prompt gamma ray. The nearest energy for the peak was the 6.327 MeV single escape peak of Ni. The energy gap was 0.036 MeV. Energy resolution (FWHM) necessary to separate these two peaks within 3 σ was 0.22% of 6.327 MeV. However, as we have already mentioned, Cu emits the 6.395 MeV prompt gamma ray. The energy gap from 6.363 MeV to 6.395 MeV was 0.032 MeV. Energy resolution (FWHM) necessary to separate these two peaks within 3 σ was 0.19% of 6.363 MeV. The FWHM of the 6.363 MeV peak in this experiment was 0.088%. The energy resolution was lower than the necessary energy resolution. Thus, the peak of V was able to be identified using the HPGe.
Cu emitted the prompt gamma ray with the second highest energy. The peak derived from Cu with the largest energy gap from the nearest energy peak was a single escape peak of 7.405 MeV derived from the 7.915 MeV prompt gamma ray. The nearest energy for the peak was the full energy peak of 7.311 MeV of V. The energy gap was 0.094 MeV. Energy resolution (FWHM) necessary to separate these two peaks within 3 σ was 0.50% of 7.405 MeV. The FWHM of the 7.405 MeV peak in this experiment was 0.078%. This energy resolution was lower than the necessary energy resolution. Thus, the peak of Cu was able to be identified using the HPGe.
We confirmed that at least one peak for each of the four candidate metals could be separated from the peaks derived from the other candidate metals using the HPGe. Thus, this method is potentially able to monitor the neutron flux at four positions in the instrumentation tube of a nuclear reactor at the same time.
5. Conclusion
We considered a new nuclear power monitoring method using neutron-induced prompt gamma rays. This method was potentially able to measure only neutrons at monitoring positions in the nuclear reactor core. The detector in the reactor core, however, detected too many signals to separate neutron signals from all signals. Therefore, we assumed that the detector was located outside the RPV and converted neutrons into prompt gamma rays by a neutron capture reaction. The gamma ray energy range was limited to 6 to 10 MeV to mitigate interference by environmental gamma rays. Four candidate metals Ti, V, Ni, and Cu were chosen in consideration of neutron emission rates and self-absorption by using prompt gamma-ray emission cross section data and gamma ray attenuation coefficients. We conducted an experiment making HPGe (ORTEC, trans-SPEC; relative efficiency of 33.4%) measurements in the KUR in order to validate the nuclear data and confirm that no unexpected interfering gamma rays occurred. High-intensity peaks were observed in the energy spectra of the four candidate metals. We considered the identification of the peaks in an assumed situation where prompt gamma rays were emitted from four different metals at the same time. It was necessary for the candidate metals to be able to separate at least one peak from the peaks of other metals. The peak with the largest energy gap from the nearest energy peak was listed for each candidate metal. The energy gaps were larger than the energy resolution of the HPGe. Thus, we confirmed that at least one peak for each of the four candidate metals was able to be separated from the peaks derived from the other candidate metals using the HPGe. This study indicated that our method is potentially able to monitor neutron flux of four positions at the same time.
Acknowledgments
This study was supported by Hitachi-GE Nuclear Energy, Ltd. The authors express their gratitude to the members of the research reactor group in the Institute for Integrated Radiation and Nuclear Science, Kyoto University for preparation and operation during the neutron irradiation and they also gratefully acknowledge the program for cooperative use of KUR supported by Kyoto University.
Disclosure statement
No potential conflict of interest was reported by the authors.
References
- Naito S, Takemura M, Sakurai S, et al. Ex-core local power monitoring using neutron streaming pipes. Nucl Sci Eng. 2009;166:107–117.
- Naito S, Takemura M, Kumanomido H, et al. Development of BWR ex-core nuclear instrumentation system – experimental verification of ex-core local power monitoring method by using neutron streaming pipes. Proceedings of ICAPP ’09; 2009 May 10–14; Tokyo, Japan.
- Majid J, Mohammad RA, Mojtaba M. Prompt gamma radiation as a new tool to measure reactor power. Radiat Phys Chem. 2013;91:19–27.
- Garbrah BW, Whitley JE. Determination of boron by thermal neutron capture gamma-ray analysis. Anal Chem. 1967;39(3):345–349.
- Orphan VJ, Rasmussen NC, Harper TL. Line and continuum gamma-ray yields from thermal-neutron capture in 75 elements. San Diego (California): Gulf Radiation (United States): Gulf Energy and Environmental Systems, Inc.; 1970. (DASA 2570).
- Orphan VJ, Rasmussen NC. A Ge(Li) spectrometer for studying neutron capture gamma rays. Nucl Instrum Methods. 1967;48:282–295.
- Jurney ET, Curtis DB, Gladney ES. Determination of sulfur in environmental materials by thermal neutron capture prompt gamma-ray spectrometry. Anal Chem. 1977;49(12):1741–1743.
- Failey MP, Anderson DL, Zoller WH, et al. Neutron-capture prompt gamma-ray activation analysis for multielement determination in complex samples. Anal Chem. 1979;51(13):2209–2221.
- Anderson DL, Belgya T, Firestone RB, et al. Handbook of prompt gamma activation analysis with neutron beams. Budapest (Hungary): Kluwer Academic Publishers Dordrecht, Boston, London;2004. p. 190–364. 7, prompt gamma-ray spectrum catalog.
- Sekimoto S, Saito Y, Homura Y, et al. Attempts for simultaneous observation of image and elemental component in a pottery sample using neutrons. Phys Procedia. 2013;43:352–359.
- Toh Y, Ebihara M, Kimura A, et al. Synergistic effect of combining two nondestructive analytical methods for multielemental analysis. Anal Chem. 2014;86(24):12030–12036.
- Huang M, Toh Y, Ebihara M, et al. Development of a correction method for the time-of-flight prompt gamma-ray analysis. J Appl Phys. 2017;121:104901.
- Choi HD, Firestone RB, Lindstrom RM, et al. Database of prompt gamma rays from slow neutron capture for elemental analysis. Vienna (Austria): International Atomic Energy Agency; 2007. (STI/PUB/1263).
- U.S. National Institute of Standards and Technology. Tables of X-ray mass attenuation coefficients and mass energy-absorption coefficients from 1 keV to 20 MeV for elements Z = 1 to 92 and 48 additional substances of dosimetric interest [Internet]. U.S.: National Institute of Standards and Technology; 2004 Jul [cited 2017 Sep]. Available from https://www.nist.gov/pml/x-ray-mass-attenuation-coefficients
- IEEE standard test procedures for germanium gamma-ray detectors. IEEE standard 325-1996.
- Shibata K, Iwamoto O, Nakagawa T, et al. JENDL-4.0: a new library for nuclear science and technology. J Nucl Sci Technol. 2011;48:1–30.