
ABSTRACT
Currently, most Iodine-129 (129I) present in the environment is anthropogenic; it has been released from European nuclear reprocessing plants and transported into the northern part of the Arctic Ocean via ocean circulation. This study investigates the 129I distribution in the Chukchi Sea and Bering Sea by considering water mass structure. The range of 129I concentration is 0.89–5.03 × 10⁷ atoms L−1 in the studied area, which is considered to be the fallout level. 129I was found to be distributed almost uniformly. An increase in 129I concentration levels caused by high 129I water inflow from the Atlantic Ocean was not observed. Additionally, we revealed the vertical distribution of iodide, one chemical form of iodine, from the Bering Shelf area to the Chukchi Sea for the first time. The range of iodide concentrations was found to be 10–157 nM. Moreover, an increasing tendency of iodide near sea bottom was observed, suggesting that iodide is released from sediments at the bottom of the sea.
1. Introduction
Iodine-129 (129I) is one of iodine’s radioisotopes, and currently, most 129I present in the environment is anthropogenic. Large amounts of 129I have been released into the environment via nuclear weapon tests in/below the atmosphere and reprocessing of nuclear fuel. The amount of 129I in seawater has been increasing by nuclear usage since the 1940s. A total preanthropogenic mass of 129I is estimated at only 130 kg [Citation1]. Aboveground nuclear weapons testing, which peaked in the 1960s, introduced between 50 and 130 kg of 129I into the stratosphere, which eventually found its way into the hydrosphere [Citation2–Citation4]. Anthropogenic 129I released into the environment from nuclear fuel reprocessing plants is mainly transported to the northern hemisphere [Citation1, Citation5, Citation6]. These nuclear reprocessing sites have significant impact on 129I in environment, introducing 5401 kg of 129I into atmosphere and ocean. Almost 90% of 5401 kg has been released by Sellafield (UK) and La Hague (France) [Citation1]. In Europe, ocean currents carry iodine toward the northeast from the major points of release, primarily liquid emissions from Sellafield and La Hague [Citation1]. It is reported that 129I which was released from nuclear reprocessing plant as liquid emissions reached Canada Basin via Arctic Ocean [Citation7]. Some of 129I released from Sellafield and La Hague, on the other hand, reached as far as the Barents Sea [Citation8]. The half-life of 129I is very long (15.7 million years), and it is a useful transient tracer in oceanography. Understanding the distribution of 129I in the ocean is important to estimate the impact of anthropogenic radionuclides in natural environments.
The Bering Sea and Chukchi Sea are positioned between the Pacific Ocean and Arctic Ocean, and 129I released from European nuclear reprocessing plants is known to be transported into the Beaufort Sea which is located north of Alaska via ocean circulation [Citation7]. Low salinity and slightly high 129I concentration (10–25 × 107 atoms L−1) water was observed in Chukchi Borderland located north of Chukchi Sea and Canada Basin located east of Chukchi Sea [Citation9]. It was suggested that this water arises from the melt of sea ice that froze from high 129I concentration in Atlantic water [Citation10] and a mixture of Atlantic water and—freshwater (river runoff) [Citation9]. It is predicted that water with high 129I concentration will flow into the Chukchi Sea in the future. Understanding the distribution of 129I in the Chukchi Sea and Bering Sea is beneficial to estimate the impact of 129I from European nuclear reprocessing plants to the Arctic Ocean including Chukchi Sea. In previous study for 129I concentration in the surface water of the Chukchi Sea and Bering Sea between 2013 and 2015, 129I concentration was constant and almost the same as the 129I concentration observed in the North Pacific Ocean (1.5–1.8 × 10⁷ atoms L−1) [Citation9,Citation11]. No known study has examined the vertical distribution of 129I concentration in the Chukchi Sea and Bering Sea with consideration of water mass structure. Therefore, we measured the 129I concentrations in the Chukchi Sea and Bering Sea and discussed the 129I distribution with the water mass structure.
Iodine is an essential element for many organisms, and iodide (I−), which is one of the chemical forms of iodine available in the ocean, is absorbed by phytoplankton [Citation12]. Iodine in seawater exists as iodide, iodate and organic iodine. The form of inorganic iodine (iodide and iodate) depends on redox environment in the seawater [Citation13,Citation14]. It is reported iodate can be reduce by marine bacteria [Citation15]. It is generally known that the average concentration of total iodine in oceanic seawater is around 450 nM [Citation15–Citation21]. Because phytoplankton supports biological production in the ocean, it is important to reveal the behavior of iodide in the Chukchi Sea and Bering Sea in order to better understand the nutrient provision process in these areas. If the result of observations suggests that the Chukchi Sea and Bering sea are iodide−producing areas, 129I will easily concentrate in marine organisms especially when high 129I concentration water flows into the Chukchi Sea and Bering Sea from Europe. Revealing the distribution of iodide in the Chukchi Sea and Bering Sea is important to understand the process by which marine organisms accumulate 129I released from the European Nuclear reprocessing sites.
2. Materials and methods
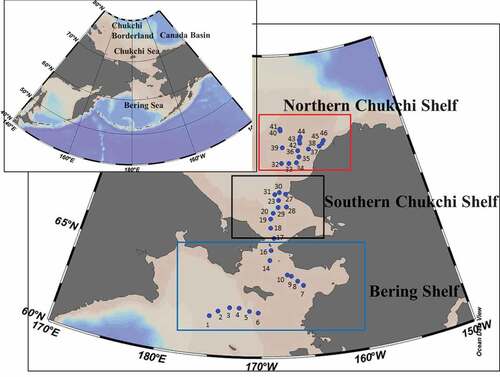
Seawater samples were collected in a C255 Cruise by the training ship Oshoro-Maru of Hokkaido University between 14 June 2013 and 6 August 2013. Water samples were collected in Niskin bottles attached to a Conductivity Temperature Depth-Carousel Multiple Sampler (CTD-CMS). Water sampling was conducted continuously in the Bering Shelf, the Southern Chukchi Shelf, and the Northern Chukchi Shelf (). Water temperature and salinity were measured at 46 stations in the Bering Sea and the Chukchi Sea. For vertical profiling of iodide, water samples (100 mL) were collected vertically (at different depths) at 28 stations. Water samples (1 L) for 129I analyses were collected at 12 stations and at the surface of seven other stations. After collection, water samples for iodide were frozen at −18°C.
Figure 1. Sampling locations of C255 Cruise by the training ship Oshoro-Maru of Hokkaido University during July 2013.
The 129I concentrations in the water samples were calculated from the ratio of 129I/127I and by the total iodine concentration in seawater. Ratios of 129I/127I in seawaters were measured by accelerator mass spectrometry (AMS) by the Japan Atomic Energy Agency (JAEA) Aomori Research and Development Center. All measured data were normalized against the standard reference material with 129I/127I = (9.85 ± 0.12) × 10–13, which was obtained from National Institute of Standards and Technology (NIST-SRM 3230). Details on the measurement condition of AMS were published by Suzuki et al. [Citation22]. The average concentration of total iodine in oceanic seawater (450 nM) [Citation15−Citation21] was used for calculation as total iodine concentration. The ratios of 129I/127I were determined by AMS after the iodine had been extracted as AgI from the seawater by using a solvent extraction technique [Citation23]. First, seawater sample was filtered through a 0.45 μm pore size membrane. Secondly, iodate (IO3−) was reduced to iodide (I−) by adding 0.1 M ascorbic acid (2 mL) and 2 M HCl (4 mL) into 300 mL of the filtered sample. After reduction, 0.03 M iodine carrier (3 mL, Woodward Iodine Corporation, 129I/127I = 2 × 10⁻¹⁴), chloroform (125 mL), and 1.5 M sodium nitrate (4 mL) were added to the seawater sample, and all the iodine was extracted into the organic layer as I2. The amount of iodine in 300 mL seawater sample (1.35 × 10⁻⁷ mol) was negligibly small comparing with the added iodine carrier (9.00 × 10⁻⁵ mol). After discarding the water phase, iodine was reduced into iodide again by the addition of 0.01 M sodium sulfite (10 mL) into the organic phase, and iodine was re-extracted into the water phase as iodide. Finally, iodide was precipitated as AgI by the addition of 0.02 M silver nitrate (5 mL). Ag2SO3 was also precipitated alongside AgI, and this was removed by washing with 3 M HNO3 (5 mL). Samples for AMS measurements were made by mixing dry AgI with 2.5 times by weight of niobium powder.
Iodide analysis was conducted using the cathodic stripping voltammetry (CSV) method (RSD = 5.8%) [Citation24]. The CSV analyses were performed with a 633 VA Stand (Metrohm) and a μAutolab III/FRA2 (Ecochemie) and controlled by a General Purpose Electrochemical System Version 4.9.007 (Ecochemie). A seawater sample (10 mL) was pipetted into a glass cell, and 0.2% TritonX (100 µL) and 1 M boric acid were added as a buffer. After 10 minutes of purging with nitrogen gas, iodide was deposited onto the hanging mercury electrode. Iodide concentrations were calibrated via the standard addition method using 10 μM KI as a standard.
3. Results and discussion
3.1. Water mass structure
In this study, water temperature and salinity at varying depths were observed at 46 stations located in the Chukchi Sea and Bering Sea in July 2013. By using temperature and salinity data, the five types of water masses involved in the study have been classified according to Danielson et al. [Citation25] (). The definitions of these five types of water masses are summarized in . Alaskan Coastal Water (ACW) is warm, low-salinity water that is affected by the fresh coastal discharge from Alaskan rivers and solar radiation. Bering–Chukchi Summer Water (BCSW) is warm water with high–salinity in the Bering Sea and the Chukchi Sea. Bering–Chukchi Winter Water (BCWW) is low–temperature water cooled by the winter season, and it can also be found over a wide area in the Chukchi Sea and Bering Sea during summer. Melting Water (MW) is low–temperature low-salinity water that is formed from sea ice melting. Atlantic Water (AtlW) is high-salinity (33.5–35.0) water.
Figure 2. Water mass structure of the Chukchi Sea and Bering Sea between during July 2013 with the definition of 5 types of water masses by Danielson [Citation25].
![Figure 2. Water mass structure of the Chukchi Sea and Bering Sea between during July 2013 with the definition of 5 types of water masses by Danielson [Citation25].](/cms/asset/8fce90d3-dc3f-4f76-b163-aeb0e54164ba/tnst_a_1699189_f0002_c.jpg)
Table 1. Temperature (°C) and salinity range in each water mass by Danielson et al. [Citation25].
It was determined that the water in the Bering Sea and the Chukchi Sea during July 2013 was composed of ACW, BCSW, BCWW, and MW. ACW, which had been widely observed in the Bering Sea and the Chukchi Sea by Danielson et al. [Citation25], was almost nonexistent in this study. BCSW was observed in three areas: Bering Shelf, Southern Chukchi Shelf, Northern Chukchi Shelf; while all the water from the Southern Chukchi Shelf was BCSW. BCWW was observed in the Bering Shelf and Northern Chukchi Shelf. MW was only observed in the Northern Chukchi Shelf. shows the sectional distribution maps of temperature and salinity at St. 32–46 (a), St. 7–41 (b), and St. 1–6 (c). () showed that BCWW was observed below 10–20 m in the North Chukchi Shelf. BCWW appeared closer to the surface at St. 38, 45, and 46. MW was observed on the water’s surface at St. 33–37 (() in the Northern Chukchi Shelf. (b) suggests that BCWW was observed only in the Northern Chukchi Sea, while BCSW was widely observed in the same area. () shows that BCSW was found in waters shallower than 10–20 m and BCWW was found deeper than 10–20 m in the Bering Shelf.
Figure 3. Sectional distribution maps of potential temperature and salinity. Vertically plotted black dots at each station mean sampling depth. ((a) St. 32–St. 46 in Northern Chukchi Shelf, (b) St. 7–St. 41 between Bering Shelf and Northern Chukchi Shelf, (c) St. 1–St. 6 in Bering Shelf).
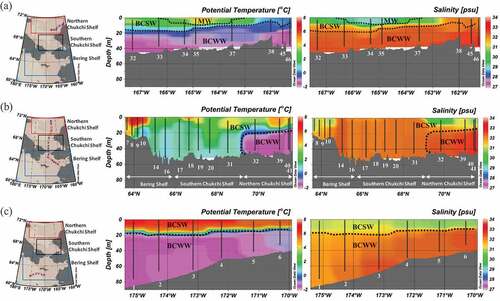
Based on these findings, the features of the three areas can be summarized below. (1) In the Northern Chukchi Shelf area, BCSW was observed broadly in surface water, and BCWW was also observed at depths greater than 20 m north of St. 32. BCWW was observed at the near surface of St. 38, 45 and 46. MW was observed at the surface from St. 33 to St. 37, suggesting that melting ice influences this area. (2) In the Southern Chukchi Shelf area, only BCSW was observed. (3) In the Bering Shelf area, BCSW is closer to the surface and BCWW can be found at depths greater than 10–20 m at St. 1–6. Only BCSW was observed at St. 7–16. ACW, which was widely distributed in the Bering Shelf area from August to September of 2013 [Citation25], was not observed in this study.
3.2. 129I distribution
Concentrations of 129I found at different depths in each area (Bering Shelf, Southern Chukchi Shelf, Northern Chukchi Shelf) are shown in . shows the range of 129I concentrations and the concentrations of 129I at the surface for each station, along with basic information about each sampling location (latitude, longitude, surface water temperature, and surface salinity).
Figure 4. Depth profiles of 129I ((a) St. 1–St. 6 in Bering Shelf, (b) St. 7–St. 41 in Southern Chukchi Shelf, (c) St. 32–St. 46 in Northern Chukchi Shelf).
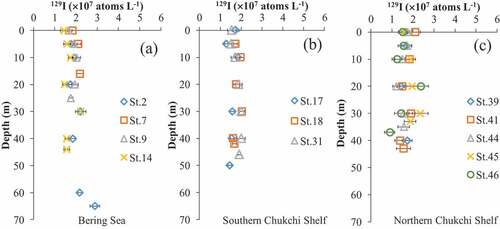
Table 2. Range of 129I concentrations and concentrations of 129I at the surface with location information (Latitude and Longitude), salinity, and potential temperature.
129I concentration range is 1.3–2.22 × 10⁷ atoms L−1 for BCSW and 0.89–2.90 × 10⁷ atoms L−1 for BCWW. 129I concentration range in MW is 1.70–1.74 × 10⁷ atoms L−1 which was obtained from St.44 in the Chukchi Sea. St.2 has slightly high concentration (1.90 × 10⁷ atoms L−1) at bottom layer. Almost all stations other than St.2 have vertically uniform distribution of 129I concentration.
illustrates the relationship between 129I concentration and salinity for the surface waters in MW. Previous studies [Citation26,Citation27] suggested that salinity and total iodine concentration are inversely correlated (Total iodine concentration (µM) = a × salinity + b; a = 0.009 [Citation27]–0.0095 [Citation26], b = intercept). Total iodine concentration will vary about 10% in salinity range (25–30) of MW on the assumption that total iodine concentration is 450 nM in salinity of 30. 10% change in 129I concentration caused by change in salinity of MW is sufficiently small within the range of 129I concentration observed (about 2–25 × 107 atoms L−1). In 2015, Nagai et al. [Citation9] also reported that 129I concentration correlated with salinity. From the study by Nagai et al. [Citation9], which covered the years 2013 through 2015, the relationship between 129I concentration and salinity for MW in 2013 and 2014 was not clearly distinguished because higher salinity values were not obtained in those years. Only the 2015 data, with the higher salinity MW values are comparable to those obtained in the present study, demonstrated a clearly inverse relationship between 129I concentration and salinity. In considering two data obtained in this study on , it was suggested that 129I concentration had the same relationship with salinity in 2013. A MW sample with low salinity and low 129I concentration was observed at off Barrow (OB) in 2013 by Nagai et al. [Citation9], which was excluded from because surface water at St. OB was strongly influenced by river runoff [Citation11], and the low 129I concentration may have been derived from river water rather than sea ice melting water.
Figure 5. Plots of 129I concentration versus salinity for the surface waters in MW. 2013–2015 data are picked from Nagai et al. [Citation9], and plotted with the data of this research.
![Figure 5. Plots of 129I concentration versus salinity for the surface waters in MW. 2013–2015 data are picked from Nagai et al. [Citation9], and plotted with the data of this research.](/cms/asset/5e87f2f7-0759-4f10-be88-f8d25d88a0f9/tnst_a_1699189_f0005_oc.jpg)
suggested that 129I concentration at the Western Arctic Ocean including Chukchi Sea is increases when the seawater is strongly influenced by MW. Higher concentration 129I might be trapped in sea ice. Previous studies reported 129I concentration in sea ice [Citation10] and glacier [Citation28]. Bautista et al. [Citation28] reported 129I concentration in an ice core taken from a glacier in Greenland. The 129I concentrations were comparable with the concentration in MW for our study. Aldahan et al. [Citation10] reported 129I concentration in sea ice taken in Fram strait located between Greenland and Svalbard. The 129I concentrations were 1.61–5.54 × 10⁸ atoms L−1 and one order of magnitude higher than the concentration in MW in this study.
Currently, major sources of 129I are European and Russian reprocessing plants in the Northern hemisphere [Citation28–Citation30]. Nuclear reprocessing plants have released 5,146 GBq of 129I as gas in 1944–2004, and 27,410 GBq of 129I as liquid in 1966–2004 [Citation31,Citation32]. The plausible supply routes of 129I to sea ice at Western Arctic Ocean might be 129I transport via atmosphere and ocean from the European reprocessing plants. Atlantic water is highly saline and cold, and circulates under halocline in Arctic Ocean [Citation7,Citation25]. Therefore, 129I in Atlantic water was unlikely to be trapped in sea ice floating on surface water. It is suggested that 129I was transported from European reprocessing plants to surface of sea ice in Western Arctic Ocean via the atmosphere.
3.3. Iodide distribution
The sectional distribution maps of iodide concentration are shown in (–). The iodide concentration ranges and the iodide concentration in the bottom layer (5 m from the seafloor) are shown in .
Figure 6. Sectional distribution maps of iodide (I−) concentration (nM) and dissolved oxygen (mL/L). Vertically plotted black dots at each station mean sampling depth. ((a) St. 32–St. 46 in Northern Chukchi Shelf, (b) St. 7–St. 41 between Bering Shelf and Northern Chukchi Shelf, (c) St. 1–St. 6 in Bering Shelf).
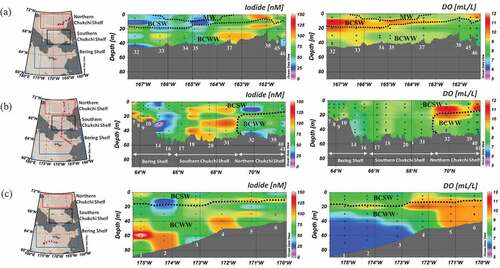
Table 3. Iodide concentration range and iodide concentration in bottom layer (5 m from seafloor).
In the area under investigation, iodide concentration was seen to increase closer to the seafloor. The highest iodide concentrations were observed in the bottom layer at 12 stations out of 28 total stations (). () shows that at St. 2 and 4, high iodide concentrations were observed near the seafloor on the sloped area of the Bering Shelf. () shows that at St. 7–10 in the Bering Shelf area, high iodide concentrations were found in the bottom layers. In the Southern Chukchi Shelf, at St. 18 and 20, iodide concentrations were high in all layers compared to the surrounding stations ((). In the Northern Chukchi Shelf, the iodide concentrations near the seafloor were high at St. 37.
It has been suggested that the marine production processes for iodide in the ocean are reduction of iodate to iodide by bacteria containing nitrate reductase [Citation15,Citation19] and reduction of iodate in the reductive sea area [Citation13,Citation14,Citation33]. Bacteria containing nitrate reductase reduce nitrate for metabolism. Iodate (IO3−) is known to be an electron acceptor, similar to nitrate, in seawater. Therefore, iodate can be reduced to iodide by bacteria containing nitrate reductase [Citation15,Citation34,Citation35]. Iodide production by the bacteria occurs in water column and on sediment at the seafloor.
We measured the vertical profile of nitrite (NO2−) concentration in the research area. Since nitrite is also produced by nitrate reduction by the bacteria, the distributions of iodide produced by bacteria should be similar to those of nitrite. In this study, nitrite concentrations were under detection limit (0.03 µM) in many samples. Thus, the correlation between nitrite and iodide concentration was not observed in this study and this, may suggest that the iodide is not produced by bacteria within water column in this research area.
The form of inorganic iodine (iodide and iodate) also depends on redox environment in seawater [Citation13,Citation14]. Previously, increase of iodide concentration was reported at the depth of oxygen minimum zone in water column [Citation33]. shows the sectional distribution maps of dissolved oxygen at St. 32–46 (a), St. 7–41 (b), and St. 1–6 (c). In all stations and at almost all sampling depths, dissolved oxygen concentrations were the same level as those in surface water. It is suggested that the iodide is not produced by redox environment within water column in this research area.
Iodide increasing in the bottom layer might be caused by sediment on the seafloor, as indicated by previous studies [Citation33,Citation36,Citation37]. Iodide was transformed from iodate in sediment through decomposition reaction by bacteria containing nitrate reductase. It is well known that denitrification occurs in the seafloor sediments of the broad shelves of the Bering Sea and the Chukchi Sea [Citation38–Citation40]. Porewater containing iodide was diffused, and/or seawater, in which iodate was transformed to iodide via oxidizing sediments surface, was transported in bottom layer [Citation41]. Further investigation is needed to reveal how iodide is produced at the interface between bottom water and sediment.
4. Conclusion
We investigated the distribution of 129I in the Bering Sea and the Chukchi Sea and how it varied with changing water mass characteristics. Iodine-129 was observed almost uniformly from the Bering Shelf area to the Chukchi Sea. 129I concentration range is 1.3–2.22 × 10⁷ atoms L−1 for BCSW, 0.89–2.90 × 10⁷ atoms L−1 for BCWW, and 1.70–1.74 × 10⁷ atoms L−1 for MW. It is suggested that 129I concentration in MW correlates with salinity in 2013. We also revealed the vertical iodide distribution from the Bering Shelf area to the Chukchi Sea for the first time. The highest iodide concentrations were observed in the bottom layer at 12 stations out of 28 total stations. Considering the iodide production process, there is possibility that the highest iodide concentrations at bottom layer are influenced by iodide release from sediment.
Acknowledgments
We express our deep appreciation to the captain, the chief scientist, crew, and all scientists on board the Oshoro-Maru C255 Cruise for their assistance at sea and with water sampling. We express our deep appreciation to AMS Management Section of JAEA Aomori Research and Development Center for measurement of 129I/127I. Additionally, we thank Dr. Oki (Hokkaido University) and Dr. Kondo (Nagasaki University) for their help with water sampling and daily life on the ship. We wish to thank Mr. Takeda (JAEA) for the helpful comments in preparing this paper.
Disclosure statement
No potential conflict of interest was reported by the authors.
References
- Snyder G, Aldahan A, Possnert G. Global distribution and long-term fate of anthropogenic 129I in marine and surface water reservoirs. Geochem Geophys Geosyst. 2010;11:4.
- Wagner MJM, Dittrich-Hannen B, Synal H-A, et al. Increase of 129I in the environment. Nucl Instrum Methods Phys Res A. 1996;113:490–494.
- Raisbeck GM, Yiou F. 129I in the oceans: origins and applications. Sci Total Environ. 1999;237–238:31–41.
- Hou XL. Application of 129I as an environmental tracer. J Radioanal Nucl Chem. 2004;262:67–75.
- Suzuki T, Minakawa M, Amano H, et al. The vertical profiles of iodine-129 in the Pacific Ocean and the Japan Sea Before the routine operation of new nuclear fuel reprocessing plant. Nucl Instrum Methods Phys Res B. 2010;268:1229–1231.
- Toyama C, Muramatsu Y, Ucbida Y, et al. Variations of 129I in the atmospheric fallout of Tokyo. Japan J Environ Radioact. 2012;113:116–122.
- Smith JN, Ellis KM, Kilius LR. 129I and 137Cs tracer measurements in the Arctic Ocean. Deep-Sea Res. 1998;45:959–984.
- Matishov GG, Matishov DG, Namjatov AE, et al. Radioactivity near the Sunken Submarine “Kursk” in the Southern Barents Sea. Environ Sci Technol. 2002;36:1919–1922.
- Nagai H, Kudo A, Yamagata T, et al. The 2013-15 temporal variation in the 129I concentration in seawater in the southern Canada Basin. Nucl Instrum Methods Phys Res B. 2019;455:305–310.
- Aldahan A, Alfimov V, Possnert G. 129I anthropogenic budget: major sources and sinks. Appl Geochem. 2007;22:606–618.
- Nagai H, Hasegawa A, Yamagata T, et al. Anthropogenic 129I in the North Pacific, Bering and Chukchi Seas, and Arctic Ocean in 2012-2013. Nucl Instr Meth Phys Res B. 2015;361:680–684.
- Shaw TI. Physiology and Biochemistry of algae: halogens in algae. New York: Academic Press; 1962. p. 247–253.
- Truesdale VW, Nausch G, Waite TJ. The effects of the 2001 Barotropic intrusion of bottom-water upon the vertical distribution of inorganic iodine in the Gotland Deep. Cont Shelf Res. 2013;55:155–167.
- Bluhm K, Croot PL, Huhh O, et al. Distribution of iodide and iodate in the Atlantic sector of the southern ocean during austral summer. Deep-Sea Res. 2011;58:2733–2748.
- Tsunogai S, Sase T. Formation of iodide—iodine in the ocean. Deep-Sea Res. 1969;16:489–496.
- Sugawara K, Terada K. Iodine distribution in the western Pacific Ocean. J Nagoya Univ. 1957;3:81–102.
- Elderfield H, Truesdale VW. On the biophilic nature of Iodine in seawater. Earth Planet Sci Lett. 1980;50:105–114.
- Jickells TD, Boyd SS, Knap AH. Iodine cycling in the Sargasso Sea and the Bermuda Inshore Waters. Mar Chem. 1988;24:61–82.
- Nakayama E, Kimoto T, Isshiki K, et al. Determination and distribution of Iodide- and total-Todine in the North Pacific Ocean — by using a new automated electrochemical method. Mar Chem. 1989;27:105–116.
- Wong GTF. The marine geochemistry of iodine. Rev Aquat Sci. 1991;4:45–73.
- Truesdale VW, Jones K. Steady-state mixing of iodine in shelf seas off the British Isles. Cont Shelf Res. 2000;20:1889–1905.
- Suzuki T, Kitamura T, Kabuto S, et al. High sensitivity measurement of Iodine-129/Iodine-127 ratio by accelerator mass spectrometry. J Nucl Sci Technol. 2006;43(11):1431–1435.
- Suzuki T, Kabuto S, Amano H, et al. Measurement of indine-129 in seawater samples collected from the Japan Sea area using accelerator mass spectrometry: contribution of nuclear fuel reprocessing plants, Quat. Geochronol. 2008;3:268–275.
- Campos MLAM. New approach to evaluating dissolved iodine speciation in natural waters using cathodic stripping voltammetry and a storage study for preserving iodine species. Mar Chem. 1997;57:107–117.
- Danielson SL, Eisner L, Ladd C, et al. A comparison between late summer 2012 and 2013 water masses, macronutrients, and phytoplankton standing crops in the northern Bering and Chukchi Seas. Deep-Sea Res. 2017;135:7–26.
- Truesdale VW, Nausch G, Baker A. The distribution of iodine in the Baltic during summer. Mar Chem. 2001;74:87–98.
- Wong GTF, Zhang LS. Seasonal variations in the speciation of dissolved iodine in the Chesapeake Bay. Estuar Coast Shelf Sci. 2003;56:1093–1106.
- Bautista AT Ⅶ, Miyake Y, Matsuzaki H, et al. High-resolution 129I bomb peak profile in an ice core from SE-Dome site, Greenland. J Environ Radioact. 2018;184-185:14–21.
- Bautista AT Ⅶ, Matsuzaki H, Siringan FP. Histrical record of nuclear activities from 129I in corals from the northern hemisphere (Philippines). J Environ Radioact. 2016;164:174–181.
- Kadowaki M, Katata G, Terada H, et al. Impacts of anthropogenic source from the nuclear fuel reprocessing plants on global atmospheric Iodine-129 cycle: A model analysis. Atoms Environ. 2018;1(84):278–291.
- Reithmeier H, Lazarev V, Rühm W, et al. Estimate of European 129I releases supported by 129I analysis in an Alpine ice core. Environ Sci Technol. 2006;40:5891–5896.
- Reithmeier H, Lazarev V, Rühm W, et al. Anthropogenic 129I in the atmosphere: overview over major sources, transpot processes and deposition pattern. Sci Total Environ. 2010;408:5052–5064.
- Farrenkopf AM, Luther GW Ⅲ. Iodine chemistry reflects productivity and denitrification in the Arabian Sea: evidence for flux of dissolved species from sediments of western India into the OMZ. Deep-Sea Res. 2002;49:2303–2318.
- Farrenkopf AM, Dollhopf ME, Chadhain SN, et al. Reduction of iodate in seawater during Arabian Sea shipboard incubations and in laboratory cultures of the marine bacterium Shewanella putrefaciens strain MR-4. Mar Chem. 1997;57:347–354.
- Luther GW Ⅲ, Brendel PJ, Lewis BL, et al. Simultaneous measurement of O2, Mn, Fe, I− and S (–Ⅱ) in marine pore waters with a solid-state voltammetric microelectrode. Limnol Oceanogr. 1998;43:325–333.
- Price NB, Calvert SE. The geochemistry of iodine in oxidised and reduced Recent marine sediments. Geochim Cosmochim Acta. 1973;37:2149–2158.
- Chapman P. Changes in iodine speciation in the Benguela Current upwelling system. Deep-Sea Res. 1983;30:1247–1259.
- Devol AH, Codispoti LA, Christensen JP. Summer and winter denitrification rates in western Arctic shelf sediments. Cont Shelf Res. 1997;17:1029–1050.
- Tanaka T, Guo L, Deal C, et al. N deficiency in a well-oxygenated cold bottom water over the Bering Sea shelf: influence of sedimentary denitrification. Cont Shelf Res. 2004;2(4):1271–1283.
- Yamamoto-Kawai M, Carmack EC, McLaughlin FA. Nitrogen balance and Arctic throughflow. Nature. 2006;443:43.
- Price NB, Calvert SE. The contrasting geochemical behaviours of iodine and bromine in recent sediments from the Namibian shelf. Geochim Cosmochim Acta. 1977;41:1769–1775.