
 ?Mathematical formulae have been encoded as MathML and are displayed in this HTML version using MathJax in order to improve their display. Uncheck the box to turn MathJax off. This feature requires Javascript. Click on a formula to zoom.
ABSTRACT
The EPRI (1991) and the Clark et al. (2014) drift-flux correlations implemented in RELAP5/MOD3 code were benchmarked against the low-pressure void fraction data collected by Clark et al. (2014) at Purdue University and the high-pressure data collected by Anklam and Miller (1982) at ORNL. The Clark et al. correlation (2014) was found to perform best at low pressures of Clark et al. tests (2014), but the accuracy was deteriorated at higher pressures of Anklam and Miller tests (1982). To account for this effect, a pressure scaling factor has been added to the distribution parameter correlation to reduce the distribution parameter peaking at high pressures. This factor is dependent on the density ratio and it eliminates the distribution parameter enhancement effect for pressures over 0.5 MPa. It was confirmed that the new correlation with the correction improved the void fraction prediction performance at a higher pressure of Anklam and Miller tests (1982). The new correlation provides a transition between the Clark et al. correlation (2014) at low pressures and the correlation of Ozaki et al. (2013) and Ozaki and Hibiki (2015) at high pressures, which is excellent both in physical characteristics and scalability of two-phase flow in rod bundles.
1. Introduction
Accurate prediction of two-phase flow characteristics is crucial for nuclear thermal-hydraulic safety analyses [Citation1]. Several length scales are necessary to characterize two-phase flow phenomena, including the Kolmogorov turbulence length, bubble diameter, hydraulic equivalent diameter corresponding to sub-channels scale, and casing length scale such as a width of a channel box. The presence of multiple length scales complicates two-phase flow dynamics, particularly, in a large channel at a low liquid flow rate and low pressures [Citation2–Citation8]. Ohnuki and Akimoto [Citation9,Citation10] measured local two-phase flow parameters in a vertical large diameter pipe at low liquid flow rates and low pressures and observed gas channeling and liquid recirculation effects resulting in downward flow near the channel wall. At high pressures or high liquid flow rates these effects would be negligible compared to the mixture transport velocity. As most experiments in rod bundles have been interested in prototypic nuclear reactor operating conditions where both flow rate and pressure may be high, these effects may not have been seen in previous experiments. However, in both startup transients and accident conditions such as small-break Loss of Coolant Accidents (LOCAs), where the pressure and core flow rate may be low, these effects may be significant. Such effects have not been considered in current constitutive equations used in nuclear thermal-hydraulic system analysis codes. Some recent efforts have been conducted to incorporate the effects into constitutive equations for rod bundles [Citation11]. The improvement of drift-flux correlations is important because the fidelity of the correlation affects the accuracy of the area-averaged interfacial drag force model in system analysis codes [Citation12–Citation15].
illustrates a developmental timeline up to the present work. In previous research [Citation6], a correlation was developed for low pressure and low flow rate conditions in rod bundles based on experimental data collected at Purdue University. This was necessary because the Chexal-Lellouche correlation developed by EPRI [Citation15] and the correlation developed by Ozaki et al. [Citation16] and Ozaki and Hibiki [Citation17] did not agree with void fraction measurements collected in rod bundles under low pressures [Citation5] reflective of those present during start-up conditions in nuclear reactor systems. It was confirmed that the distribution parameter increased at low volumetric flux conditions before exponentially decreasing as superficial velocity increased, and asymptotically approached a constant value [Citation6]. The asymptotic value matched the distribution parameter of Ozaki et al. [Citation17] and Ozaki and Hibiki [Citation18], which was determined for rod bundles at high flow and high-pressure conditions.
Figure 1. Drift-flux correlation development timeline.
The goal of this study was to implement the correlation developed by Clark et al. [Citation6] in RELAP5/MOD3 [Citation19] and evaluate its applicability and accuracy. To do so, numerical analyses were carried out for the Purdue University rod bundle experiments conducted under low liquid flow and atmospheric pressure conditions [Citation5]. Additional numerical analyses were carried out using the two-phase mixture level swell tests in the Thermal Hydraulic Test Facility (THTF) at Oak Ridge National Laboratory (ORNL), conducted under low liquid flow and high-pressure conditions expected in a small-break LOCA [Citation20]. These tests enable investigation of the validity of pressure scaling of the Clark et al. correlation. Based on the analyses, the pressure scaling adopted in Clark et al. correlation has been improved.
2. Drift-flux correlations for rod bundle
2.1. Drift-flux model
One of the key models for predicting void fraction in advanced system analysis codes is the drift-flux model [Citation21]. The drift-flux model can be used to calculate the void fraction in two-phase flow systems by considering the covariance between the phase distribution and mixture volumetric flux as well as the local velocity slip between the phases. The general expression for the drift-flux model is given as:
where vg, α, jg, C0, j, and vgj are gas velocity, void fraction, gas volumetric flux, distribution parameter, mixture volumetric flux, and drift velocity, respectively. The < > and ≪ ≫ notations designate area-averaged and void-weighted area-averaged mean values, respectively. The distribution parameter and drift velocity are defined as:
Because the model requires constitutive relations for both of these parameters, it is possible for the two models to produce compensating errors such that inaccuracies in one parameter are absorbed by the other [Citation22]. This can lead to correct void fraction calculations using this model, while leaving a physically unrealistic distribution parameter model that cannot be used within the two-fluid model framework.
The RELAP5/MOD3 void fraction calculation in vertical bubbly and slug flow regimes is based on the drift-flux model. The interfacial force, Fi, is computed as
where vr is the relative velocity between the phases defined by
and
In EquationEqs. (7(7)
(7) ), ρg and ρf are the gas and liquid phase densities, respectively, and
is the elevation angle of the junction.
Both the distribution parameter, C0, and the vapor drift-velocity, ≪vgj≫, are calculated from the geometry and flow condition [Citation23]. For vertical bubbly and slug flows in rod bundle geometries, the Chexal-Lellouche drift-flux correlation [Citation16] is utilized to compute the distribution parameter and the vapor drift velocity.
2.2. Existing drift-flux correlations for rod bundle geometry at low flow
A discussion on existing drift-flux correlations for rod bundles at low flow are presented in this section and summarized in .
Table 1. Relevant drift-flux correlations.
2.2.1 Chexal-lellouche correlation [Citation16]
The Chexal-Lellouche void fraction correlation [Citation16], known also as the EPRI correlation, is an empirical drift-flux type correlation. It was originally developed based on a large experimental database to allow the prediction of void fraction in Light Water Reactors (LWRs) without needing to know the flow regime. This eliminates the need for flow regime maps and multiple-step errors. The drift-flux type form was selected due to its importance in the nuclear industry and the importance of the distribution parameter for predicting interfacial drag force in one-dimensional two-fluid model calculations. It was benchmarked using a variety of steam-water boiling data and refrigerant-vapor flows, as well as adiabatic two-phase flows.
While this correlation does perform well for a variety of two-phase flow conditions, it is also very complex and very cumbersome. This may be a disadvantage for implementation and use in computer codes. Because the model is benchmarked against such a wide range of data it may also suffer from over-generalization. Finally, the model is very empirical in nature. The individual components of the model have no physical basis for evaluation. Thus, the model may include many compensating errors in the distribution parameter and drift velocity that limit the accuracy of the correlation when the distribution parameter model is used alone to predict the interfacial drag force.
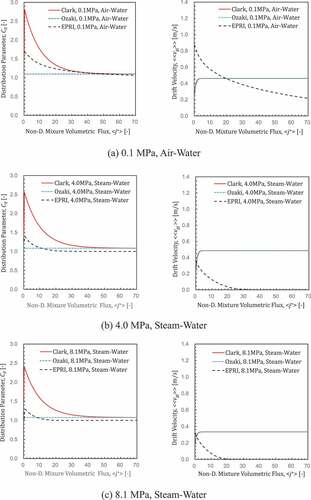
This effect is further investigated in , where the individual drift-flux parameters are plotted against the non-dimensional mixture volumetric flux. The graph indicates that the Chexal-Lellouche distribution parameter shows a slight increase for low volumetric fluxes, consistent with the recirculation behavior. However, the drift velocity given by Chexal-Lellouche seems to be very high under atmospheric pressure and low mixture volumetric flux conditions. The drift velocity observed by Kataoka and Ishii [Citation24] is approximately 0.5 m/s for pool conditions at atmospheric pressure condition, whereas the drift velocity calculated by Chexal-Lellouche correlation is approximately 0.8 m/s. As this component of the drift-flux model is much more significant than the distribution parameter when the mixture volumetric flux is small, the void fraction predictions are poor. This indicates the presence of significant compensating errors in the Chexal-Lellouche correlation. These compensating errors are especially important in this case, because of the interfacial drag force model for vertical flow in a rod bundle in RELAP5. Using this equation the discrepancy in the drift velocity may lead to much larger errors in the interfacial drag forces.
Figure 2. Velocity scaling of drift-flux parameters.
On the other hand, the drift velocity is calculated by Hibiki-Ishii correlation [Citation2], EquationEquation (12)(12)
(12) , in the correlations of Clark et al. [Citation6] and Ozaki and Hibiki [Citation18]. The drift-velocity calculated by Hibiki-Ishii correlation [Citation2] is consistent with the observation by Kataoka and Ishii [Citation24] in large diameter pipes. When jg+ is lower than 0.5, the flow is not affected by the presence of wall, and the drift velocity is represented by the correlation of Ishii [Citation25] for bubbly flow. Kataoka and Ishii [Citation24] demonstrated that the drift velocity increased in increased jg+ due to the formation of cap bubbles and leveled off at relatively high jg+ condition correspond to high j+ condition. It should be noted here that the above discussion is valid for dispersed two-phase flow. As void fraction approaches unity, the drift velocity should approach zero.
2.2.2 Ozaki-hibiki correlation [Citation17,Citation18]
Based on the work of Ishii [Citation25] to develop drift-flux correlations in pipes, the distribution parameter can generally be written as
Experimental studies have shown that the value of C∞ is relatively constant over a wide range of Reynolds numbers for medium-size diameter pipes [Citation25].
Ozaki et al. [Citation17] and Ozaki and Hibiki [Citation18] determined C∞ to be 1.10 for rod bundles using data collected from the NUPEC facility at prototypic BWR operating conditions. It should be noted here that when the effect of unheated rod on the distribution parameter is significant, C∞ = 1.08 should be utilized. The value C∞ = 1.10 is only valid for void fractions higher than 0.2 and was determined by a curve fit of void fraction and mixture volumetric flux measurements. They assumed that the Hibiki-Ishii drift-velocity correlation [Citation2] for large diameter channels was valid, as this model accounts for the recirculation behavior that is expected at low pressures in rod bundles. This model is valid for flow channels with a diameter larger than a critical size, which they give as:
where σ, g and Δρ are surface tension, gravitational acceleration and density difference between two phases, respectively. The drift velocity for flow channels larger than this can be expressed as:
where the viscosity number is defined as:
In EquationEquation (11)(11)
(11) , μf is liquid viscosity.
Hibiki and Ishii [Citation2] used this model to develop a more comprehensive model that is also applicable in dispersed bubbly flows. This model for the drift velocity is given by:
Here the cap-bubbly drift velocity is given by EquationEquation (10)(10)
(10) and the bubbly flow drift velocity is given by Ishii [Citation24] as:
and the non-dimensional mixture volumetric flux is defined as:
Ozaki et al. [Citation17] and Ozaki and Hibiki [Citation18] adopted EquationEquation (12)(12)
(12) for calculating drift velocity in rod bundles because it may adjust for the effect of recirculating flow patterns that develop over the rod bundle cross section. The velocity scaling at high pressures has been validated by Ozaki et al. [Citation17] and Ozaki and Hibiki [Citation18]. In these validations, the model performance improves with increasing liquid flow rate, as the uncertainties in the drift-velocity model become less significant in the calculation of void fraction.
2.2.3 Clark et al. correlation [Citation6]
After noting discrepancies between low-pressure rod bundle data collected by Chen et al. [Citation4,Citation5] and existing drift-flux correlations, Clark et al. [Citation6] collected additional data and developed a correlation for the distribution parameter that accounted for distribution parameter peaking at low flow rates and atmospheric pressure conditions. In this case, the distribution parameter under low flow rate conditions reached values as high as 2.9, as shown in ). According to their correlation,
Figure 3. Distribution parameter of Clark et al. correlation [Citation5].
![Figure 3. Distribution parameter of Clark et al. correlation [Citation5].](/cms/asset/200c77a3-9efc-4683-9278-97eeacfa31db/tnst_a_1700843_f0003_c.jpg)
In the above equation, superficial gas and liquid velocities and drift velocity given by EquationEquation (12)(12)
(12) are non-dimensionalized by a velocity scale of
. EquationEquation (12)
(12)
(12) is used to predict the drift velocity.
) is provided to illustrate the terminology utilized to describe the behavior to the distribution parameter. The distribution parameter first increases at low volumetric flux conditions before exponentially decreasing as volumetric flux increased, and approaches asymptotically to a constant value. These regions may be characterized by differing two-phase flow structures. The initial increase in the distribution parameter towards a maximum value, , may be attributed to an increasing concentration of gas in the high velocity (central) regions of the flow channel and downward liquid flow at the outer perimeter. On the other hand, increasing the flow rate beyond the conditions for
enhances co-current flow which would effectively decrease the distribution parameter. This decrease approaches a constant value designated as
. From the data trend, the value of
is approximately 1.10, which matches the distribution parameter determined by Ozaki et al. [Citation17] and Ozaki and Hibiki [Citation18] for rod bundles at prototypic conditions. The mixture volumetric flux condition at which
occurs is referred to here as
. As liquid volumetric flux increases,
increases, and
decreases. These transitions are expected to be related to changes in two-phase flow structure.
The velocity scaling at low pressure has been validated by Clark et al. [Citation6] and the correlation works well for liquid velocities of up to 1 m/s or more.
3. Experimental database utilized for assessment of rod bundle correlations
The performance of the drift-flux correlations is evaluated by comparing the void fraction predicted by the drift-flux correlations with the experimentally measured void fraction. The experiments of Clark et al. [Citation5] were used, as were the experiments of Anklam and Miller [Citation20].
3.1 Purdue university rod bundle tests
Two-phase low flow data were taken systematically from a well-scaled 8 × 8 acrylic rod bundle test facility at atmospheric pressure with air and water as working fluids. shows the rod bundle test section as (a) axial view and (b) cross-sectional view. The casing of the rod bundle was made of transparent acrylic plates in a 140 × 140 mm square duct. The acrylic rods had a diameter of 12.7 mm and a pitch of 16.7 mm. There were seven spacer grids located along the length of the test section to limit vibration and simulate spacers in the prototypic design. The impedance meters 1–7 were located at z/DH, Case = 0.7, 9.0, 10.0, 12.2, 13.1, 14.5, and 21.1, respectively. The seven pressure ports were at the same locations. The height of the test facility was 3 m. Area averaged void fraction measurements were performed using impedance meters 4 and 6. These locations were far enough downstream from the spacer grids so that their effect on interfacial structure was negligible. The six different superficial liquid flow conditions utilized were <jf>= 0.00, 0.10, 0.25, 0.50, 0.75, 1.00 m/s.
Figure 4. Rod bundle test section of the Purdue University 8 × 8 bundle [Citation4].
![Figure 4. Rod bundle test section of the Purdue University 8 × 8 bundle [Citation4].](/cms/asset/2ad571e6-daea-4e71-8160-7ec0872f6e07/tnst_a_1700843_f0004_oc.jpg)
shows the measurements from the impedance meters. In ), the data is collected systematically by maintaining <jf> over several <jg> conditions. In ), data is plotted on a drift-flux plane with two reference lines. The abscissa and ordinate are non-dimensionalized by a velocity scale of . The solid line uses the bubbly flow drift velocity at a 30% void fraction. This is provided as a general minimum for drift velocity when superficial gas velocity is low. The broken line uses the drift velocity for large flow channels. This is provided as general maximum for drift velocity as superficial gas velocity is increased to cap-bubbly regimes. Both lines utilize the distribution parameter determined by Ozaki et al. [Citation17] and Ozaki and Hibiki [Citation18] for rod bundles. The data trend increases beyond the demonstrative lines at lower flow rates before converging again at higher flow conditions. Since the broken line represents an upper bound for drift velocity, the distribution parameter should be responsible for the increase in the gas velocity, ≪vg≫. During those low flow conditions, the increased concentrations of void fraction develop in the central region, promote the formation of cap bubbles and increased distribution parameter.
Figure 5. Rod bundle data of the Purdue University 8 × 8 bundle [Citation4].
![Figure 5. Rod bundle data of the Purdue University 8 × 8 bundle [Citation4].](/cms/asset/62c689d1-9a5c-474a-8fd6-00ef0089fad2/tnst_a_1700843_f0005_c.jpg)
3.2 ORNL/THTF void profile tests
The THTF is a high-pressure bundle thermal-hydraulics loop, and designed to produce a thermal-hydraulic environment similar to that expected in a small-break LOCA. The axial void fraction profiles were obtained from differential pressure measurements. The bundle domain was divided into nine differential pressure cells along the axis length. The volume averaged void fractions were obtained at the mid-heights of the differential pressure cell measurements. As for differential pressure cells including the beginning of the boiling length, the void fractions were obtained at the mid-heights of the two-phase regions of the cells.
The test section consisted of the bundle domain, shroud box, shroud-plenum annulus, and test section barrel. The bundle domain consisted of 60 heated rods and 4 unheated rods, their pitches were 1.27 cm. The outside diameter of all rods was 0.95 cm. These are the same values as typically used for a 17 × 17 fuel assembly. The heated rods had a heater surrounded by boron nitride, and a stainless steel sheath outside.
The void profile tests were started by boiling off water from the bundle, which was originally filled with water. On reaching the quasi-steady state, subcooled water was supplied from the bundle domain bottom in order to compensate for the amount of transpiration from the bundle domain top, and the bundle was uncovered partially.
The ORNL/THTF experiment was conducted to collect heat transfer coefficient and void fraction distribution data at the fuel rod bundle uncovered by water under high pressure and low power conditions. In total, 12 tests were performed as parameters of pressure and simulated fuel rod power. In each test, subcooled water was supplied from the bottom of the bundle to compensate the evaporation amount of the water. Thus, the two-phase level was kept constant. The data were obtained under quasi-steady state conditions in the bundle where the simulated fuel rods were partially uncovered by the water. The two-phase level was defined as the boundary between the heating and saturated temperature regions, which could be obtained from the axial distribution of the simulated fuel rod temperature.
shows the void fraction data from the boil off experiment. In ), the data is collected under stagnant liquid flow conditions. In ), the data is plotted on a drift-flux plane with two reference lines. The data trend is included between the demonstrative lines which provide an upper and lower bound based on a range of feasible drift-velocity values and a constant distribution parameter. As system pressure increases, the effect would be reduced which is caused by the concentrations of void fraction developed in the central region during low-pressure conditions.
Figure 6. Rod bundle data of the ORNL/THTF 8 × 8 bundle [Citation19].
![Figure 6. Rod bundle data of the ORNL/THTF 8 × 8 bundle [Citation19].](/cms/asset/8d9e2be2-5fd2-4aba-9f17-88ea4c05f3ec/tnst_a_1700843_f0006_c.jpg)
The data reported by Anklam and Miller [Citation20] needs to be corrected to account for incorrect reporting of units. They were reported to have units of m/s but were actually reported in ft/s. This correction has been made in the data tables included in this paper and this has been confirmed by the current analysis of data.
4. Assessment of Clark et al. correlation using rod bundle data
The Clark et al. correlation [Citation6] was implemented in the RELAP5/MOD3 code, and numerical analyses were carried out for the Purdue University rod bundle tests [Citation5] to investigate the applicability of the correlation to the RELAP5 code. In addition, the numerical analyses were conducted for the ORNL/THTF void profile tests [Citation20] to investigate the applicability of the Clark et al. correlation [Citation6] to low liquid flow and high-pressure conditions. The analysis results are compared with those by the EPRI correlation implemented in the original RELAP5 code.
4.1 Purdue university rod bundle test analysis
4.1.1 Analysis methods
shows the nodalization of the Purdue University bundle test analyses. The bundle domain was represented by a RELAP5 pipe component divided into 26 volumes. The part of the test section from impedance meters 4 to 6 was represented by fine nodes. The inlet conditions of the bundle domain were the same as in the experiments. To inject water and air into the bottom of the bundle domain, time-dependent volumes and time-dependent junctions were connected to the bottom of the bundle domain. The injection flow rates were controlled so that the liquid and gas volumetric fluxes at the measuring position matched those of the experiments. The injected water and air temperatures were the same as the tests. The outlet plenum was simulated by a single volume. To get a free outflow boundary condition, the time-dependent volume and a normal junction were connected to the outlet plenum. The pressure was the same as that of the test. Analysis cases in this study are listed in .
Table 2. Analysis cases for Purdue University rod bundle tests.
Figure 7. Nodalization for Purdue University bundle analyses.
4.1.2 Analysis results
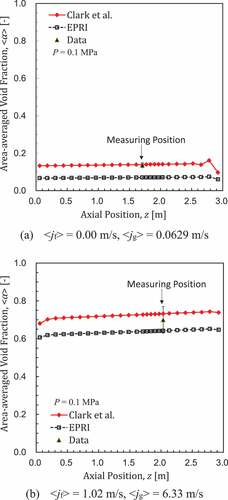
compares the predicted void fraction profiles by Clark et al. [Citation6] and EPRI correlations for (a) the test carried out at <jf>= 0.00 m/s, <jg>= 0.0629 m/s and (b) the test carried out at <jf>= 1.02 m/s, <jg>= 6.33 m/s. The red solid line with open diamonds and black dotted line with open squares indicate the prediction of void fraction by Clark et al. correlation [Citation6] and EPRI correlation, respectively. When the axial positions become higher, the predicted void fractions slightly increase. This is because the gas pressures are lower at the higher axial position. In this sense, the RELAP5 code implementing Clark et al. correlation [Citation6] makes a reasonable prediction as well as the EPRI correlation. In ), the measured void fraction at the position of impedance meter #4 is shown by a sold triangle. The void fraction predicted by Clark et al. correlation [Citation6] is within the ±10% error band of the measured value. On the other hand, the void fraction predicted by the EPRI correlation is below the ±10% error band of the measured value. In ), the measured void fraction at the position of impedance meter #6 is also shown by a solid triangle. Although both the void fractions predicted by Clark et al. correlation [Citation6] and the EPRI correlation are within the ±10% error band of the measured value, Clark et al. correlation [Citation6] makes a better prediction than the EPRI correlation.
Figure 8. Predicted void fraction profiles (Measured void fractions are also plotted with the ±10% error band).
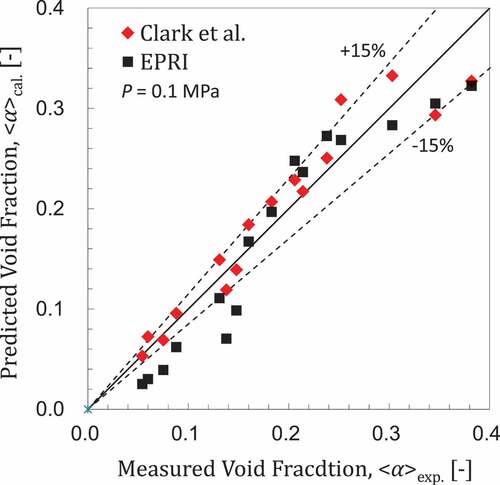
compares void fraction prediction performance for the Purdue University bundle tests between Clark et al. [Citation6] and the EPRI correlations. Solid red diamond and solid black squares indicate the comparison with Clark et al. correlation [Citation6] and EPRI correlation, respectively. Here, there no distinct biases are present in void fraction predicted by Clark et al. correlation [Citation6] and the random error is mostly within the ±15% error band. On the other hand, disagreement is observed between the EPRI correlation and data, especially at lower void fractions. This error was expected and can be attributed to the empirical relations of the EPRI correlation not appropriately considering two-phase flow mechanisms at low flow and low-pressure conditions.
Figure 9. Void fraction prediction for Purdue University bundle tests.
4.2 ORNL/THTF rod bundle tests analysis
4.2.1 Analysis methods
shows the nodalization of the ORNL/THTF bundle analyses. The bundle domain (simulated heated region only) was divided into volumes corresponding to the differential pressure cells, so that the volume center positions became the void fraction evaluation positions. The differential pressure cells which included the beginning of the boiling length were also divided by the beginning of the boiling length. The heated rods and the shroud box surrounding the bundle domain were simulated as the heat structure. Since the heat loss from the shroud box was evaluated in the tests, it was also simulated in the analyses.
Figure 10. Nodalization for ORNL/THTF bundle analyses.
To inject subcooled water into the bottom of the bundle domain, a time-dependent volume and a time-dependent junction were connected to the bottom of the bundle domain. The injection flow rate was controlled so that the two-phase water level of the bundle domain matched that of the test, and the injected water temperature was the same as the test. To get a free outflow boundary condition, the time-dependent volume and a normal junction were connected to the top of the bundle domain. The pressure of the top of the bundle domain was the same as that of the test, and the state at the top of the bundle domain was single-phase saturated vapor. The initial condition of the bundle domain was 478 K water, the same as in the tests. Analysis cases in this study are listed in .
Table 3. Analysis cases for ORNL/THTF rod bundle tests.
4.2.2 Analysis results
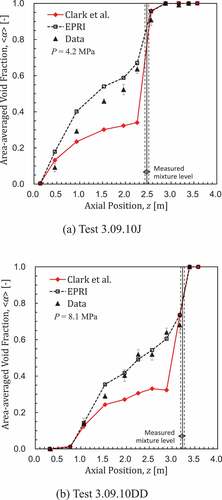
compares the predicted void fraction profiles by Clark et al. [Citation6] and the EPRI correlation for (a) Test 3.09.10 J (4.20 MPa) and (b) Test 3.09.10DD (8.09 MPa). The red solid line with solid diamond and black dotted line with solid squares indicate the prediction of void fraction by Clark et al. correlation [Citation6] and EPRI correlation, respectively. Solid black triangles indicate the measured data. Because the drift-flux correlations are used in RELAP5/MOD3 code to calculate void fractions in vertical bubbly and slug flow regimes, the void fraction data points below the mixture level are the target for evaluation of the drift-flux correlations. As shown in the figure, the EPRI correlation predicts void fractions reasonably well. This is the expected result, because the ORNL/THTF tests were used to validate the EPRI correlation. On the other hand, the predicted void fractions by Clark et al. correlation [Citation6] reach a plateau about <≥ 0.35, and underestimate the measured values considerably at higher void fractions. The results suggest that the distribution parameter of Clark et al. correlation [Citation6] is excessive for the high-pressure experimental conditions.
Figure 11. Predicted void fraction profiles.
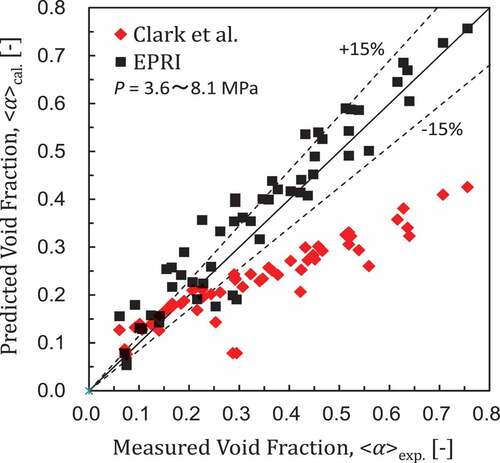
compares void fraction prediction performance for the ORNL/THTF bundle tests between Clark et al. [Citation6] and the EPRI correlations. Solid red diamond and solid black squares indicate the comparison with Clark et al. correlation [Citation6] and EPRI correlation, respectively. This behavior was expected, as the Clark et al. correlation [Citation6] was not validated under high-pressure conditions. The results of Clark et al. correlation [Citation6] show poor agreement with the Anklam and Miller data [Citation20] of pressures from 4.2 to 8.2 MPa. This indicates that the recirculation effects accounted for by the model developed by Clark et al. [Citation6] may disappear at lower pressures than were first thought [Citation6].
Figure 12. Void fraction prediction for ORNL/THTF bundle tests.
5. Modification of Clark et al. correlation and its validation
As shown in Section 4, implementing the correlation developed by Clark et al. [Citation6] in the system analysis code RELAP5/MOD3 allows the code to successfully predict the void fraction in rod bundles under low flow and low-pressure conditions. However, for low flow and high pressures such as those indicated in , the results were poor. This indicates that the correlation for C∞ may not accurately account for the pressure scaling at high pressures, even though velocity scaling is correct. This will lead to deteriorated prediction accuracy for moderate pressures.
The pressure scaling in the distribution parameter correlation of Clark et al. [Citation6] may be incorrect. The correlation includes the effect of changes in the fluid properties through the non-dimensionalized flux; however, this may be insufficient to account for the changes in recirculating behavior as the buoyancy decreases at high pressure. A density ratio term may need to be implemented in order to correct the pressure scaling.
5.1 Pressure scaling of recirculation effect
To account for the pressure scaling of the recirculation effect noted by Clark et al. [Citation6], the distribution parameter correlation of Clark et al. [Citation6] is modified such that
The function F is defined as
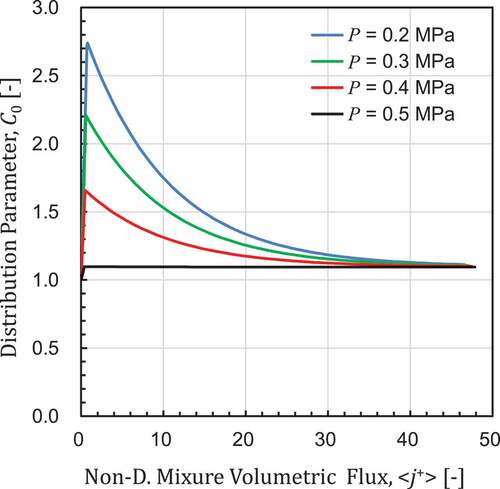
illustrates the function F. This simple linear relationship is equal to 1 for air-water at atmospheric pressure, with a density ratio of 0.0012, and is reduced to zero at a density ratio of 0.00292. This density ratio occurs at a pressure of 0.5 MPa for steam-water systems. This pressure value was chosen based on experimental results for instability in BWR systems, namely the work of Shi et al. [Citation26]. In that work, extensive stability testing was done in a simulated BWR Reactor Pressure Vessel (RPV) to determine the conditions under which various instabilities, including density wave oscillation, were expected. The experimental results indicated that two-phase flow instabilities were essentially eliminated for pressures above 0.5 MPa, but could be clearly seen at lower pressures.
Figure 13. Correction factor.
As there are no experimental data between 0.1 MPa and 3 MPa to confirm this trend, and the data at 3 MPa is somewhat inconclusive, it should be kept in mind that this simple equation is an assumed correlation, and it should be used with caution. While there are some physical reasons for believing that this behavior will approximately reflect the actual system, it should be confirmed with additional experimental data. shows the pressure dependence of the modified distribution parameter.
Figure 14. Distribution parameters.
5.2 Validation using ORNL/THTF bundle test data
The modified distribution parameter correlation is implemented in the RELAP5/MOD3 code, and numerical analyses were conducted for the ORNL/THTF void profile tests to investigate the applicability of the new correlation to low liquid flow and high-pressure conditions.
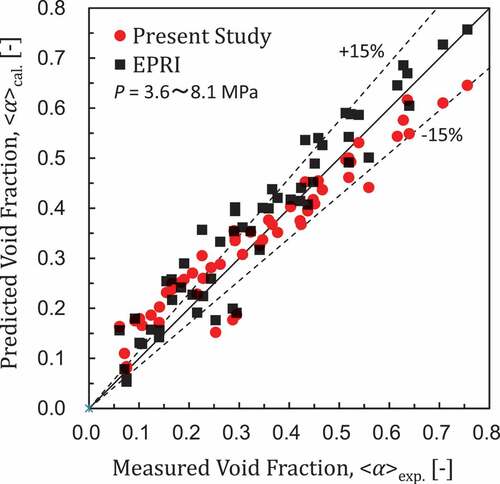
compares the predicted void fraction profiles by Clark et al. [Citation6] and the EPRI correlations for (a) Test 3.09.10 J (4.20 MPa) and (b) Test 3.09.10DD (8.09 MPa). The red solid line with solid diamond and black dotted line with solid square indicate the prediction of void fraction by the new correlation and EPRI correlation, respectively. Solid black triangles indicate the measured data. The figure clearly shows that the new correlation is able to better predict the axial void fraction development of some experiments performed at moderate pressures, but that the two models have a similar performance at very high pressures. compares void fraction prediction performance for the ORNL/THTF bundle tests between the modified correlation and the EPRI correlations. Solid red diamonds and solid black squares indicate the comparison with new correlation [Citation6] and EPRI correlation, respectively. The new correlation appears to give much more consistent predictions – the points in the figure are slightly more closely grouped along a single line.
Figure 15. Predicted void fraction profiles.
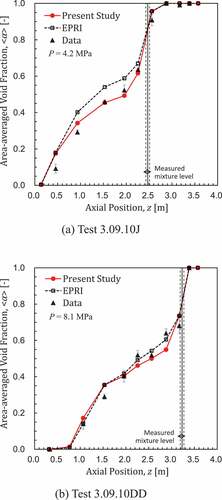
Figure 16. Void fraction prediction for ORNL/THTF bundle tests.
The prediction accuracy of each drift-flux correlation for the ORNL/THTF data is given in . The following statistical parameters are introduced here to highlight the bias, md, and random uncertainty, sd, of the correlations.
Table 4. Prediction uncertainty of drift-flux correlations for ORNL/THTF data.
and indicate that the new correlation has similar performance to the EPRI correlation at high pressure. However, indicates that the new correlation performs better than the EPRI correlation at low pressure. Thus, the new correlation shows the potential to provide more accurate analyses for a range of conditions during reactor startup or accident conditions. Unfortunately, there is limited data available for validation of the new correlation at pressures between 0.1 and 1 MPa, which will be necessary to fully validate the pressure correction term in the new correlation. On the other hand, as indicated in , the void fraction seems to be overestimated at low void fraction and underestimated at a high void fraction. However, since the data is rather scattered, and the comparison is based on a single database, further studies should be made to assess the validity of the newly developed correlation and if necessary, further improvement of the correlation should be made in a future work.
6. Conclusions
Ozaki et al. [Citation17] developed a drift-flux correlation for 8 × 8 rod bundle based on NUPEC data taken under high pressure and temperature conditions. Ozaki and Hibiki [Citation18] discussed the effect of unheated rods on the drift-flux correlation and demonstrated that the presence of the unheated rods decreased the asymptotic distribution parameter from 1.10 to 1.08. Clark et al. [Citation6] developed a drift-flux correlation for 8 × 8 rod bundle based on Purdue data taken under atmospheric pressure and low flow conditions. The present paper examined the applicability of the correlation of Clark et al. [Citation6] to elevated pressure conditions by implementing the correlation of Clark et al. [Citation6] into RELAP5 code.
The EPRI [Citation16] and the Clark et al. [Citation6] drift-flux correlations implemented in RELAP5/MOD3 code were benchmarked against the low-pressure void fraction data collected by Clark et al. [Citation5] at Purdue University and the high-pressure data by Anklam and Miller [Citation20] at ORNL. The EPRI correlation [Citation16] was found to have reasonable performance under most conditions, except for at low pressures and void fraction of less than 0.15. However, analysis of the distribution parameter and drift-velocity models indicates that the drift-velocity predictions are unrealistically high over a wide range of pressures, and the error is compensated for in the distribution parameter model.
The Clark et al. correlation [Citation6] was found to perform best at low pressures [Citation5], but the accuracy was deteriorated at higher pressures [Citation20]. To account for this effect, a scaling factor has been added to the distribution parameter model to reduce the distribution parameter peaking at high pressures. This factor is dependent on the density ratio and it eliminates the distribution parameter enhancement effect for pressures over 0.5 MPa. It was confirmed that the new correlation with the correction improved the void fraction prediction performance at higher pressure [Citation20].
The new correlation provides a transition between the Clark et al. correlation [Citation6] at low pressures and the correlation of Ozaki et al. [Citation17] and Ozaki and Hibiki [Citation18] at high pressures, which is excellent both in physical characteristics and scalability of two-phase flow in rod bundles. The validity of the new correlation has been verified with the data taken by Purdue University (0.0 m/s ≤ <jf> ≤ 1.03 m/s, 0.01 ≤ <α> ≤ 0.93 and P = 0.1 MPa) and by ORNL (0.0 m/s ≤ <jf> ≤ 0.032 m/s, 0.06 ≤ <α> ≤ 0.76 and P= 3.59 and 8.09 MPa). It is recommended that the applicability of the new correlation to the pressure range between 0.1 MPa and 3.59 MPa should be examined in a future study.
Nomenclature
| A | = | Constant [-] |
| B | = | Constant [-] |
| b | = | Constant [-] |
| C | = | Constant [-] |
| C0 | = | Distribution parameter [-] |
| C∞ | = | Asymptotic distribution parameter [-] |
| C∞H | = | High-flux parameter [-] |
| C∞L | = | Low-flux parameter [-] |
| D1 | = | Diameter scale [m] |
| D2 | = | Diameter scale [m] |
| Dcrit | = | Critical bubble diameter [m] |
| F | = | Correction factor [-] |
| G | = | Mass flux [kg/m2s] |
| g | = | Gravitational acceleration [m/s2] |
| hfg | = | Latent heat [kJ/kg] |
| j | = | Mixture volumetric flux [m/s] |
| j+Cmax | = | Critical mixture volume flux [m/s] |
| K0 | = | Parameter [-] |
| L | = | Chexal-Lellouche parameter [-] |
| m | = | Constant [-] |
| Nμf | = | Viscose number [-] |
| P | = | Pressure [kPa] |
| q’ | = | Linear heat rate [kW/m] |
| r | = | Constant [-] |
| Re | = | Reynolds number [-] |
| Vgj0 | = | Base drift velocity [m/s] |
| v | = | Velocity [m/s] |
| vgj | = | Drift velocity [m/s] |
| x | = | Thermodynamic quality [-] |
| z | = | Axial position [m] |
Greek symbols
| α | = | Void fraction [-] |
| αcrit | = | Critical void fraction [-] |
| ε | = | Error [-] |
| μ | = | Viscosity [Pa·s] |
| ρ | = | Density [kg/m3] |
| σ | = | Surface tension [N/m] |
Subscripts/Superscripts
| f | = | Value for liquid |
| g | = | Value for gas |
| sat | = | Saturation value |
| m | = | Mixture value |
| + | = | Non-dimensionalized velocity |
Mathematical symbols
| < > | = | Area averaged value |
| ≪ ≫ | = | Void fraction weighted area averaged value |
Disclosure statement
No potential conflict of interest was reported by the authors.
References
- Yeoh GH. Thermal hydraulic considerations of nuclear reactor systems: past, present and future challenges. Exp Comput Multiphase Flow. 2019;1(1):3–27.
- Hibiki T, Ishii M. One-dimensional drift-flux model for two-phase flow in a large diameter pipe. Int J Heat Mass Transfer. 2003;46:1773–1790.
- Chen SW, Liu Y, Hibiki T, et al. Experimental study of air-water two-phase flow in 8 × 8 rod bundle under pool condition for one-dimensional drift-flux analysis. Int J Heat Fluid Flow. 2012;33:168–181.
- Chen SW, Liu Y, Hibiki T, et al. One-dimensional drift-flux model for two-phase flow in pool rod bundle systems. Int J Multiphase Flow. 2012;40:166–177.
- Clark C, Griffiths M, Chen SW, et al. Experimental study of void fraction in an 8 × 8 rod bundle at low pressure and low liquid flow conditions. Int J Multiphase Flow. 2014;62:87–100.
- Clark C, Griffiths M, Chen SW, et al. Drift-flux correlation for rod bundle geometries. Int J Heat Fluid Flow. 2014;48:1–14.
- Abbs T, Hibiki T. One-dimensional drift-flux correlation for vertical upward two-phase flow in a large size rectangular channel. Prog Nucl Energy. 2019;110:311–324.
- Zhao Q, Hibiki T. One-dimensional drift-flux correlation for vertical upward two-phase flow in large size concentric and eccentric annuli. Int J Multiphase Flow. 2019;113:33–44.
- Ohnuki A, Akimoto H. An experimental study on developing air-water two-phase flow along a large vertical pipe: effect of air injection method. Int J Multiphase Flow. 1996;22:1143–1154.
- Ohnuki A, Akimoto H. Developed flow pattern and phase distribution under gas-liquid two-phase flow in a large vertical pipe and prediction of phase distribution by multidimensional two-fluid model. Proceedings of the 8th International Topical Meeting on Nuclear Reactor Thermal Hydraulics (NURETH-8); 1997 September 30-October 4; Kyoto, Japan.
- Hibiki T, Ozaki T, Shen X, et al. Constitutive equations for vertical upward two-phase flow in rod bundle. Int J Heat Mass Transfer. 2018;127:1252–1266.
- Hibiki T, Ozaki T. Modeling of void fraction covariance and relative velocity covariance for upward boiling flow in vertical pipe. Int J Heat Mass Transfer. 2017;112:620–629.
- Ozaki T, Hibiki T. Modeling of distribution parameter, void fraction covariance and relative velocity covariance for upward steam-water boiling flow in vertical rod bundle. J Nucl Sci Technol. 2018;55:386–399.
- Ozaki T, Hibiki T, Miwa S, et al. Development of one-dimensional two-fluid model with consideration of void fraction covariance effect. J Nucl Sci Technol. 2018;55:720–732.
- Ozaki T, Hibiki T, Miwa S, et al. Effect of void fraction covariance on two-fluid model based code calculation in pipe flow. Prog Nucl Energy. 2018;108:319–333.
- Chexal B, Lellouche G, Horowitz J, et al. The Chexal-Lellouche void fraction correlation for generalized applications. Nuclear Safety Analysis Center of the Electric Power Research Institute, NSAC-139; 1991.
- Ozaki T, Suzuki R, Mashika H, et al. Development of drift-flux model based on 8 × 8 BWR rod bundle geometry experiments under prototypic temperature and pressure conditions. J Nucl Sci Technol. 2013;50:563–580.
- Ozaki T, Hibiki T. Drift-flux model for rod bundle geometry. Prog Nucl Energy. 2015;83:229–247.
- RELAP5/MOD3.3, Code Manual Volume IV: Models and Correlations, NUREG/CR-5535/Rev1, Prepared for the Division of Systems Research, Office of Nuclear Regulatory Research. USNRC by Information Systems Laboratories, Inc., Rockville, Maryland, 2001.
- Anklam TM, Miller RJ. Void fraction under high pressure, low flow conditions in rod bundle geometry. Nucl Eng Des. 1982;75:99–108.
- Zuber N, Findlay JA. Average volumetric concentration in two-phase flow systems. J Heat Transfer. 1965;87:453–468.
- Griffiths MJ, Schlegel JP, Clark C, et al. Uncertainty evaluation of the Chexal-Lellouche correlation for void fraction in rod bundles. Prog Nucl Energy. 2014;74:143–153.
- Hibiki T. One-dimensional drift-flux correlations for two-phase flow in medium-size channels. Exp Comput Multiphase Flow. 2019;1(2):85–100.
- Ishii M. One-dimensional drift-flux model and constitutive equations for relative motion between phases in various two-phase flow regimes. Argonne National Laboratory, ANL-77-47; 1977.
- Katoaka I, Ishii M. Drift flux model for large diameter pipe and new correlation for pool void fraction. Int J Heat Mass Transfer. 1987;30:1927–1939.
- Shi S, Schlegel JP, Brooks CS, et al. Experimental investigation of natural circulation instability in a BWR-type small modular reactor. Prog Nucl Energy. 2015;85:96–107.