
 ?Mathematical formulae have been encoded as MathML and are displayed in this HTML version using MathJax in order to improve their display. Uncheck the box to turn MathJax off. This feature requires Javascript. Click on a formula to zoom.
ABSTRACT
In-vessel retention (IVR) is a strategy for severe accident management in which the lower head of the reactor vessel is submerged in a water-flooded reactor cavity. Critical heat flux (CHF) data for IVR are important for estimating cooling capacity of the reactor vessel. The existing CHF data for IVR which were obtained for the specific geometries and thermal-hydraulic conditions of actual plants are difficult to be applied to plants with other specifications. Hence, the purpose of this study is to develop CHF correlations applicable to various pressurized water reactor plants in a wide range of thermal outputs based on newly obtained CHF data. A rectangular test section with a cross-section of 150 mm × 150 mm and length of 600 mm was used for simulating a cooling channel. The thermal-hydraulic conditions expected in actual plants were studied, and the results were used in the experiment. The effects of parameters such as pressure, mass flux, thermodynamic quality, and angle on CHF were investigated . Based on these results, we developed a CHF correlation formula that can be applied to a wider range than previously, up to a maximum heat flux of 3000 kW/m2, and that predicts CHF with an error of ± 10%.
1. Introduction
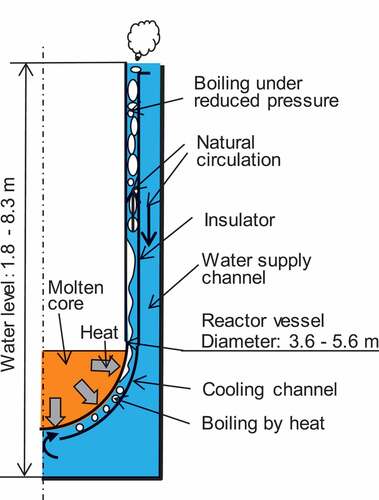
In-vessel retention (IVR) is a strategy for severe accident management in which the lower head of the reactor vessel is submerged in a water-flooded reactor cavity. Molten debris can be contained in the reactor vessel by cooling its external surface through natural circulation due to boiling. The IVR concept was firstly introduced in the Lovissa reactors in Finland and was certified by the US Nuclear Regulatory Commission for the Westinghouse AP600. One important element of IVR technology is the limit on coolability as expressed by critical heat flux (CHF) at the external surface of the reactor vessel. Several studies have obtained CHF by using a test section that simulates a cooling channel outside the reactor vessel.
The ULPU test facility is an important one for examining CHF at the outer surface of a reactor vessel for IVR. It simulates the thermal-hydraulic phenomena that occur during a severe accident due to buoyancy-driven natural circulation by using a full-scale slice model of a cooling channel outside of a reactor vessel. The CHF was determined experimentally by using ULPU to assess the IVR for the AP600 design [Citation1–Citation5]. In this series of experiments, the cooling channel configuration, that is, the widths of the sidewall and bottom head, were varied in order to investigate the effects of geometry on coolability. This experiment was also conducted to optimize the geometry of the AP1000 cooling channel by simulating its configuration. In the study, Dinh et al. pointed out that it is important to increase the size from the bottom to the top of the bottom head because the channel angle is not important for the cooling performance of IVR at angles of 0° to 60° with respect to vertical [Citation6].
Because this approach uses a test section with a specific shape of an actual plant, it is effective for obtaining data equivalent to an actual plant. However, the obtained CHF data is only directly applicable to that particular reactor vessel geometry . In contrast, SULTAN [Citation7,Citation8] is another important test facility for measuring the CHF of IVR by a different approach. The configuration of the test section that simulates the cooling channel was a rectangular channel, not an actual reactor vessel geometry. A flat rectangular stainless steel plate of 4 m length × 0.15 m width was directly heated electrically and the gap (depth from the heated surface to the adiabatic facing surface) was varied from 0.03 m to 0.15 m. The effects of pressure, mass flow rate, inlet subcooling, channel width, and inclination on CHF were characterized from the experimental data, and this was used to develop a CHF correlation formula. The experiment was conducted under heat fluxes of generally up to 1000 kW/m2. It was found that the gap seemed to have no effect in that range when CHF is reached under saturated conditions and a limited positive effect in subcooled conditions [Citation8].
At MIT, a basic experiment was conducted to enhance CHF of IVR by nanofluids with a two phase flow loop [Citation9]. The test section was a rectangular channel with dimensions of 0.32 m length × 0.014 m width × 0.02 m depth. CHF in de-ionized water under forced convection was obtained by varying the pressure, mass flux, and angle, and this was compared with the CHF in nanofluids. The experiment was conducted under condition of pressure up to about 0.5 MPa and mass flux up to 1500 kg/m2s. Despite the small size of the test section, the CHF data were in good agreement with ULPU and SULTAN under some conditions.
Experimental studies that use a test section with a full-scale slice model are effective in terms of direct evaluation of actual plants. However, when evaluating cooling performance for different pressure vessel geometries or different thermal-hydraulic conditions, CHF data must be acquired by conducting new experiments with a full-scale test section. In contrast, the existing CHF data obtained using a small rectangular test section does not depend on the reactor vessel geometry, but prediction accuracy becomes a problem when extrapolating beyond the applicable range in actual plant conditions. Thus, the purpose of the present research is to acquire CHF data under a wider range of conditions than before and to develop a new correlation equation based on the results in order to make it possible to evaluate the effectiveness of IVR for various types of pressurized water reactor (PWR) plants including large-scale and high-power plants. Firstly, the heat flux at the outer surface of the pressure vessel was evaluated to determine the experimental conditions covering the heat flux of actual plants. Also, the mass flux and quality of actual plants were evaluated by thermodynamic calculations in the cooling flow path. Next, to simulate the occurrence of CHF in the flow path of actual plants with a rectangular test section, the geometry was studied and a test facility was constructed. Finally, CHF data covering the conditions of actual plants were acquired using this test facility, and a CHF correlation formula, which can be applied to a wider range than previously, up to a maximum heat flux of 3000 kW/m2, was developed based on the experimental data.
2. Examination of experimental conditions
2.1. Plant parameters
In order to develop CHF correlations that are applicable to a wide range of PWR power plants, it is necessary to set the range of experimental conditions appropriately. We thus considered various existing plants, and adopted a PWR with 2 loops, a PWR with 3 loops, and a high-power PWR with 4 loops as the targets. The experimental parameters are pressure, mass flux of water, and thermodynamic quality. These parameters are determined by plant conditions, namely, the containment pressure, water level of reactor cavity, thermal conditions, and reactor vessel dimensions.
The range of pressure was determined by considering the containment design pressure and severe accident conditions. The water level of the reactor cavity has a great effect on natural circulation flow rate. In a study on the experimental conditions, the maximum water level was set to the same elevation as the primary loop piping and the minimum was set to the same elevation as the welding line of the lower head of the reactor vessel.
Thermal conditions are determined by decay heat and thermal output of plants. The range of decay heat was determined by taking probability distribution into consideration. The probability distribution was estimated based on severe accident simulations for many accident sequences of the AP1000 [Citation10]. According to the probability distribution, the maximum decay heat is 1.2% of the thermal output and the minimum is 0.6%. These ranges of plant parameters are summarized in .
Table 1. Range of plant conditions.
The CHF experiment by the ULPU facility, which simulated actual plants, was conducted using cooling channel depths of 75 mm and 150 mm. The experimental data showed that the effect of the depth of the cooling channel on CHF is not significant [Citation6]. Thus, the depth of the cooling channel was set to 150 mm, the same as that of ULPU.
2.2. Estimation of flow conditions
The mechanisms of CHF on convection boiling can be roughly categorized into dry-out under high-quality conditions and departure from nucleate boiling (DNB) under low-quality conditions. Since the thermal hydraulic conditions in the cooling channel for IVR are low-quality conditions or subcooled conditions, it is estimated that the mechanism of CHF occurrence is DNB rather than dry-out. The CHF for DNB is determined by local conditions: mass flux, pressure, thermodynamic quality, and gravity. In this experiment with rectangular test section, the effect of gravity can be replaced by the inclination angle. Therefore, CHF data are needed in terms of pressure, mass flux, thermodynamic quality, and inclination angle as parameters for developing the CHF correlation for IVR.
Mass flux and thermodynamic quality in the cooling channel are determined by the natural circulation in the cooling water flow path. Therefore, the calculation model was constructed to estimate the experimental range of mass flux and a thermodynamic quality that simulated the accident conditions in actual plants. A schematic drawing of the natural circulation during an accident is shown in . The natural circulation flow rate in the cooling channel under accident conditions is determined by the balance between driving force and pressure losses. The driving force is the difference in hydraulic head pressure between the cooling channel and water supply channel. Hence, the pressure balance in the circulation flow path can be expressed as
Figure 1. Schematic drawing of natural circulation under IVR conditions.
whereΔPgrav is the pressure difference due to average density difference between cooling channel and water supply channel, ΔPfric is friction pressure loss, ΔPlocal is local pressure loss, and ΔPaccel is acceleration pressure loss in the circulation flow path. The local pressure loss was treated as the pressure loss at the inlet of the cooling channel since this was the dominant term because of the high velocity. The pressure loss at the inlet was estimated by referring to the geometric shape for the AP1000 [Citation11]. The pressure loss in the two phase flow area was evaluated by using the two-phase multiplier parameter by Lockhart-Martinelli [Citation12] and Chisholm’s parameter [Citation13]. The thermodynamic quality was estimated by calculating the change in thermal hydraulic conditions in the cooling channel caused by heat flux from the reactor vessel outer wall. The flow area of the cooling channel was divided every 1° and the energy balance equation was applied to each adjacent cell as follows:
Here Wv is the steam generation rate, hfg is the latent heat, Q is the input power to water, W is the total mass flow rate, hli is water enthalpy at cell i, and hls(i+1) is saturated water enthalpy considering head pressure at cell i+1. Boiling by decompression was considered in the rising flow path where the heat flux from the molten core is zero.
Calculation results for the thermal hydraulic conditions corresponding to each position in the reactor vessel are shown in . The inclination angle indicates the orientation of the cooling channel with respect to vertical in the lower vessel, with an inclination angle of 90°corresponding to the welding line of the reactor vessel. The flow area increases with increasing inclination angle increases because of hemispherical shape of the reactor vessel lower head, so the mass flux decreases as inclination angle increases. Consequently, velocity through the cooling channel varies from 0.6 m/s to 5.8 m/s in this estimation. The thermodynamic quality increases the higher the position due to heat flux from the molten core to the outer surface of the reactor vessel. According to experimental results obtained in ULPU [Citation6], although flashing occurred at a higher elevation than the top of the test section, fluctuations in the natural circulation were small. Thus, the effect of flashing was ignored in the present test planning.
Table 2. Estimation results of thermal hydraulic parameters corresponding to position in the reactor vessel.
As shown in , the range of mass flux and thermodynamic quality are defined in terms of inclination angle. We therefore studied the range of inclination angles for obtaining the CHF data necessary for evaluating IVR feasibility, which is the purpose of this study. According to Esmaili et al. [Citation10], it is possible that the heat flux from the molten core could exceed CHF purely from the focusing effect. The focusing effect is a phenomenon which causes locally high heat flux at a metal layer in the molten core. The molten core is divided into metal layers and an oxide layer in the reactor vessel. Two-layer and three-layer compositions were considered as cases that could occur in actual plants for evaluating the IVR of the AP1000. To evaluate molten core stratification in a large-scale and high-power PWR, for which thermal power is 4510 MW, the chemical reaction was calculated based on the variational free energy and the heat flux was calculated by using the energy conservation equations for each layer and heat transfer between each layer. The calculated heat flux distributions in the two-layer and three-layer cases are shown in and respectively. Natural convection in both layers increases the heat flux on the light metal layer above the oxide layer. However, in the three-layer composition, the heat flux at the heavy metal layer is lower than the oxide layer due to weak natural convection in the heavy metal layer. Therefore, it is thought that this is sufficient for evaluating the CHF in the metal layer in order to assess the feasibility of IVR, and the range of the inclination angle targeted in this test corresponds to the position of light metal layer formation in the two-layer case. The light metal layer position depends not only on the diameter of the reactor vessel, but also on the decay heat, UO2 mass in molten debris, and Zr oxidation ratio. Given that these parameters have uncertainty, Esmaili et al. [Citation10] used probability density functions based on severe accident simulations. In the present study, the same probability density functions were used for estimation of molten core stratification. To obtain the lowest position of the light metal layer, the conditions for forming the thinnest oxide layer were considered, and in order to obtain the highest position of the light metal layer, the conditions for forming the thickest oxide layer were considered. The stratified composition in the molten core was evaluated by the model [Citation14] described above and resulted in a range of light metal layer positions from 56° to 90° [Citation15]. Therefore, the inclination angle in this test was set to the range of 56° to 90° as a thermally severe region.
Figure 2. Angular variation of heat flux for a two-layer composition (typical case in a large-scale PWR).
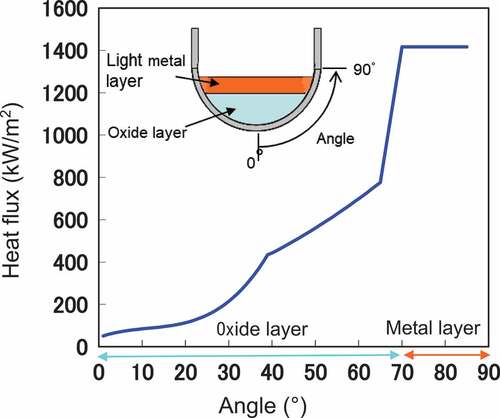
Figure 3. Angular variation of heat flux for a three-layer composition (typical case in a large-scale PWR).

2.3. Test matrix
From the above examination results, the test matrix was examined in the range excluding the 15° angle condition from the full parameter range shown in . Firstly, the test cases were extracted by the Box-Behnken method with 4 parameters and 3 levels for IVR conditions and were reasonably reduced in order to build the correlation for optimized output. Secondly, parameters of each case were investigated from an engineering point of view, and the ranges of mass flux and thermodynamic quality were changed for each of the inclination angles. Furthermore, additional cases were examined that were important for evaluating the IVR strategy for actual plants. As a result, we obtained 36 test cases for CHF correlation equation development.
3. Experimental apparatus and procedure
3.1. Outline of experimental apparatus
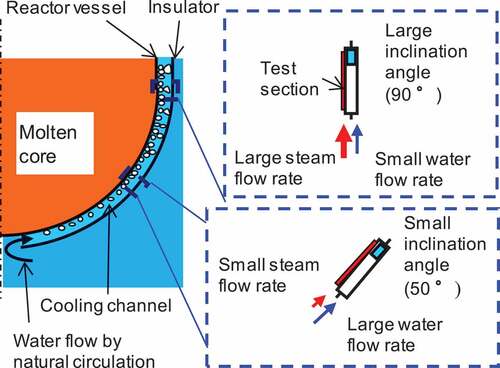
According to estimation results, the thermodynamic quality in the cooling channel during an accident are low-quality conditions or subcooled conditions (). Therefore, it is estimated that CHF occurrence mechanism is DNB rather than dry-out as mentioned above. CHF by DNB is determined by the local conditions. Therefore, to obtain CHF at each position, we decided to use a short test section and simulate the local conditions of the cooling channel. shows the concept of the test section. In this study, the flow conditions in the cooling channel were simulated by forced convection. The position of the cooling channel was simulated by the inclination angle of the test section and by adjusting the mass flux and thermodynamic quality.
Figure 4. Concept of the test section.
3.2. Test section
A schematic drawing of a section is shown in . The cross section of the flow channel section is a rectangle of 150 mm width × 150 mm depth × 600 mm length. It is well known that the heated length affects CHF. To simulate the cooling channel at the outer surface of the reactor vessel, it is necessary to determine the heating length of the test section so that the results are not affected by the heating length [Citation16]. Therefore, the effect of heating length on CHF under experimental conditions was investigated from the viewpoint of the length of the vapor blanket. Celata et al. reported a mechanistic model of subcooled flow boiling CHF [Citation17]. They showed that the vapor blanket generated in the superheated layer near the wall is one of the key parameters for determining the CHF of subcooled flow boiling. The vapor blanket length was therefore calculated under the conditions shown in . The maximum length was estimated to be about 170 mm under atmospheric pressure and minimum water mass flux conditions. Since the heated length of 600 mm is more than triple the estimated maximum vapor blanket, we concluded that the test section is long enough not to change the mechanism of CHF occurrence. The depth of the flow channel of 150 mm is the same as the test section in the ULPU facility, which simulated an actual plant.
Figure 5. Schematic drawing of the test section.
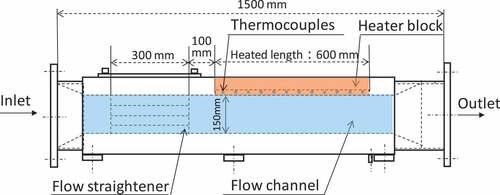
A heater block with dimensions of 600 × 100 mm was installed on the upper surface of the rectangular flow channel. The heater block was made of copper due to its good thermal conductivity, and high-power sheath heaters made of SUS316 were embedded in the heater block. The heater block was in direct contact with the liquid and transfers heat to the liquid. A material different from copper is used in actual plants. In terms of the effect of the material on CHF, the experimental results obtained at MIT with the materials actually used, namely,SUS316 L and SA508 as the AP1000, show good agreement with the test results obtained in ULPU and SULTAN using copper [Citation9]. Therefore the effect of the difference in material on CHF is small, at least for copper and steel in the de-ionized water under similar thermal-hydraulic conditions.
The power supply to the heaters was controlled to produce the target heat flux. The maximum heat flux was 3.5 MW/m2 due to the thermal limitations of the sheath heaters. Eleven K-type thermocouples were installed in the heater block at a depth of 1 mm from the surface at 5 mm intervals in order to detect temperature excursion by CHF occurrence. A pressure measuring tap was installed upstream of the heater block and a pressure transmitter was installed. At the upper end of the heating components, an observation window for checking the flow state inside was installed.
Structures for converting between the rectangular cross-section and the circular pipes were installed upstream and downstream of the test section. A flow straightener was installed up stream of the test section to reduce secondary flow. In this study, we used a tubular flow straightener that is effective in suppressing swirling flow. The length of the flow straightener was 300 mm and the length from the end of the flow straightener to the inlet of the heating section was 100 mm. The effect of the flow straightener was investigated by flow analysis using commercial computational fluid dynamics analysis code. From results of analysis in which a swirl component due to the piping configuration on the upstream side of the test section was applied to the inlet of the test section, it was confirmed that the flow velocity was uniform at the heating unit inlet.
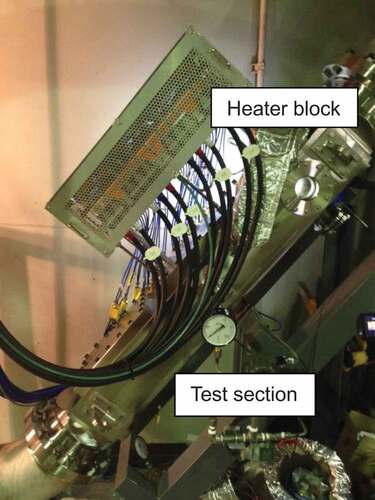
A photo of the test section is shown . During the experiment, the test section was entirely covered with an adiabatic material to prevent heat radiation.
Figure 6. Photo of the test section.
3.3. Test loop
A loop diagram of the test equipment is shown in . The design pressure of the test loop is 1.0 MPa and the design temperature is 180°C. The rated flow rate of the pump is 3 m3/min and the maximum mass flux at the test section is 2200 kg/m2 s. The flow rate is measured by vortex flow meter with an uncertainty of ±0.25%. K-type thermocouples are installed at the inlet and outlet of the test section. The thermodynamic quality is controlled by the inlet temperature or adjusting the mixture ratio of water flow rate from the water storage tank and the steam flow rate from the boiler. The steam and water from the test section are discharged into a discharge tank and cooled by spraying. The water is returned to the water storage tank through pipes connecting the two tanks. The angle of the test section is changeable between 50°, 70°, and 90° from vertical.
Figure 7. Loop diagram of the test equipment.
3.4. Experimental procedure
Firstly, de-ionized water is supplied to the water storage tank and the discharge tank until the water level reaches the set value. Next, pressurization and heating of the tanks is started, with the pressure and temperature set to the target values to within ±0.05 MPa and ±0.5°C, respectively. The pump is then started and de-ionized water is supplied to the test section. The flow rate is set to within ±5% of the target values by adjusting the pump bypass valve and water supply control valve. For experiments with thermodynamic quality over 0, the steam is supplied to the mixing section, and the thermodynamic quality is set to within ±0.04% of the target values by adjusting the steam flow control valve. If the air becomes mixed into the steam during the thermodynamic quality adjustment, the air is exhausted by the air trap upstream of the test section. After all of the experimental conditions have been set to within the allowance ranges and conditions are confirmed stable, the power supply to the heater block is turned on to heat the test section. The heat flux is increased in steps of 100 kW/m2. The heat flux is calculated from the supply power to the heaters in the heater block and the surface area of the heater block. The actual heat flux from the heater to the fluid is corrected using a coefficient that takes into account the amount of heat loss, which was obtained through a preliminary experiment. The temperature data are acquired while monitoring at a constant heat flux for at least 5 minutes to obtain stable conditions. If a rapid temperature increase of over 10°C/sec or the thermocouples which are located 1 mm from heated surface reach a temperature of 100°C, the heat flux at the time is defined as CHF and the power supply to the heater is turned off. After confirming that the temperature of the heater block has dropped, the heat flux is set to 100 kW/m2 lower than the initially detected CHF. After that, the heat flux is increased in steps of 10 kW/m2 until CHF is detected again. By increasing the heat flux in smaller increments in the second test than first test, the accuracy of the heat flux measurement can be improved. Therefore, the data from the second detection are used as the CHF data.
4. Experimental results
4.1. Temperature increase and CHF detection
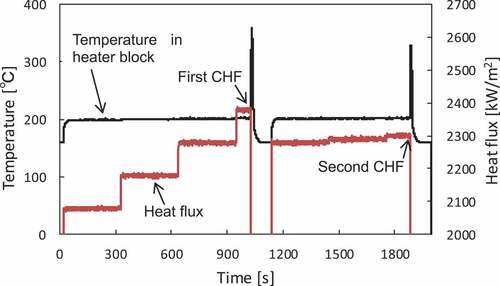
Typical heat flux data and the representative temperature of the heater block are shown in . This temperature data was measured at 1 mm from the surface and 500 mm from the inlet of the heating section. Experimental conditions were an inclination angle of 70°, pressure of 0.60 MPa, mass flux of 1108 kg/m2 s and thermodynamic quality of 2.65 × 10⁻³. In this case, the first rapid temperature increase occurred when the heat flux reached about 2370 kW/m2. The boiling transition normally observed in the case of dry-out and characterized by very small temperature fluctuations was not observed. Next, the heat flux was set to 2270 kW/m2 and the heat flux was increased in steps of 10 kW/m2. When the heat flux was about 2290 kW/m2, the temperature increase occurred again. The CHF was then defined as the heat flux at which the second temperature rise was observed. The CHF value of this case was calculated precisely to be 2297 kW/m2 by measuring the supply power data. In this test case, the rapid increase in temperature occurred simultaneously in the area 350 mm to 500 mm from the inlet of the heating section at the same heat flux.
Figure 8. Time variation of heat flux and temperature in heater block.
4.2. Study of data reliability
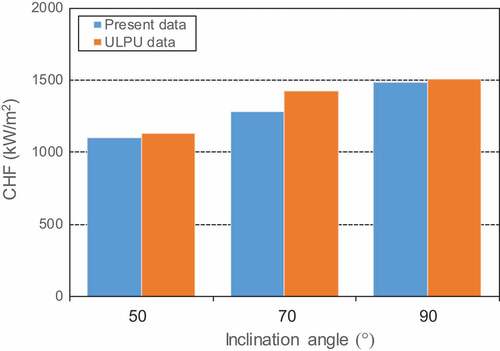
Verification was performed by comparing the CHF data obtained in the experiment with the CHF data obtained in ULPU [Citation6]. The experiment in ULPU was conducted to obtain CHF data under atmospheric pressure and natural circulation conditions for the AP1000 IVR strategy. The flow channel used in ULPU simulates a cooling channel outside of the reactor vessel of the AP1000 at full-scale using two-dimensional slice geometry. For comparison with ULPU, test cases at the same inclination angles of 50°, 70°, and 90° were selected. The pressure was calculated by taking into account the hydraulic head pressure of the ULPU facility configuration. The thermodynamic quality was evaluated based on the published heating value and the measured natural circulation flow rate.
shows the results of CHF comparison between the experimental data and ULPU data. Whereas the cooling water was supplied by natural circulation in ULPU, it was forcibly supplied by a pump in the present experiment. However, although the difference in the CHF value is dependent on the angle, the present experimental results agree well with the ULPU results because the largest difference is 10.0% at an angle of 70°. For the ULPU experiments, it was reported that fluctuations in the natural circulation flow rate were observed due to decompression boiling in the riser section in ULPU [Citation6]. Such phenomena or other unexpected phenomena might cause the difference in angle dependence of CHF. However, the influence of the cooling water supply method on CHF is considered to be comparatively small under the IVR conditions of this comparison. This indicates that the CHF correlation obtained from the data in the present study could be applied to actual plants.
Figure 9. Comparison between measured CHF data and ULPU data.
To evaluate repeatability, the experiments were conducted three times under the same conditions. The experimental conditions were an inclination angle of 70°, pressure of 0.35 MPa, mass flux of 1100 kg/m2s, and thermodynamic quality of 0. As shown in , the standard deviation is 19.5 kW/m2, which is smaller than twice the input heat flux step increase of 10 kW/m2. As a result, this shows that the CHF data obtained at this test facility and test procedure has good repeatability.
Table 3. Results of repeatability tests.
4.3. Effect of parameters on CHF
Since the test matrix was established to develop a CHF correlation for IVR, experiments were not conducted to evaluate the effect of one parameter under conditions where the other parameters were kept constant. However, there were some test cases where the parameters were within a certain range. Using these experimental results, the relationship between CHF and each parameter was investigated. The relationships between CHF and inclination angle under each pressure condition are shown in . Although CHF generally increases with increasing inclination angle, the variation in CHF with respect to angle differs slightly between atmospheric and high-pressure conditions. This is attributed to the pressure conditions being 0.14 MPa for the 70° data but 0.12 MPa for the 90° data, which is slightly different. The relationships between CHF and pressure at each inclination angle are shown in . At all inclination angles, CHF increases with increasing pressure, but the rate of increase decreases with increasing pressure. The relationships between CHF and mass flux of coolant water at each inclination angle are shown in . CHF increases depending on mass flux at all inclination angles. The relationships between CHF and thermodynamic quality at each inclination angle and pressure condition are shown in . Although CHF shows a slight decrease with increasing thermodynamic quality, the effect is small in this quality range. The effects of each parameter on CHF as described above are consistent with previous studies.
Figure 10. Relationships between CHF and inclination angle.
Figure 11. Relationships between CHF and pressure.
Figure 12. Relationships between CHF and mass flux.
Figure 13. Relationships between CHF and thermodynamic quality.
4.4. CHF correlation
The SULTAN correlation formula is a practical one based on experimental data obtained under the conditions assuming IVR by using test sections of almost the same size as those in the actual plants. Therefore, the present experimental data were compared with the SULTAN correlation. As shown in , the correlation equation predicts the present experimental data to almost within ±20% error. However, the SULTAN correlation tends to overestimate experimental data in atmospheric conditions and underestimate in high-pressure conditions. In addition, the correlation considerably underestimates the data at heat fluxes of over 2500 kW/m2. The reason for this tendency can be summarized based on the following data. The SULTAN correlation equation was developed based on CHF data with pressures of between 0.1 and 0.5 MPa, heat flux mainly less than 1000 kW/m2, and CHF data for up to 2000 kW/m2 only at 90° in a 2-m-long test section. Therefore, when this correlation is used for evaluating the present data, it is used by extrapolation, and it cannot be considered appropriate for conditions with high heat flux and high pressure. In addition, in the SULTAN experiments, Rouge et al. pointed out that a reverse flow phenomenon at the end of the test section was observed at low heat flux, indicating the possibility of improving CHF [Citation8].
Figure 14. Comparison of CHF between experiment and SULTAN correlation.
Thus, a CHF correlation equation was mathematically derived by the least-squares fitting of four variables based on the response surface method using 34 experimental data, excluding the two data that did not reach CHF. The correlation equation for CHF in kW/m2 is expressed as a function of pressure (P) in MPa, mass flux (m) in kg/m2 s, thermodynamic quality (x), and inclination angle (θ). The CHF correlation equation is the following:
P: 0.1–0.6 (MPa); m: 430–1900 (kg/m2s); x: −2.6 × 10⁻² to 3.1 × 10⁻³; θ: 50–90 (°)
Comparisons between the correlation equation and the experimental results are shown in . Differences in CHF between the correlation and the experimental results are less than 10%, and the R squared value is 0.978. Thus, the correlation accurate enough to use for evaluating IVR strategy.
Figure 15. Comparison of CHF between experiment and developed correlation.
5. Conclusions
A CHF experiment was conducted to develop a CHF correlation applicable to various PWR plants including large-scale and high-power plants with a wide range of thermal outputs. A test section of 150 mm width × 150 mm height × 600 mm length was used to simulate part of a cooling channel. The experiment was conducted under thermal hydraulic conditions that are expected in various plants. The effects of parameters such as pressure, mass flux, thermodynamic quality, and angle on the obtained CHF was reasonable when compared to previous studies. The CHF data showed good agreement with the ULPU data under the same conditions, confirming the reliability of the experimental data. These results suggest that the experimental data can be applied to IVR natural circulation conditions in actual plants. Thus, a CHF correlation was newly developed using the obtained CHF data. It was confirmed that the CHF correlation equation predicts CHF with an error of ±10%, meaning that a CHF correlation equation was developed that can evaluate IVR under a wider range of conditions, up to a maximum heat flux of 3000 kW/m2.
Nomenclature
| hfg | = | Latent heat (J/kg) |
| hl | = | Water enthalpy (J/kg) |
| hls | = | Saturated water enthalpy (J/kg) |
| m | = | Mass flux (kg/m2s) |
| P | = | Pressure (Pa) |
| ΔPfric | = | Friction pressure loss (Pa) |
| ΔPgrav | = | Gravitation pressure loss (Pa) |
| ΔPaccel | = | Acceleration pressure loss (Pa) |
| ΔPlocal | = | Local pressure loss (Pa) |
| qCHF | = | Critical heat flux (W/m2) |
| W | = | Total mass flow rate (kg/s) |
| Wv | = | Steam mass flow rate (kg/s) |
| x | = | Thermodynamic quality (-) |
| θ | = | Inclination angle (°) |
Acknowledgments
This study was conducted with the cooperation of Hokkaido Electric Power Co., Inc., Shikoku Electric Power Co, Inc., Kyushu Electric Power Co., Inc., The Japan Atomic Power Company, and The Institute of Applied Energy.
Disclosure statement
No potential conflict of interest was reported by the author(s).
References
- Theofanous TG, Liu C, Additon S, et al. In-Vessel coolability and retention of a core melt. Nucl Eng Des. 1997 June;169(1–3):1–48.
- Theofanous TG, Syri S. The Coolability limits of a reactor pressure vessel lower head. Nucl Eng Des. 1997 June;169(1–3):59–76.
- Theofanous TG, Liu C, Additon S, et al. In-Vessel Coolability and Retention of a Core Melt, Department of Energy (USA); 1996 Oct. DOE/ID-10460.
- Theofanous TG, Tu JP, Salmassi T, et al. Quantification of Limit to Coolability in ULPU-2000 Configuration IV. Center for Risk Studies and Safety. 2002 May, CRSS Technical Report 02.05.
- Rempe JL, Suh KY, Cheung FB, et al. In-Vessel Retention strategy for high power reactors final report. Idaho National Laboratory, Idaho National Engineering and Environmental Laboratory; 2003. INEEL/EXT-04-02561.
- Dinh TN, Tu JP, Salmassi T, et al. Limit of Coolability in the AP1000-Related ULPU-2400 Configuration V Facility. Proceedings of NURETH-10; 2003 Oct 5–9; Seoul (Korea)
- Rouge S. SULTAN test facility for large-scale vessel coolability in natural convection at low pressure. Nucl Eng Des. 1997 Jun;169(1–3):185–195.
- Rouge S, Dor I, Geffraye G Reactor Vessel External Cooling for Corium Retention SULTAN Experimental Program and Modeling with CATHARE Code. Workshop on in vessel core debris retention and coolability; 1998 Mar 3–6; Garching (Germany). p. 351–363.
- DeWitt G, McKrell T, Buongiorno J, et al. Experimental study of critical heat flux with alumina-water nanofluids in downward-facing channels for In-Vessel Retention applications. Nucl Eng Tech. 2013 June;45(3):335–346.
- Esmaili H, Khatib-Rahbar M Analysis of In-Vessel Retention and Ex-Vessel Fuel Coolant Interaction for AP1000. U.S.NRC: 2004, NUREG/CR-6849.
- Keegan CP, Wright R AP-1000 passive In-Vessel Retention design for a severe accident. Proceedings of ICAPP; 2007 May 13–18; Nice (France). Paper 7489.
- Lockhart RW, Martinelli RC. Proposed correlation of data for isothermal two-phase, two component flow in pipes. Chem Eng Prog. 1949;45(1):39–48.
- Chisholm D. A Theoretical basis for the Lockhart-Martinelli correlation for two-phase flow. Int J Heat Mass Trans. 1967 Dec;10(12):1767–1778.
- Aoki K, Sato H, Mizuguchi K, et al. Development of calculation method for heat flux from molten debris during In-Vessel Retention. Proceedings of ICAPP; 2014 April 6–9; Charlotte (USA). Paper 14078.
- Aoki K, Iwaki C, Sato H, et al. Testing plan for critical heat flux measurement during In-Vessel Retention. Proceedings of ICONE23; 2015 May 17–21; Chiba (Japan). Paper1088.
- Aoki K, Iwaki C, Sato H, et al. Critical heat flux measurement during In-Vessel Retention. Japan-U.S. seminar on two-phase flow dynamics; 2015 May 10–16; West Lafayette (USA).
- Celata GP, Cumo M, Mariani A. Simoncini M and Zummo G. Rationalization of existing mechanistic models for the prediction of water subcooled flow boiling critical heat flux. Int J Heat Mass Transfer. 1994 march;37(Suppl.1):347–360.