
 ?Mathematical formulae have been encoded as MathML and are displayed in this HTML version using MathJax in order to improve their display. Uncheck the box to turn MathJax off. This feature requires Javascript. Click on a formula to zoom.
ABSTRACT
Present safeguards verification methods for small samples of high-radioactivity nuclear material (e.g. spent nuclear fuel solution) in reprocessing facilities use destructive analysis techniques since passive non-destructive techniques are incapable of directly determining the nuclear material content. To supplement these methods, the Japan Atomic Energy Agency and European Commission Joint Research Centre (JRC) are collaborating to develop delayed gamma-ray spectroscopy non-destructive assay technology for composition analysis of the fission nuclides. Multiple experiments were performed in the JRC-Ispra site using the Pulsed Neutron Interrogation Test Assembly (PUNITA) to study the signature from short-lived fission products from low-radioactivity U and Pu standard samples. From these spectra, we identify many gamma rays useful to determine the composition of a mixed nuclear material sample. Here we present the results of these experiments along with correlations to the interrogation, mass, volume, and sample homogeneity.
1. Introduction
Nuclear safeguards for bulk-handling facilities require all U and Pu to be quantified in order to verify nuclear material has not been diverted toward the production of nuclear weapons. In PUREX reprocessing plants, this is primarily performed by taking samples of the nuclear material solution from the various tanks. The most challenging solution is dissolved spent nuclear fuel since it produces high-intensity passive neutron and gamma-ray emissions. The emissions from this high-radioactivity nuclear material are not only unsafe but they also mask the direct U and Pu signatures measured by current passive non-destructive assay (NDA) techniques applied to low-radioactivity nuclear material (e.g. Pu-nitrate and mixed oxide powder). Effectively, the neutrons from Cm complicate the effective Pu mass measurement provided by neutron coincidence counting [Citation1,Citation2] while the gamma rays used to determine the composition are overwhelmed mostly by
Cs [Citation1].
Inspectors instead turn to destructive analysis methods to verify high-radioactivity nuclear material. Hybrid K-Edge Densitometry (HKED) [Citation3,Citation4] is used to evaluate the U and Pu elemental mass for partial-defect verification with the composition and bias-defect verification determined by Isotope Dilution Mass Spectrometry (IDMS) [Citation4]. Both of these provide ≲ 1% uncertainty to their respective values [Citation5]; however, the IDMS sample preparation process requires many days within a hot cell. This limits the number of samples to only 20% of those evaluated by HKED and extends the reporting time to 10 days [Citation6]. Further, the IDMS method uses many large dry spikes for calibration and produces waste in the laboratory. Consequently, methods capable of reducing the time for reporting on partial defect sample verification, reducing waste, and consuming fewer additional resources should be found to supplement IDMS.
Toward this goal, the Japan Atomic Energy Agency (JAEA) is collaborating with the European Commission Joint Research Centre (JRC) to develop multiple active-interrogation NDA techniques [Citation7]. Of these, delayed gamma-ray spectroscopy (DGS) has the potential to quickly and efficiently evaluate the fissile nuclide composition (i.e. U,
Pu, and
Pu) within mixed nuclear material. The composition is evaluated by determining their fractional contribution to the gamma-ray spectrum, which is proportional to the unique fission-product yield and content within the sample.
The focus of this work is to describe the delayed gamma-ray spectral differences from multiple measurements performed by this JAEA-JRC collaboration using the Pulsed Neutron Interrogation Test Assembly (PUNITA) [Citation8] located in JRC-Ispra (Italy) in the scope of safeguards applications. Standard U and Pu samples were used for safety and to evaluate individual spectra that would combine in relative proportions based on the composition of the spent fuel solution samples in a reprocessing plant. Specifically, this work provides foundational information related to developing component, instrumentation, and procedure requirements for developing practical DGS NDA that can be used for efficient and timely verification. First will be a brief description of the DGS technique followed by a description of PUNITA, the samples, and the measurements performed. Next is a description of the analyzed data as applicable toward NDA verification and a discussion on the lessons learned for effective DGS interrogations. Finally, a discussion on how this information will be used by this JAEA-JRC collaboration toward future development will be presented.
2. Delayed gamma-ray spectroscopy technique
Similar to passive high-rate gamma-ray spectroscopy [Citation4], DGS is used to evaluate the composition of a nuclear material sample with a primary nuclide () atomic density of
where is the density of the sample,
is Avogadro’s constant, and
and
are the weight fraction and atomic mass of
in the sample. Specifically, the composition is the relative
in the sample. However, compared to passive gamma-ray spectroscopy that directly evaluates
from the
1-MeV gamma rays emitted by the nuclear material of interest, high-radioactivity nuclear material must be evaluated from active interrogation of the sample. Specifically, a DGS interrogation requires an Irradiation period (
) and a Measurement period (
) with possible Delay and Reset periods (
and
) in between. This pattern is performed for one or more Cycles (
) to reach statistically significant gamma-ray peak counts.
During the Irradiation period, neutrons interact with the sample described through an energy-dependent () total (
) reaction rate defined as
where is the external source neutron flux entering the sample volume
after being filtered (
) by the sample container before interacting with the sample primary nuclei,
from EquationEquation (1)
(1)
(1) , that have individual total cross-sections,
. The
term within
scales
to a fractional contribution of the reactions. Though the absolute
scales linearly with
and
, 1-mL quantities of spent fuel solution are used for HKED [Citation5] for operator and inspector safety, thus minimum requirements must also be considered for DGS. While low-radioactivity nuclear material is similarly restricted to safe quantities, these can be significantly larger for a greater
and easier interrogations. However, measurements are still limited by physics and the ability for the neutrons to penetrate the sample and gamma rays to escape must be optimized.
While is a general term, the prompt signature emitted during the Irradiation period is largely overwhelmed by the background from activation of the matrix material and environment. Consequently, the gamma-ray signature required to evaluate
must be observed during the delayed period (≳
s), dominated by the fission products produced by the fission (
) reaction mode,
. Hence, the total number of fission products,
, generated in a nuclear material sample is described by
where is the individual fission product generated with energy-dependent (
) fission yield probability
by sample primary fissionable nuclide
at total reaction rate
of EquationEquation (2)
(2)
(2) and energy-dependent fission-reaction fraction
. The fission products are integrated over all
for a single
before being summed over all nuclides within a mixed nuclear material sample. For the DGS evaluation, the fission product contribution from
is determined by the composition
in
and modulated by
(see ).
Figure 1. The mean fractional fission product yield mass distribution of U,
Pu, and
Pu for the declared thermal-neutron energy from the ENDF/B-VII.1 database [Citation15]. See online version for color.
![Figure 1. The mean fractional fission product yield mass distribution of 235U, 239Pu, and 241Pu for the declared thermal-neutron energy from the ENDF/B-VII.1 database [Citation15]. See online version for color.](/cms/asset/2b486a89-1c6c-46ec-af3a-b055b1677069/tnst_a_1742812_f0001_oc.jpg)
As soon as they are produced, the fission products subsequently decay according to the decay probability equation that integrates to
to indicate the number of atoms at the end of the particular time period, , proportional to decay constant
while concurrently being produced by the decaying
parent nuclide with branching ratio
. During the irradiation period (
), the nuclide is also produced by the fission process,
through
from EquationEquation (3)
(3)
(3) . It must be noted, though, that the decay of these fission products increases the
daughter also produced during the Irradiation period.
During their decay, the fission products emit gamma rays at unique energies () observed as the spectrum
where ,
,
, and
are the detector efficiency, detector resolution broadening, shield attenuation, and measurement effects at the
gamma-ray energies produced with intensity
for the
number of decays of nuclide
derived from EquationEquation (4)
(4)
(4) . Again, for a DGS interrogation, only the Measurement period (
) is of concern in order to escape the prompt gamma-ray background. Variables contributing to the measurement effects (
) term include Compton scatter in the environment and detector shielding, the sample-to-detector distance, x-ray production from shielding materials, etc.
Compared to that for low-radioactivity nuclear material, thick gamma-ray filtering () must be applied to suppress the low-energy passive gamma rays (and fast neutrons) of high-radioactivity nuclear material, restricting the observable gamma rays to those with energy greater than
3 MeV. Fortunately, many of the short-lived fission products with
minutes produce gamma rays with
MeV, which also enables quicker evaluation of the samples for safeguards verification. However, the peaks must still be sufficiently resolvable in both energy and intensity (significance) to determine the composition signature. Having the best energy resolution (
0.2% at 1.33 MeV), a high-purity germanium (HPGe) detector is usually utilized to provide high peak distinction. However, HPGe also suffers from neutron damage [Citation9,Citation10] and must be placed sufficiently far from the neutron source, introducing Delay (
) and Reset (
) periods between the Irradiation and Measurement periods. Lanthanum-bromide (LaBr
) has been evaluated for DGS due to it having a higher count-rate capability as a scintillator [Citation11], but even these relatively high resolution (
3% at 0.6 MeV) scintillators have challenges resolving individual peaks.
For EquationEquation (5)(5)
(5) , the shielding intensity suppression (
) is dominantly offset by increasing the decay rate,
, through the production,
, in EquationEquation (3)
(3)
(3) . The most efficient way
can increase is through
since
of the fissile nuclides (e.g.
U,
Pu, and
Pu) is
500
greater for thermal energies (e.g.
1 eV) than for fast energies (
1 MeV) of all fissionable nuclides (see ). However, the neutron sources available for use within a reprocessing plant are restricted on size and therefore limited to deuterium-tritium and deuterium-deuterium neutron generators or radioactive isotopes (e.g.
Cf). The challenge is that each of these produce neutrons with fast energy, requiring moderation into the thermal range [Citation12,Citation13]. Again, to protect an HPGe detector, sufficient neutron filtering and distance must be utilized for a DGS interrogation, further demanding the Delay and Reset periods.
Figure 2. The fission cross section of U,
Pu,
Pu, and
U vs. log-energy from the ENDF/B-VII.1 database [Citation15] as described in the legend. The vertical lines, with various shades of cyan and dash-dot patterns according to the legend, mark energies indicated as the fission yield production energy in the ENDF database. See online version for color.
![Figure 2. The fission cross section of 235U, 239Pu, 241Pu, and 238U vs. log-energy from the ENDF/B-VII.1 database [Citation15] as described in the legend. The vertical lines, with various shades of cyan and dash-dot patterns according to the legend, mark energies indicated as the fission yield production energy in the ENDF database. See online version for color.](/cms/asset/022456e0-c539-4bcb-97b4-992819623924/tnst_a_1742812_f0002_oc.jpg)
While the absolute fission rate is dependent on the neutron source intensity, the individual peaks observed are more significantly affected by the interrogation itself since EquationEquations (4)(4)
(4) and (Equation5
(5)
(5) ) are both highly dependent on time. Specifically, the fission products are created during the Irradiation period through the last term of EquationEquation (4)
(4)
(4) , which is different for each fission product due to the unique
and
. While all short-lived fission products are created, the gamma-ray spectrum is only observed during the Measurement period with a Delay period removing the shortest lived short-lived fission products (
5 s) and a Reset period allowing more fission product nuclei to decay but not contribute to the spectrum. Finally, additional Cycles allow the longer lived short-lived fission products to build up from the decay of their fission product parents, changing the observed spectrum over the full interrogation.
The work presented here evaluates fission product delayed gamma-ray spectra () above 2.7 MeV from samples irradiated with the PUNITA system. The peaks (
) are determined using the Evaluated Nuclear Structure Data Files (ENSDF) database [Citation14] with the fission yield values from ENDF/B-VII.1 [Citation15]. The data were processed and analyzed using the CERN ROOT analysis framework [Citation16].
3. Experimental conditions and procedures
PUNITA was developed for differential die-away analysis (DDA) [Citation17] using a deuterium-tritium neutron generator with a maximum output of n/s emission rate. This neutron generator is encased in a set of tungsten rings and run at a lower intensity to produce a
n/s/cm
flux in the center of a
-cm
cavity within graphite and high-density polyethylene (HDPE) walls [Citation8]. Earlier work showed that PUNITA could be used as a DGS irradiation system [Citation18] by opening one of the doors to place an HPGe detector outside of the neutron field. The normal DDA interrogation was modified by adding an external pulse generator to control the neutron generator and send TTL control signals to both transfer the sample and start the data acquisition. However, the pulse generator still required a manual reset for safety. For this work, extra graphite and HDPE was added inside the cavity in various amounts to boost the flux within the sample (see ), the details of which will be described in a separate publication.
Figure 3. The graphite and high-density polyethylene infill for the PUNITA cavity (black outline) around the neutron generator and sample shuttle for the later experiments. See online version for color.
The interrogated samples were combinations of standard, low-radioactivity reference materials: U from the Central Bureau for Nuclear Measurements (CBNM) [Citation19] and PuGa alloy disks. indicates the run reference number; associated U,
Pu, and
Pu masses; and interrogation where
,
,
,
represent the irradiation, delay, measurement, and reset times in real-time seconds and
indicates the number of cycles. All interrogations were performed with an Irradiation time of
s. The number of cycles for the 2018XX runs is the maximum number in the interrogation with individual spectra for each period integrated up through that cycle. The runs with a combination cycle time indicate there was a problem in the interrogation after the first number of cycles with the second number of cycles added onto the end.
Table 1. The list of campaign runs for the associated samples and interrogation as noted in the text used in this study with the ‘0.00’ indicating there was no U and/or Pu, but with additional Al material.
The CBNM samples have a 7-cm diameter and are
2 cm thick; the PuGa are either 0.2 or 0.6 cm thick and between 0.2- and 3.7-cm diameters depending on the declared mass. For the 2018XX runs, the PuGa samples were attached to an Al plate to ensure they were in the same position for each interrogation cycle; the CBNM Al dummy sample was added starting with Run 201814. This became important since, as observed in Run 2015Al, the fast neutrons from the deuterium-tritium neutron generator also produce
Mg and
Na from (n,p) and (n,
) reactions in addition to the (n,
) reaction with
Na producing an interference gamma ray at 2754 keV (see ).
Figure 4. The gamma rays produced by the PUNITA deuterium-tritium neutrons from Al,
Mg, and
Na from the (n,
), (n,p), and (n,
) reaction modes on the
Al in the dummy sample.
For the 2015 measurements, a 25% Canberra GR-2520 detector was placed 10 cm above the sample with 1 mm of Cd between them and the sample was shuttled horizontally out of an open door, as in the earlier JRC work [Citation18]. For the 2016 measurements, the same transfer occurred, but instead a 50% ITECH Instruments NIGC 50220 was placed 6 cm to the side of the sample with a 5-mm Pb filter. For the 2018 measurements, a fast transfer system was installed to vertically move the sample to an 80% ORTEC GMX 80P4-95-A detector placed below the PUNITA system (see ). While the detector was placed 4 cm in front of the sample with only 1.4 cm of Pb and 1 mm of Cd between them, the side of the detector was facing the sample due to space limitations.
Figure 5. The relative positions of the PUNITA deuterium-tritium neutron generator and detector compared to the vertically transferred CBNM U and PuGa samples. See online version for color.
Due to the different interrogations affecting the absolute rates, only counts are compared in this study. Following previous work [Citation20], these are determined by first finding the statistically measured peak count for the particular interrogation () and sample (
)
where and
are the bin-wise integrated measured counts of the background and total under the peak. To smooth out the random counts and to find doublets, the peaks are then fit to a Gaussian-on-line curve with the fit peak counts calculated according to
where and
are the Gaussian fit peak half-width and amplitude for the peak found at the mean energy
.
HPGe detectors were used to obtain high-resolution peaks, in EquationEquation (5)
(5)
(5) , with the gamma rays collected in integrated pulse-height spectra over the entire interrogation (2015XX and 2016XX) or as cyclic pulse-height spectra that were composites of the present and all previous cycles. While the PUNITA neutron flux was sufficient to produce observable gamma-ray peaks with the chosen binning, the histograms were re-binned to smooth out the random background and to increase the statistical counts for a given peak that would otherwise have larger
and smaller
by being distributed over more bins. This reduces the systematic uncertainty on the Gaussian counts:
where and
are the fit values used in EquationEquation (7)
(7)
(7) . However, all measurements are scaled to the keV-bin width to ensure better spectral comparison.
4. Qualitative analysis of measured data
Using the observable peaks, DGS is expected to determine the composition of a mixed sample to reasonable accuracy and precision. Measuring pure U,
Pu, or
Pu provides a foundation to determine the primary gamma rays and associated fission products that would contribute to the composition of a mixed nuclear material sample. While the 2015XX and 2016XX runs use single samples dominated by a single fissile nuclide, most of the 2018XX runs combine various U and Pu samples (see ). Consequently, the fundamental differences will be noted from the 2015XX and 2016XX runs and contrasted to the combined samples of the 2018XX runs. For improved determination of the spectral signature, a refined quality cut was applied for the relative peak intensity:
where and
are the amplitude and uncertainty of the Gaussian peak fit at energy
.
The two spectra in show the difference between the U and (dominantly)
Pu (Runs 201610 and 201614) scaled to the fissile mass using a 150-s Measurement period and 5-s Delay period. Of significant note is that the slightly larger mass, smaller volume Pu sample resulted in less intense peaks compared to those from the U sample, indicating that DGS is very sensitive to the volume of the sample (see ). Regardless, as expected from , the smaller nuclides of the lower mass yield (e.g.
) appear more prominently in the
U spectrum while the larger nuclides (e.g.
Tc) appear more prominently in the
Pu spectra.
Figure 6. A comparison of Runs 201614 and 201610 between 2700- and 3650-keV. Note, the visible peaks not listed in fail at least one quality cut.
Table 2. Gamma-ray peaks fit mean energy and Gaussian counts from the noted short-lived fission products that pass the relative peak significance cut and compared for composition and measurement time () differences as indicated for the Run listed in . The values are rounded to the uncertainty.
Comparatively, the 2018XX runs had a shorter Delay period, the Measurement period was concurrently reduced (see ), and the closer detector had a higher efficiency. While not iteratively evaluated, these combined changes for the same samples show significant increases in many of the peak counts (see ). Though there was a small quantity of Pu with the 201817 U run, it does not produce a significant contribution to the spectrum since the Tc peaks do not pass the relative peak significance quality cut of EquationEquation (9)
(9)
(9) ;
and is not visible above the background. Of significant note is that the visible
I 2868-keV peak in the Pu 201814 spectrum failed the stronger relative peak intensity quality cut at only 3.3
. It should also be noted that the 2933-keV peak from
Sr is actually a doublet with the 2925.7-keV peak from
Rb. Consequently, the peak intensity
% does not appear with a proper ratio to the
% peak.
Figure 7. A comparison of Runs 201814 and 201817 between 2700- and 3650-keV.
While the absolute counts of the gamma-ray peaks can provide a measure of the number of fission-product nuclei produced by their decay, the ratio of the peaks provides a more accurate composition determination since most fission products are produced by multiple fissile nuclides. The peaks are best scaled to the 3575-keV peak from Y since it has a
10-min half-life and is the daughter of
Sr that is the primary isobar for all three major fissile nuclides (see ). The peak-ratio (
) of the Gaussian-fit peaks from EquationEquation (7)
(7)
(7) is calculated by
Table 3. A list of many important fission products emitting at least one gamma ray with energy 2.7 MeV useful for peak-ratio comparison of delayed gamma-ray spectroscopy or higher-yield parent fission products from the ENDF/B-VII.1 database [Citation15]. Also listed are their associated half-life and fission yields with the numbersin parentheses indicating the uncertainty on the last digit of the value.
where is the peak fit mean to compare and
is the cycle number. While it can be seen that the
Rb 3600-keV peak increases by
51% in absolute counts between the two interrogation patterns for
U (see ), shows that
increases by only
11% since the
Y peak also increases by
37%. Of major importance for composition analysis, though, is that
for
U is inverted for
Pu under both interrogation patterns due to the fission yields and half-lives listed in .
Table 4. Gamma-ray peaks fit mean energy and relative Gaussian counts from compared to the 3575-keV peak from Y. The number in parentheses is the uncertainty on the last digit of the value based on the smallest overall digit in the uncertainties.
Compared to the 2016XX runs, more gamma-ray peaks become significant in the 2018XX runs by reducing and
. This is not attributable to the higher efficiency or shorter source-to-detector distance since the peak ratios would otherwise remain constant. The only peak that can be associated with the detection difference itself is the 2803-keV peak, the single escape peak from the
Rb 3316-keV gamma ray.
For composition evaluation, the differences in the peak ratios indicate that the spectrum is sensitive to the interrogation itself. Thus, the primary DGS focuses are to determine the optimum interrogation (pattern and number of cycles) and to develop an instrument that can perform this interrogation within an analytical laboratory. For instance, the 2716-keV peak from Sr appears with the same relative intensity in both the U and Pu 50-Cycle, 50-s Measurement interrogation spectra, contrary to the relative U and Pu fission yields for this parent–daughter pair. Additionally, the
Tc peaks are more observable in Run 201814 while the Rb isotopes’ peaks are more significant in Run 201817 but in different ratios compared to the 2016XX runs.
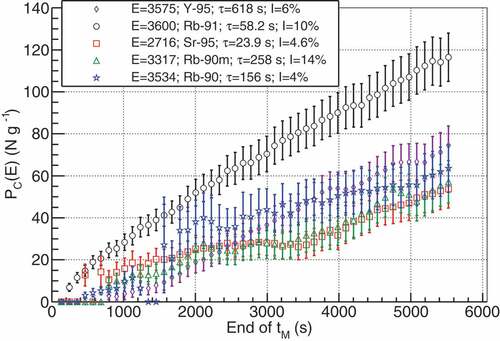
To determine the optimum interrogation for composition analysis, the build-up of the gamma rays over each cycle should be evaluated. Though the 2015XX and 2016XX runs were single integrated pulse-height analysis (PHA) spectra, the 2018XX runs were collected with PHA integrated up through the end of the particular cycle (e.g. Cycle 23 was integrated from Cycle 1 through 23). shows a few of the counts from EquationEquation (7)
(7)
(7) of primary U peaks as a function of time (Run 201817); the last points are derived from . The linearity of the
Rb peak indicates that it was produced at roughly constant rates per cycle and mostly decayed away before each following cycle. The
Y peak was insignificant until the sixth cycle after which there were sufficient decays for the longer
from an increase in the total number of nuclei built in from
Sr parent; surpassing it after
2500 s. Similarly,
Kr (the primary 90 isobar) decays as
and
% [Citation14] with the shorter
Rb peak becoming significant earlier than
Rb.
Additionally, both the Sr and
Rb have a discontinuity around 3400-s. Estimating that these energies (
) are affected by a Compton edge, the incident energy (
) can be calculated as
where is the rest mass-energy of an electron. Evaluating the observed concurrent discontinuity, both of these
counts are likely affected by the Compton continuum of the higher 3575-keV peak from
Y.
Figure 8. A comparison of some of the major U fission product peaks in Run 201817 integrated through the cycle time. See online version for color.
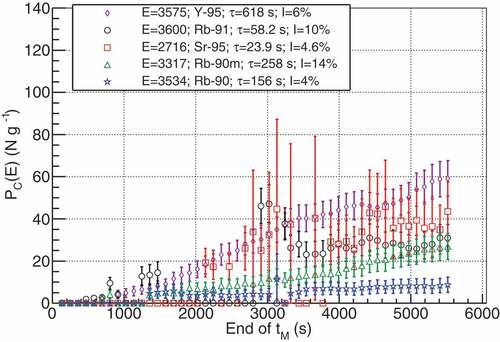
The same peaks can be analyzed from the Pu sample (Run 201814) but the lower fission rate delays the visible onset for many of the peaks and introduces large relative uncertainties (see ). However, scaling to the relative fission yield (
), fission cross-section (
), fission fraction mode (
), and the fissile mass (
) can give an indication of the expected difference. Applying this to the counts in the
Sr peak results in
using the values and errors of the 50 cycles in and estimating the fission cross-section at 0.0253 eV (thermal energy). Effectively, these two measurements are within error using this scaling method.
However, this fails for a direct calculation of the Y peak
which is the measured value. Using a Welch’s t-test to compare the fission yield contributions results in a t-value of
where is the associated uncertainty of the value in the numerator. Using the number of degrees of freedom
the ROOT calculated cumulative distribution function (CDF) is 0.957, indicating that there is a
5% chance of this being the same as the measured value. However, this peak is driven more by the
Sr parent, which results in
using and a CDF of
0.54, indicating that these are within 5% of each other.
Figure 9. A comparison of some of the major Pu fission product peaks in Run 201814 integrated through the cycle time. See online version for color.
and show the peak ratios for each cycle using EquationEquation (10)(10)
(10) . Other than the reduction of the peak-ratio uncertainties during subsequent cycles, the most prominent feature is that the mean of the ratios also change over time. As noted from , the
Sr-
Y peak ratio is
73% for both the U and Pu samples by the end of the 50 cycles with the U trend more precise due to the higher fission rate. Compared to the
Sr and
Rb peak trends in the U interrogation, the Pu interrogation shows the
Sr peak generally remains
50% greater than the
Rb peak for all cycles, correlating to the
Sr-to-
Kr fission yield ratio of
Pu (see ).
Figure 10. A comparison of peak-ratios of the major U fission product peak counts in proportional to the 3575-keV peak. Additionally, the same peak ratios from Run 201610 are shown for comparison. See online version for color.
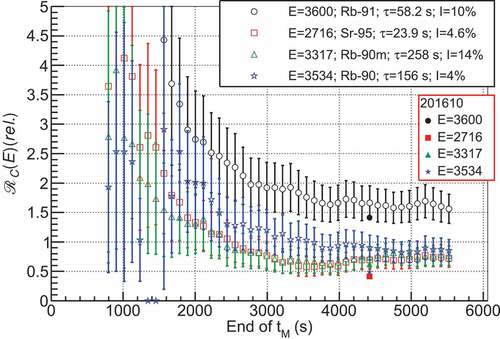
Figure 11. A comparison of peak-ratios of the major Pu fission product peak counts in proportional to the 3575-keV peak. Additionally, the same peak ratios from Run 201614 are shown for comparison. See online version for color.
Finally, other than the high-yield Rb peaks, the 201610 U ratios are
1 for all peaks, indicating that the longer Measurement period focuses more on the longer-lived short-lived fission products (increased
Y denominator) (see ). This is additionally supported by the
Rb peak having a lower ratio than the longer lived
Rb peak in the U spectrum and the 201610 peaks from the longer 150-s Measurement period being less than the associated peaks from the 201817 run.
Comparatively, the Pu sample only has the high yield, high-intensity Tc peaks with
, since, otherwise, these are all from lower-mass fission products where the fission yield is less than that for U (see ). While values indicate those associated with a more
Pu composition compared to a
U composition, these results indicate that the interrogation itself must be optimized to better distinguish the composition of a mixed sample.
5. Mixed Composition Study
Fundamentally, a changing composition involves each nuclide increasing or decreasing for a constant fissile mass. The first step of our mixed-composition analysis study compares Runs 201502 and 201503 and separately Runs 201616 and 201610 that have the same fissile composition (U) with different masses undergoing the same interrogation for each pair (see ). and compare the qualifying peaks of these four runs; shows the spectrum of 201610. The first study is to ensure that these two campaigns have the same result for the same sample by scaling to the different efficiency of the detectors (
), the different gamma-ray filters (
), the different distances between the sample and the detector (
), and the different number of cycles (
). Presuming that the
Rb is minimally affected by the build-up of shorter-lived parents, the 3600-keV peak from 201503 can be scaled to that of 201610 as
Table 5. Gamma-ray peaks fit mean energy, Gaussian counts, and t-test CDF results from different U content and interrogated as Runs 201502 and 201503 (see ). Also listed are the 201502 mass values scaled (201502’) to the 201503 mass and mass with self-shielding correction. The CDF is noted to the first different digit in the integrated values.
Table 6. Gamma-ray peaks fit mean energy, Gaussian counts, and t-test CDF results from different U content and interrogated as Runs 201616 and 201610 (see ). Also listed are the 201616 mass values scaled (201616') to the 201610 mass and mass with self-shielding correction. The CDF is noted to the first different digit in the integrated values.
compared to the 421 counts of from run 201610. EquationEquations (14)(14)
(14) and (Equation15
(15)
(15) ) result in
and
for a CDF of 0.451. Consequently, even with different shielding, these are statistically within
5% of each other and appropriate comparisons can be made.
From EquationEquations (4)(4)
(4) and (Equation3
(3)
(3) ), the number of gamma rays observed must be proportional to the fission rate that is in turn proportional to the fissile mass for the same interrogation conditions. For these two pairs of single-sample measurements, it is expected that the rate for each observable gamma ray should be proportional to the
U in the sample (see ). Scaling the low-mass peaks of each pair in and to the associated higher mass of the same interrogation using
shows that there are always too few gamma rays observed in the higher mass spectrum. This appears consistent with Rennhofer [Citation18] that also shows a nonlinear mass correlation that appears to be from self-shielding [Citation21], as indicated by the corrected values that are closer to the measured value. However, while Rennhofer integrated all gamma rays observed above 3.3-MeV and only reached a few hundred counts, these experiments measured hundreds of counts in the individual peaks, with 100
the counts integrating above 3.3-MeV.
Reducing the minimum energy to include additional relevant peaks, integrating above keV shows similar results, though these are slightly biased by the
Na decay from
Al activation. However, most of the integrated counts are from scattered and Compton background gamma rays and dissociated from the fission products (see and ). Consequently, any mass correlation studies should be evaluated from specific gamma-ray peaks with the self-shielding correction fully understood.
In our attempt to study a mixed composition, there is only one set of a consistently increasing mass of a single nuclide that systematically changes the composition. All other runs used multiple PuGa samples to attempt to span different mixed compositions. Runs 201814, 201818, and 201822 gradually have increasing U masses for a fixed Pu sample (see ). While there is not a corresponding reduction in the Pu mass in this set of consistent runs, shows the peak counts in each run scaled to the total fissile mass to approximate this adjustment. The 2753-keV peak systematically increases due to the larger
Br/
Rb contributions from the
U with similar results for the 3600-keV peak from
Rb.
Table 7. Gamma-ray peaks fit mean energy and Gaussian counts from increasing U mass with the same Pu sample base and interrogated with the same periodic time pattern and scaled to the total fissile mass (see ). Also shown are the relative increase of those peaks appearing in multiple spectra for sequentially greater U.
The 3575-keV peak from Y that is significant for both the U and Pu samples first decreases when the 0.53-g
U sample is inserted before increasing with 30%
U increase (see ). This happens similarly for the 3316- and 4136-keV peaks. However, while there is no decrease in the amount of
Pu, the 2702-keV peak from
Nb and the 2851- and 3186-keV peaks from
Tc dominant in
Pu decrease dissociatively with a larger
U mass. From the configuration described in , and the fact that the U sample is significantly larger and contains
200 g of
U
O
, it appears that neutrons scattered back from the PUNITA walls and infill moderator are significantly filtered by the CBNM before entering the PuGa. Essentially, the neutron flux entering the PuGa sample is not the same as that entering the CBNM samples since the
U and
O sufficiently scatter or absorb the neutrons initially reaching the Pu when the CBNM is not present. Consequently, it can be understood that a mixed nuclear material sample must be homogeneous in order to properly evaluate the composition by allowing each nuclide to have the same probability to interact under the same neutron flux conditions.
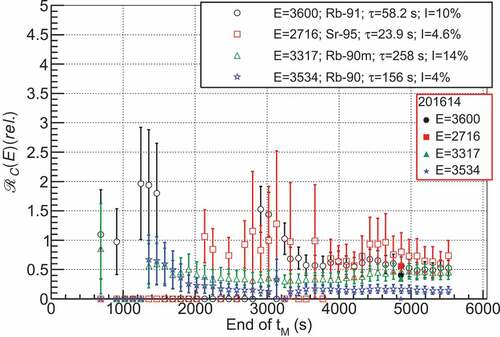
Compared to the increasing U mass for a fixed Pu mass, Runs 201810, 201809, 201814, and 201811 compare variable quantities of Pu isotopes combining two PuGa samples. However, during Run 201809 there was a mistimed irradiation that caused an abnormal delay in the interrogation pattern and Runs 201810 and 201811 stopped after 35 and 33 cycles. Consequently, shows the counts per fissile mass and the associated volume for increasing masses only through Cycle 33 for each run. Unlike the total integrated counts above 2700- and 3300-keV that are consistent with the single-nuclide runs (see ), the individual peak counts have no clear correlation to the total fissile mass, volume, or Pu fraction since some peaks systematically increase while others jump discontinuously. There is a slight correlation of the peaks to an increasing mass-volume (see ), though more studies must be performed to see if there is a filtering effect for these thin, dense samples.
Figure 12. A comparison of total counts above the indicated energy in compared to the total fissile mass of the combined samples.
Figure 13. A comparison of peak-ratios of the fission product peak counts in compared to the mass-volume of the combined samples for those peaks that are in all four spectra. See online version for color.
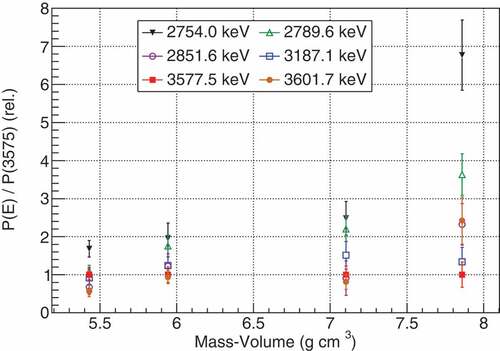
Table 8. Gamma-ray peaks fit mean energy and Gaussian counts from increasing Pu mass interrogated with the same interrogation pattern (see ). These values are integrated through the maximum of Run 201811 that stopped at 33 cycles.
6. Discussion of lessons learned and future development
The most important lessons learned from these studies is that DGS is highly sensitive to homogeneity, volume, timing, and neutron source energy. From the perspective of safeguards verification, our primary goal of spent nuclear fuel solutions is highly applicable for homogeneity since a single HKED sample will contain all of the fissile nuclides in one volume. While self-shielding may play a role in the number of nuclei undergoing fission, there is a probability for all nuclides to observe the same neutron flux. However, from the observed dependence on the volume (and mass), the desired HKED sample will affect the minimum neutron source intensity required for efficient interrogations. Additionally, while our goal is to develop DGS for high-radioactivity nuclear material, homogeneous samples of low-radioactivity nuclear material (e.g. MOX powder) can also be evaluated using this technique.
More importantly, though, is that changing the interrogation pattern greatly affects the ratio of the gamma-ray peak intensities. As such, an optimum interrogation must be determined to evaluate the composition from those fission products best associated to the fissionable nuclides of interest. Additionally, due to the limitations with the samples of these studies, more experiments are required to determine those fission products useful for distinguishing Pu, for which the evaluated nuclear data has large uncertainties (see ).
Finally, as observed throughout this work, Br and
Rb both produce a gamma ray at
2753-keV that should be extremely useful for distinguishing a
U contribution from a Pu contribution. However, due to the observed
Na decay peak from
Al(n,
) activation, this presents challenges to the analysis. Since this is caused by the
14-MeV neutrons from the deuterium-tritium neutron generator, using deuterium-deuterium or
Cf neutrons that are produced at
2.5 MeV will minimally affect an Al casing. However, the sample containers used for HKED do not contain Al and the final instrument design can address this challenge.
7. Conclusions
Over the course of three years, multiple experiments were performed using PUNITA to interrogate U and Pu samples in order to observe their delayed gamma-ray signature from short-lived fission products. From these spectra, we were able to distinguish many gamma rays that can help determine the composition of a mixed nuclear material sample wherein the low-energy signature is hidden. Toward optimizing the composition analysis, our present results indicate that DGS is highly dependent on the timing pattern as well as the absolute volume and the homogeneity of the sample. Simple correlations were made to the composition and mass of the samples with lessons learned on the best practices for evaluating the composition for safeguards verification of high-radioactivity nuclear material samples.
Acknowledgments
This work is supported by the Japanese Ministry of Education, Culture, Sports, Science, and Technology (MEXT) under the subsidiary for the “promotion for strengthening nuclear security and the like”. This work was done under the agreement between JAEA and EURATOM in the field of nuclear materials safeguards research and development.
Disclosure statement
No potential conflict of interest was reported by the authors.
References
- Reilly D, Ensslin N, Smith H Jr, et al. Passive nondestructive assay of nuclear materials. USA.: Nuclear Regulatory Commission; NUREG/CR-5550, LA-UR-90-732; 1991.
- Menlove HO, Holbrooks OR, Ramalho A Inventory sample coincidence counter manual. USA: Los Alamos National Laboratory; LA-9544-M; 1982.
- Ottmar H, Eberle H The hybrid K-Edge/K-XRF densitometer: principles - design - performance. Germany: Kernforschungszentrum Karlsruhe; KfK 4590: 1991 Feb.
- International Atomic Energy Agency. Safeguards techniques and equipment: 2011 edition. International Atomic Energy Agency. Verification Series No. 1 (Rev. 2); 2011.
- International Atomic Energy Agency. International target values 2010 for measurement uncertainties in safeguarding nuclear materials. International Atomic Energy Agency; 2010 Nov; p. STR–368.
- Itoh T, Hara S, Sato Y, et al. Enhanced cooperation between SSAC and IAEA through joint operation of on site laboratory for safeguarding Rokkasho Reprocessing Plant (RRP). Proceedings of the Symposium on International Safeguards; 2010 Nov 1–5;Vienna (Austria): IAEA-CN-184.
- Rodriguez DC, Takamine J, Koizumi M, et al. Utilizing delayed gamma rays for fissionable material measurement in NDA. Proceedings 37th Annual Meeting of the European Safeguards Research & Development Association; 2015 May 19–21; Manchester (UK); p. EUR–27342.
- Rennhofer H, Pedersen B, Crochemore JM. Neutron flux from a 14-MeV neutron generator with tungsten filter for research in NDA methods for nuclear safeguards and security. Proceedings of the International Conference on Applications of Nuclear Technology; 2009 Jun 14–20; Crete (Greece). p.36–42.
- Borrel V, Kandel B, Albernhe F. et al. Fast neutron-induced damage in INTEGRAL n-type HPGe detectors. Nuc Inst Meth A. 1999;430(2):348–362.
- Pehl RH, Madden NW, Elliott JH, et al. Radiation damage resistance of reverse electrode GE coaxial detectors. IEEE Trans Nuc Sci. 1979;26:321–323.
- Favalli A, Iliev M, Ianakiev K, et al. Delayed gamma-ray spectroscopy with lanthanum bromide detector for non-destructive assay of nuclear material. Nuc Meth Inst A. 2018;877:192–196.
- Simpson JD, Chichester DL. Tailoring the neutron spectrum from a 14-MeV neutron generator to approximate a spontaneous-fission spectrum. Proceedings of the American Institute of Physics Conference; 2011 Dec 12–18; Crete (Greece). p. 63–70.
- Rodriguez DC, Rossi F, Takahashi T, et al. Model design of a compact delayed gamma-ray moderator system using 252Cf for safeguards verification measurements. Appl Rad Isotopes. 2019;148:114–125.
- National Nuclear Data Center. Evaluated nuclear structure data file retrieval; [cited 2019 Aug 21]. Available from: http://www.nndc.bnl.gov/ensdf/;BNL-NCS-51655-01/02-Rev
- Chadwick MB, Herman M, Obložinský P, et al. ENDF/B-VII.1 nuclear data for science and technology: cross sections, covariances, fission product yields and decay data. Nucl Data Sheets. 2011;112(12):2887–2996.
- Brun R, Rademakers F. ROOT: an object-oriented data analysis framework. Nuc Inst Meth A. 1997;389: 81–86.
- Favalli A, Pedersen B. Design and characterisation of a pulsed neutron interrogation facility. Radiat Prot Dosimetry. 2007;126(1–4):74–77.
- Rennhofer H, Crochemore JM, Roesgen E, et al. Detection of SNM by delayed gamma rays from induced fission. Nuc Inst Meth A. 2011;652(1):140–142.
- de Bièvre P, Eschbach HL, Lesser R, et al. 235Uranium isotope abundance certified reference material for gamma spectrometry EC nuclear reference material 171 certification report. Belgium: Joint Research Centre; EUR-10503-EN; 1986.
- Rodriguez DC, Anderson E, Anderson KK, et al. Measurement and analysis of gamma-rays emitted from spent nuclear fuel above 3 MeV. Appl Rad Isotopes. 2013;82:181–187.
- Croft S, Alvarez E, McElroy RD, et al. The absolute calibration of active neutron assay instruments. Proceedings of the 27th ESARDA Symposium on Safeguards and Nuclear Material Management; 2005 May 10–12; London (England); EUR-21674-EN, Paper P080.