
 ?Mathematical formulae have been encoded as MathML and are displayed in this HTML version using MathJax in order to improve their display. Uncheck the box to turn MathJax off. This feature requires Javascript. Click on a formula to zoom.
ABSTRACT
A deep-penetration shielding experiment was performed at the CERN High-energy AcceleRator Mixed-field (CHARM) facility. The protons (24 GeV/c) were injected into a 50-cm-thick copper target and the released neutrons were transmitted through a bulk concrete shield located vertically upward from the target, where they were measured with bismuth and aluminum activation detectors placed at various penetration distances in the shield. From the radionuclide production rate in the activation detectors, the attenuation profiles through the concrete shield were obtained for the reactions of 209Bi(n,xn)210-xBi(x = 4–9) and 27Al(n,α)24Na. The attenuation length of the high-energy neutrons through ordinary concrete was estimated as 120 g/cm2, in good agreement with Monte Carlo simulations using simple slabs as a universal geometry implemented in Particle and Heavy Ion Transport System (PHITS) code. Proton energy dependence of attenuation length was also investigated with simulations by PHITS code and comparisons with the published data were discussed.
1. Introduction
Recently, a number of particle accelerator facilities have been constructed for physics research, medical irradiation, and industrial use. Accordingly, accelerator specifications have been upgraded to enhance the intensity and energy of the particle beam, providing more efficient irradiation. To ensure the radiation safety in such facilities, the radioactivity and prompt-radiation levels must be predicted from the data of secondary neutrons generated by beam irradiation. The neutrons from high-energy accelerators are highly penetrable and require massive shield to suppress the radiation levels outside the facility. As the radiation shield occupies a considerable portion of the total construction costs, the shielding design is very important when constructing high-intensity, high-energy accelerator facilities.
Most of the conceptual-shielding designs for high-energy accelerators are based on the point-kernel method. During deep penetration through thick concrete shield, low energy neutrons below MeV region are attenuated quickly, on the other hand, they are generated due to elastic and inelastic scattering by the high-energy neutrons (approximately >20 MeV). Such phenomena cause neutrons to attain a spectral equilibrium state; therefore, the attenuation curve is strongly ruled by high-energy neutrons. For instance, the Moyer model [Citation1] assumes that neutrons exist in spectral equilibrium and that the neutron dose rate is exponentially attenuated behind the thick concrete shield.
The Moyer model computes the dose rate behind the shield at various angles arising from prompt radiations by a beam loss at a point or a line source. However, the Moyer model is practically reliable and widely used, particularly for the dose rate evaluation at a point perpendicular (90°) to the beam direction due to a point beam loss. The dose rate H [mSv/h] for the 90° direction is expressed as follows:
where J [W] is the beam loss power at the source point, H1 [(mSv/h) cm2/W] is dose rate at 1-cm distance for a unit beam-loss power, r [cm] is the distance between the beam-loss point and the estimation point, and d [cm] is the effective shield thickness. ρ [g/cm3] is the density of the shielding material, and λ [g/cm2] is the attenuation length. Tesch et al. also proposed the equation for the 90° direction from the beam-loss point [Citation2], which is almost identical to the EquationEq(1(1)
(1) ), where Hcasc corresponds to H1. Therein, the Hcasc parameters were summarized based on the experimental data for neutron yields from various targets that were bombarded with protons of energies up to about 1 GeV, and the λ values based on the experiment were also summarized for the lateral concrete shield [Citation2].
The attenuation lengths of thick lateral shields have been measured at several accelerator facilities. Stevenson et al. measured for the earth around the CERN’s proton synchrotron (PS) at energies of 13.7 and 25.5 GeV [Citation3]. Ban et al. measured the neutron attenuation length in concrete for 12-GeV and 500-MeV proton beams at KEK [Citation4,Citation5]. At LANSCE facility of Los Alamos National Laboratory (LANL), Bull et al. measured the neutron spectra behind a lateral steel shield using 800-MeV proton beam and the attenuation length for steel was experimentally evaluated [Citation6]. At the ISIS spallation-neutron source facility using 800-MeV proton beam in the Rutherford Appleton Laboratory (RAL), Nunomiya et al. measured the attenuation lengths of iron and concrete for the neutrons in lateral direction [Citation7]. At the Alternating Gradient Synchrotron (AGS) in Brookhaven National Laboratory (BNL), a shielding experiment with a mercury spallation target bombarded with 24-GeV protons was performed, and attenuation lengths for concrete and iron were experimentally evaluated [Citation8]. In Fermilab (FNAL), a shielding experiment with iron and concrete was performed with a beryllium target irradiated by 120-GeV protons at the Pbar target station, and neutron attenuation length was evaluated [Citation9]. However, such reliable experiments are scarcely reported, and their results are dispersed mainly because of difference in complex experimental geometry.
Several other experiments, which are not direct measurement of attenuation length, have studied on neutron penetration using typical shielding materials at high-energy proton accelerator facilities. In the Takasaki Ion Accelerators for Advanced Radiation Application (TIARA) of the Japan Atomic Energy Research Institute (JAERI, currently QST), 40- and 65-MeV quasi-monoenergetic neutrons were produced by proton beams, and the neutron energy spectra were measured behind concrete [Citation10], iron [Citation11] and polyethylene [Citation12] shields. At the KEK spallation neutron source facility (KENS) using 500-MeV proton beam, the attenuation of neutrons in forward direction through the concrete shield was measured [Citation13]. In the CERN-EU high energy Reference Field facility (CERF), a 120 GeV/c positive-hadron beam was directed at a thick copper target and the neutron energy spectra between 32 and 380 MeV were measured behind lateral shields of concrete and iron [Citation14]. These experimental results are important as benchmark data, which have been widely used in validations of nuclear models, parameters, and reaction cross-sections.
This paper reports the experimentally evaluated neutron attenuation length for lateral concrete shield by using the wide and simple shielding geometry and source term which were clearly defined. At the CERN High-energy AcceleRator Mixed-field (CHARM) facility [Citation15,Citation16], a deep-penetration shielding experiment was performed in 2015 [Citation17–Citation19]. High-energy (24 GeV/c) protons were injected into a 50-cm-thick copper target, generating neutrons that penetrated a 360-cm-thick concrete shield placed vertically upward from the target. The neutrons transmitted through various thicknesses of the concrete were measured using bismuth and aluminum activation detectors placed inside the shield, and the neutron attenuation length for lateral concrete shield was estimated. The Monte Carlo simulations were carried out and comparisons with the experimental results were discussed. For evaluating the proton-energy dependence of neutron attenuation length, Monte Carlo simulations were performed using simple slabs as a universal geometry, and the results were compared with other experiments and discussed.
2. Experiment
2.1 Facility
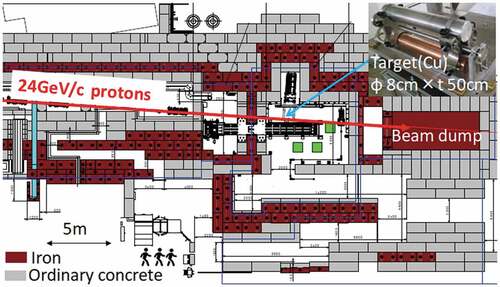
shows the horizontal structure of the CHARM facility in the east hall at CERN. The 24 GeV/c protons were transported from the PS and injected into a target located at the center of the facility. The target was made of 8-cm-diameter and 50-cm-thick copper. The protons not interacted in the target were transported into an iron beam dump placed in the downstream. The proton beam line and target room were surrounded by concrete and iron shields and the target room can only be accessed through a maze.
Figure 1. Horizontal structure of the CHARM facility.
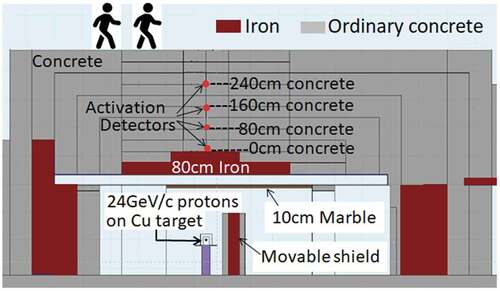
shows the vertical shielding structure of the CHARM facility, which is perpendicular to the beam axis at the target location. The target center is positioned on the beam-line which is 129 cm above the floor. To the right of the target in , there was a four-layered movable shield wall of two iron plates sandwiched by two concrete plates. Each plate was 20-cm thick. Above the ceiling of the target room, located 240 cm above the beam line, a bulk shield was constructed of 80-cm-thick cast iron and 360-cm-thick ordinary concrete. A 10-cm-thick marble ceiling was installed at 185 cm above the beam line (below the iron shield). gives the densities and chemical compositions of the concrete, iron, and marble shielding materials.
Table 1. Density and chemical composition of the materials used in the present experiment.
Figure 2. Vertical cross-section of the shielding structure in the CHARM facility perpendicular to the beam axis at the target location. The beam travels from front to back of this figure.
2.2 Activation detector samples and experimental setup
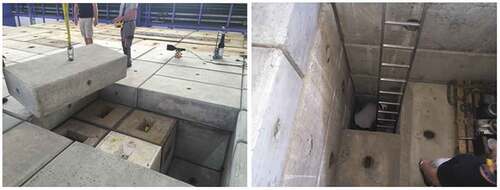
The neutrons transmitted through the upward bulk shield were measured by activation-detector samples composed of bismuth (9.78 g/cm3, 99.99% purity) and aluminum (2.7 g/cm3, 99.99% purity), which are widely used in high-energy neutron measurements [Citation20]. The bismuth and aluminum detectors were each prepared in two sizes (Ø 8.0 cm × t 1.0 cm and Ø 4.0 cm × t 0.4 cm, where Ø is the diameter and t is the thickness). The sample size was selected based on the neutron intensity inside the shield. As shown in , parts of the concrete blocks were removed from the top of the shield in the CHARM facility. The samples were placed in the pits for crane hooks located in the top surface of the concrete block at shield depths of 0, 80, 160, and 240 cm of concrete as shown in . The pit volumes were negligible compared with the total massive concrete bulk shield. After setting the samples, the removed blocks were replaced prior to the beam irradiation.
Figure 3. Photographs of the partially removed concrete shield and activation detectors being placed inside the shield, looking down from the shield top of the CHARM facility.
2.3 Beam irradiation and radioactivity measurements
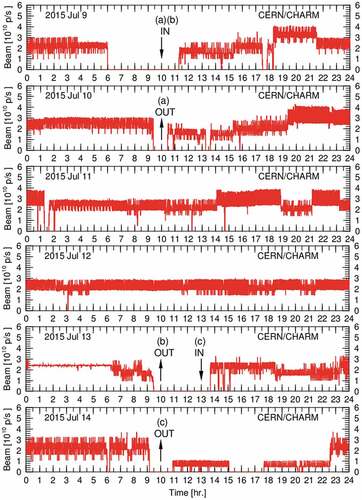
The intensity of the 24 GeV/c proton beam from the PS was 5 × 10¹¹ protons per pulse, where the pulse length was 350 ms. The beam pulses were distributed to multiple beam lines and the maximum average permissible intensity at CHARM was 6.7 × 10¹⁰ proton/sec (p/s) [Citation21]. The relative beam intensity was monitored by a Secondary Emission Chamber (SEC), which was calibrated using the aluminum activation method. shows the average-intensity history measured by the SEC during the experiment. The intensity ranged from 0.5 × 10¹⁰ to 4.0 × 10¹⁰ p/s. lists the irradiation durations, the sizes and locations of the activation-detector samples placed inside the concrete shield. At the 240-cm depth, the 1-day and 4-day irradiations (labeled (a) and (b), respectively, in ) were performed with two bismuth samples because the extended irradiation time (b) acquires reasonable activities of the long-life radionuclides in bismuth at the maximum shield thickness. The other samples were irradiated for 1 day (labeled (c) in ).
Table 2. Sizes and locations of the activation detector samples. Irradiation duration for (a)-(c) groups are indicated in .
Figure 4. History of beam intensity during the irradiation.
After the irradiation period, the beam was temporarily stopped to remove the irradiated samples and install new samples at the corresponding locations. The removed samples were transported to the CERN gamma-spectrometry laboratory and the energy spectra of the photons from the radionuclides generated in the samples by the 209Bi(n,xn)210-xBi(x = 4–9) and 27Al(n,α)24Na reactions were measured by a high-purity germanium-semiconductor detector (Ge detector). To measure the radionuclides of the short (201Bi and 202Bi), medium (203Bi and 204Bi), and long (205Bi and 206Bi) half-lives, the bismuth samples were measured continuously three times for approximately 3, 15 and 24 h, respectively. The aluminum samples were measured at times between 3 and 24 h depending on the peak count rates of the photons from 24Na.
2.4 Data analysis
lists the analyzed radionuclide-production reactions, half-lives, and photon energies with their emission ratios. shows a typical photo-peak in the measured energy spectrum of the photons emitted from 206Bi. The photo-peak counts at the corresponding photon energies were obtained by summing the counts of peak regions and subtracting the baseline contribution, which was estimated at both sides as shown in . The peak counts S and their standard deviations σ were respectively estimated as follows:
Table 3. Production reactions, half-lives, and photon energies of the radionuclides in the activation detectors.
Figure 5. Typical peak and base-line regions in the energy spectrum of 803-keV gamma-rays from 206Bi radionuclide measured by the Ge-detector.
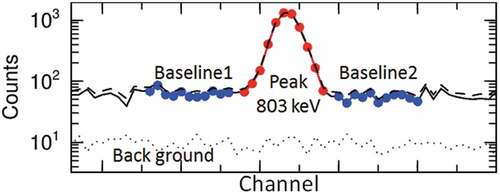
where β1 = 0.5Wp/W1 and β2 = 0.5Wp/W2.
Np, N1, and N2 are the gross counts of the peak region, baseline region 1 and baseline region 2, respectively, while Wp, W1, and W2 are the corresponding channel widths.
Finally, the production rates R [number/atom/proton] in the activation-detector samples were estimated with the detector efficiencies and the beam-intensity fluctuations during the irradiation;
where
and S is the peak count, λd is the decay constant of the radionuclide [min−1], N is the number of atoms in the activation-detector sample, and ε is the photo-peak efficiency of the Ge detector, estimated by using the LabSOCS software (Mirion Technologies Canberra KK) [Citation22]. γ is the emission ratio, n is the total number of time bins in the beam-history data, Qi is the number of protons in the i-th time bin, and Δt is the width of the time bin in the beam-history data [min]. Tc and Tm denote the cooling and measuring times, respectively [both in min].
3. Monte Carlo simulations
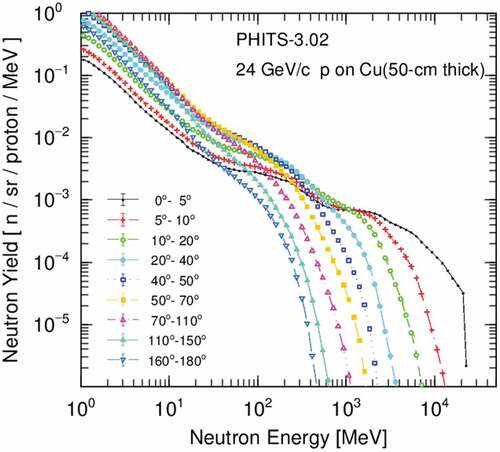
A Monte Carlo simulation was performed with the Particle and Heavy Ion Transport code System (PHITS) Ver-3.02 [Citation23]. To simulate the nuclear reactions of neutrons above 20 MeV and protons, the evaporation model GEM [Citation24], the intra-nuclear cascade model INCL [Citation25] ( 3GeV), and the high-energy nuclear reaction model JAM [Citation26] (>3 GeV) were used in the PHITS code. For neutrons below 20 MeV, the JENDL-4.0 data library [Citation27] was used. First, the simulation calculated the angular and energy spectra of the neutrons above 1 MeV produced from the copper target (Ø 8 cm × t 50 cm) injected by the 24 GeV/c proton beam. The secondary neutron currents were then scored on the spherical surfaces divided by cones formed at nine angular ranges, from forward to backward. The simulated results are shown in . Among the results in , the energy spectrum at 70–110° was chosen as the 90° source term for the second-step calculation. The spectral deviation in this angular interval was found to be negligibly small in the calculations in advance.
Figure 6. Simulated angular and energy spectra of neutrons produced from the 50-cm-thick copper target bombarded by 24 GeV/c protons.
Since there is no benchmarking experiment of neutron yield to estimate an uncertainty of the 90° neutrons for 24 GeV/c proton, several references were reviewed. In a reference [Citation28] which benchmarked the PHITS code, although the targets are not copper and proton energy is 1.2 GeV, neutron energy spectra measured at 85° are generally agreed well with the PHITS calculation. On the other hand, neutron energy spectrum at 90° from 60-cm-thick copper target with 120 GeV proton irradiation was measured [Citation29], and C/E was obtained as 0.32 (PHITS code) and 0.47 (FLUKA code [Citation30]) for above 100 MeV neutrons [Citation31]. From this case, it is considered that the PHITS gives more underestimation than the FLUKA, although the proton energy is much higher than 24 GeV/c. Furthermore, total neutron yield at 90° from 5-cm-thick copper target with 40 GeV proton/pion irradiation, which is close to 24 GeV/c energy, was measured and C/E was obtained as 0.65 (FLUKA) [Citation32]. Finally, we concluded that our simulated neutron yield at 90° from the 50-cm-thick copper target by 24 GeV/c proton irradiation is considered to have around 50% uncertainty.
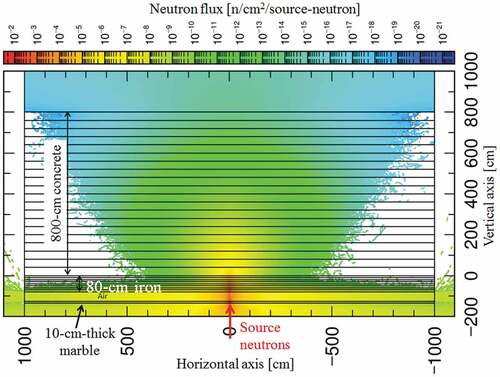
The second-step calculation was performed with high-energy neutrons (>1 MeV) on a simplified geometry of disk-shaped slabs with sufficiently wide radius (1000 cm). To represent the upward-shield structure of the CHARM facility, a 10-cm-thick marble, an 80-cm-thick iron and an 800-cm-thick concrete shields were placed in order from the source position. shows the simulated two-dimensional distribution of the neutron flux in the vertical cross-section of the simplified shield structure. A pencil beam of source neutrons of the 90° energy spectrum was injected into the center of the marble slab. To ensure good neutron statistics in the deep-shield region, a variance-reduction technique (importance method) was applied in the Monte Carlo simulations.
Figure 7. Two-dimensional flux distribution of high-energy neutrons (En >1 MeV) through 10-cm-thick marble, 80-cm-thick iron and 800-cm-thick concrete. 90° neutron sources were produced by bombarding the copper target with 24 GeV/c protons.
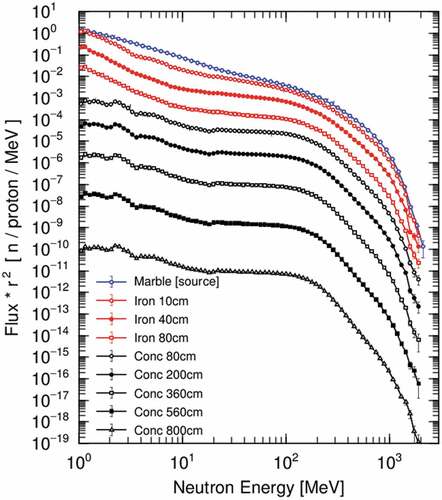
Using surface-crossing estimators at every 40-cm-thick interval in the concrete, all the neutrons crossing the planes of 1000-cm radius were scored and the neutron energy spectra were obtained as shown in . This method was equivalent to the one-dimensional calculation for a plane source. Dividing by square of distances (r2) between the target and the corresponding estimator planes, the absolute values of the energy spectra were finally obtained.
Figure 8. Simulated energy spectra of neutrons at the marble surface and inside the iron and concrete shield. r is the distance between the target and the estimated point.
The radionuclide production rates were estimated by folding (multiplying and integrating) the simulated energy spectra with the cross-section data of 209Bi(n,xn)210-xBi(x = 4–9) and 27Al(n,α)24Na evaluated by Maekawa et al. [Citation33]. The Maekawa library of cross-section data, which was evaluated along with the experimental data [Citation34], is plotted in .
Figure 9. Reaction cross sections evaluated by Maekawa et al. [Citation33].
![Figure 9. Reaction cross sections evaluated by Maekawa et al. [Citation33].](/cms/asset/ced12a40-e68a-4852-b7e9-50ce76ce120b/tnst_a_1751740_f0009_oc.jpg)
The proton-energy dependence of neutron attenuation through the deep shield was estimated in additional simulations. Here, the proton energy was varied from 50 MeV to 50 GeV under the same simulation conditions as above, but removing the marble and iron shields to use the universal slab geometry of concrete. However, the discrepancy in the attenuation lengths due to the marble and iron plates was found to be negligible by the simulation. The target dimensions in the simulations are given in .
Table 4. Proton energies and target dimensions used in the PHITS Monte Carlo simulations.
4. Results and discussion
4.1 Neutron attenuation through the concrete shield
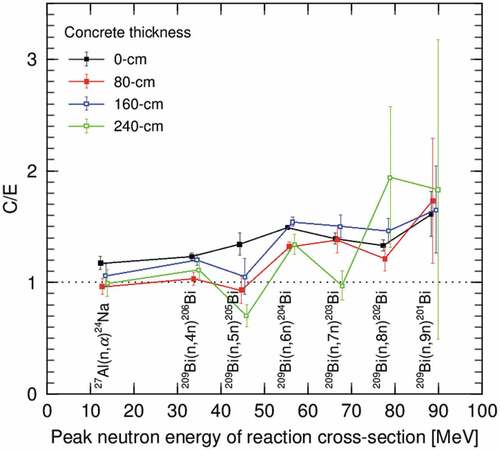
The marks in show the attenuation profiles of the measured radionuclide production rates by neutrons through the concrete shield. The errors are the statistical errors of the gamma-ray counting, but the uncertainties in the Ge-detector efficiency by the LabSOCS (4.3%) [Citation22] and the beam-intensity-monitor calibration (7%) [Citation17] are not included. The production rates decreased exponentially with increasing depth through the concrete. For comparison, the simulation results are also shown in . The simulated attenuation curves and production rates generally agreed with the measured values, especially for 24Na and 206Bi. shows the ratios of the simulated and experimental values (C/Es) versus the peak neutron energy of the reaction cross-section. The simulated and experimental production rates of 24Na and 206Bi agreed within ~20%, and those of 205Bi, 204Bi, and 203Bi agreed within 30–50%. Although the simulated production rates of 202Bi and 201Bi were overestimated, the deviation was within a factor of 2. The C/Es showed an increasing function of neutron energy, and this discrepancy might be attributed to the PHITS simulation or the applied reaction cross-sections. The cause of this discrepancy should be elucidated in the further study.
Figure 10. Comparison of experimental and simulated attenuation profiles of the radionuclide production rates.
Figure 11. Ratios of calculated to experimental production rates (C/E) of radionuclides at different depths of the concrete.
4.2 Attenuation length in concrete
To observe the attenuation profile through the concrete shield without the distance effect, and to estimate the attenuation length, the measured radionuclide-production rates were multiplied by the square of the distance from the target (r). The distance r is the sum of the concrete thickness (variable), the iron thickness (80 cm), and the iron–target distance (240 cm). Finally, from the attenuation curve, the attenuation lengths of all nuclides were obtained by data-fitting of EquationEq. (1)(1)
(1) . The results are plotted in . As the measured radionuclide-production rates had comparatively large statistical errors, the attenuation lengths were dispersed, ranging from 110 to 134 g/cm2. Finally, the experimental attenuation lengths were averaged to obtain 120 g/cm2 with the standard deviation of ±7.0 g/cm2.
Figure 12. Attenuation lengths estimated from the attenuation curves of each measured production rate.
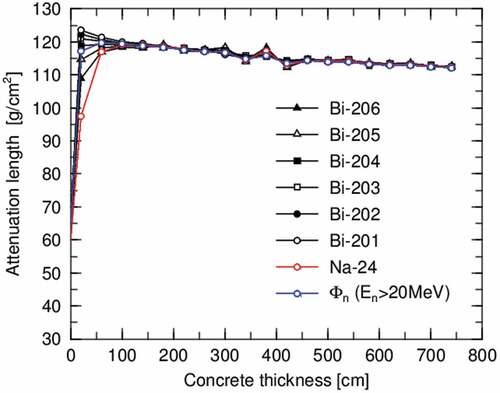
From the attenuation curves of the simulated radionuclide production rates, the attenuation lengths at the corresponding depth of concrete were estimated with the production rates at two points at 40-cm depth intervals. The uncertainty was less than 1% due to the statistical errors in each depth of the simulation. The results were compared for different radionuclides and with those of neutron fluxes above 20 MeV (see ). After penetration depths of 100 cm, all attenuation lengths coincided and gradually decreased from 120 to 112 g/cm2 as the concrete thickness increased from 100 to 700 cm. This indicates that the attenuation lengths beyond 100-cm depth are independent of the threshold energies of reaction because of the spectral equilibrium state in a deep concrete region. Therefore, attenuation length of high-energy neutron flux in a deep concrete region is equivalent to that estimated from the attenuation profiles of radionuclide production rates.
Figure 13. Comparison of simulated attenuation lengths obtained from different radionuclides and neutron fluxes above 20 MeV, estimated in 40-cm intervals of the concrete thicknesses.
4.3 Proton energy dependence of attenuation length
From the above results and the fact that the attenuation of total neutron flux and activation-reaction rate is dominated by the high energy (En>20 MeV) neutron component in the region of spectral equilibrium state [Citation35], this subsection discusses the effect of primary proton energy on the neutron attenuation length considering only the neutron fluxes above 20 MeV. Simulations were performed with the concrete shield only and with a source of 90° (70–110°) neutron production by bombarding the copper targets with protons of various energies (50 MeV to 50 GeV), and the attenuation profiles of the neutron fluxes above 20 MeV were obtained. The attenuation curves steepened with decreasing proton energies (see ). From these attenuation curves, the attenuation lengths of the neutrons were estimated at every 50-cm depth increments as shown in . At proton energies of 100–500 MeV, the attenuation lengths increased with concrete thickness, but at proton energies of 1 GeV or higher, they decreased at deeper regions. This phenomenon can be explained as the following.
Figure 14. Simulated attenuation profiles of neutron fluxes above 20 MeV. 90° neutron sources were produced by bombarding the copper targets with protons of various energies (50 MeV to 50 GeV).
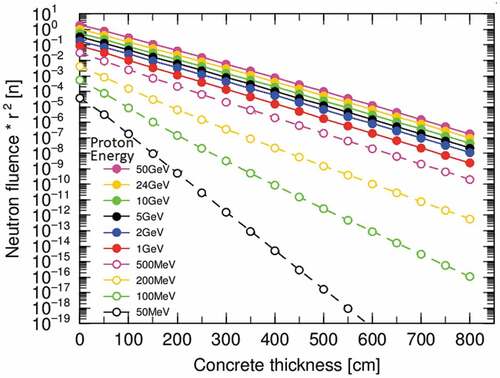
Figure 15. Simulated attenuation lengths of neutron fluxes above 20 MeV estimated in 50-cm intervals of the concrete thickness.
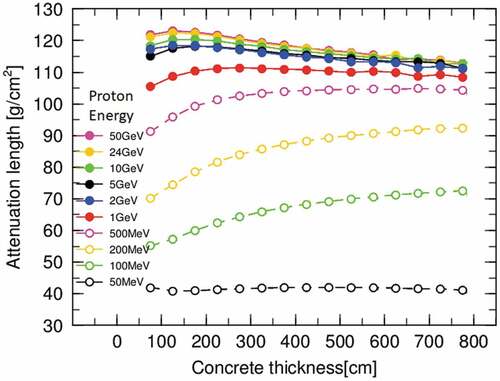
Neutron inelastic scattering cross-section decreases with the energy and becomes nearly constant above 100 MeV. The spectrum equilibrium state is established after the source neutron component below 100 MeV decreases away. At proton energies of 100–500 MeV, since fractions of source neutron component below 100 MeV are more dominant, the attenuation lengths are shorter in the beginning thickness and the neutron spectra need thicker thickness to establish equilibrium state. Contrary to this, high-energy neutrons produced by the protons of energy above 1 GeV make build-up of lower energy neutrons in the shallow regions and dose attenuations are very slow. At proton energy of 50 MeV, it was found that spectrum equilibrium is established in much thinner region.
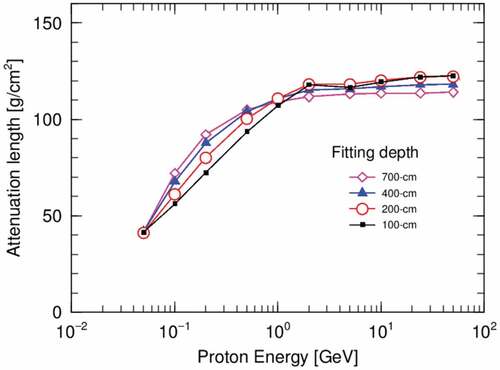
The thus-obtained attenuation lengths of high-energy neutron flux are plotted as a function of proton energy at different concrete depths in . Although the attenuation lengths depended on concrete depth, they were almost constant above 2 GeV.
Figure 16. Simulated attenuation lengths of neutron fluxes above 20 MeV versus primary proton energy at different concrete depths.
compares the obtained attenuation length with previously reported ones [Citation3–Citation5,Citation7,Citation36,Citation37]. Here, the simulated attenuation length for the 200-cm as a fitting-depth is employed in the proton energy above 2 GeV for the comparison because the practical concrete thickness of around 200 ~ 400 cm is considered in the energy region, and also the maximum measured point in the CHARM facility is 240 cm. Below 2 GeV, simulated attenuation length for the 100-cm as a fitting-depth is employed because thinner thickness of around 100 ~ 200 cm is more practical in the lower proton energy.
Figure 17. Comparison of the attenuation lengths versus primary proton energy obtained in the present experiment and in the cited data [Citation3–Citation5,Citation7,Citation36,Citation37]. The PHITS simulation results for 100-cm and 200-cm depths are also shown below and above 2 GeV, respectively.
![Figure 17. Comparison of the attenuation lengths versus primary proton energy obtained in the present experiment and in the cited data [Citation3–Citation5,Citation7,Citation36,Citation37]. The PHITS simulation results for 100-cm and 200-cm depths are also shown below and above 2 GeV, respectively.](/cms/asset/4e006e48-b60e-4a82-82a5-3e05efd90661/tnst_a_1751740_f0017_oc.jpg)
From the figure, the attenuation length obtained in the CHARM experiment agreed very well with the simulation result and with the results of Stevenson et al. [Citation2] which were experimentally obtained at CERN using the 25.5 GeV proton beam for the soil shield. The attenuation lengths estimated by Carter et al. [Citation36], Alsmiller et al. [Citation37] and Ban et al. [Citation5] for 50, 200 and 500 MeV proton energies, respectively, also agreed with the simulated attenuation lengths estimated around 100-cm depth. However, in the experiments with 800 MeV and 12 GeV proton energies by Nunomiya et al. [Citation7] and Ban et al. [Citation4], respectively, the additional concrete shield slabs were used in the experiment to change the thickness. It is considered that the additional shield was not wide enough to form a bulk shield condition, and incoming neutron from the side of the additional shield contributed to increasing the neutron flux at the deeper region. Therefore, longer attenuation lengths might be obtained.
5. Conclusion
The neutron attenuation through a 240-cm-thick concrete shield in the CHARM facility at CERN was measured using bismuth and aluminum activation detectors. The neutrons were generated by a 24 GeV/c proton beam. The radionuclide production rates in the reactions of 209Bi(n,xn)210-xBi(x = 4–9) and 27Al(n,α)24Na were measured at various concrete thicknesses (0, 80, 160 and 240 cm), producing good experimental benchmark data. The results of Monte Carlo simulations with a simple slab geometry reasonably agreed with the measured data (within a factor of 2). The neutron attenuation length was then estimated from the experimental data. The estimate (120 g/cm2) agreed with the PHITS-code simulation result. The neutron attenuation lengths for concrete derived with the PHITS-code simulations were found to gradually increase with proton energy and became almost constant at proton energies above 2 GeV.
This work provides useful benchmark data and simulations of deep shield penetration in a high-energy proton accelerator facility. The results are expected to improve our understanding of shielding design in future high-energy accelerator facilities.
Acknowledgments
The authors are deeply grateful to the accelerator operation staff and the experimental groups at the CHARM for their helpful support in the experiment. They are also grateful to Dr. Nikolas Riggaz and the staff of the gamma-spectrometry lab at CERN for their support in measurements and analyses of data by the germanium detectors. They are also grateful to Dr. Yoshitomo Uwamino of Shimizu Corporation for the useful discussion on the experiment and simulation.
References
- Moyer BJ Proc. 1st Int. Conf. Shielding around High Energy Accelerators, Paris: Presses Universitaires de France; 1962:65.
- Tesch K. A simple estimation of the lateral shielding for proton accelerators in the energy range 50 to 1000 MeV. Radiat Prot Dosimetry. 1985;11(3):165–172. DOI:10.1093/oxfordjournals.rpd.a079462.
- Stevenson GR, Liu KL, Thomas RH. Determination of transverse shielding for proton accelerators using the Moyer model. Health Phys. 1982;43(1):13–29.
- Ban S, Hirayama H, Kondo K, et al. Measurement of transverse attenuation lengths for paraffin, heavy concrete and iron around an external target for 12 GeV protons. Nucl Instr Meth. 1980;174(1–2):271–276. DOI:10.1016/0029-554X(80)90441-3.
- Ban S, Hirayama H, Katoh K. Measurement of secondary neutron fluences around beam stop for 500 MeV protons. Nucl Instr Meth. 1981;184:409–412. DOI:10.1016/0029-554X(81)90739-4.
- Bull JS, Donahue JB, Burman RL. measurement of neutron attenuation through thick shields and comparison with calculation. Proc. 4th workshop on simulating accelerator radiation environments (SARE4), Knoxville. Tennessee. 1998 September;14-16:201–208.
- Nunomiya T, Nakao N, Wright P, et al. Measurement of deep penetration of neutrons produced by 800-MeV proton beam through concrete and iron at ISIS. Nucl Instr Meth. 2001;B179:89–102. DOI:10.1016/S0168-583X(01)00387-1.
- Takada NH, Kasugai H, Meigo Y, et al. J. Research activities on Neutronics under ASTE collaboration at AGS/BNL. J Nucl Sci Technol. 2002;2(Supplement):1155–1160.
- Nakashima H, Mokhov NV, Kasugai Y, et al. Research activities on JASMIN: Japanese and American Study of Muon Interaction and Neutron detection. Proc. 12th International Conference on Radiation Shielding (ICRS-12) and the 17th Topical Meeting of the Radiation Protection and Shielding Division of ANS (RPSD-2012). Prog Nucl Sci Technol. 2014;4:191–196.
- Nakao N, Nakashima H, Nakamura T, et al. Transmission through shields of quasi-monoenergetic neutrons generated by 43- and 68-MeV Protons: part I – concrete shielding experiment and calculation for practical application. Nucl Sci Eng. 1996;124:228–242.
- Nakashima H, Nakao N, Tanaka S, et al. Transmission through shields of quasi-monoenergetic neutrons generated by 43- and 68-MeV Protons: part II – iron Shielding experiment and analysis for investigating calculation methods and cross section data. Nucl Sci Eng. 1996;124:243–257.
- Nakao N, Nakao M, Nakashima H, et al. Measurements and calculations of neutron energy spectra behind polyethylene shields bombarded by 40- and 65-MeV Quasi-Monoenergetic neutron sources. J Nucl Sci Technol. 1997;34(4):348–359.
- Nakao N, Yashima H, Kawai M, et al. Arrangement of high-energy neutron irradiation field and shielding experiment using 4 m concrete at KENS. Proc 10th Int Conf Radiat Shielding (ICRS10). 2005;116(1–4):553–557. Madeira, Portugal, 2004 May 9–14. Radiat. Prot. Dosim.
- Nakao N, Taniguchi S, Roesler S, et al. Measurement and calculation of high-energy neutron spectra behind shielding at the CERF 120 GeV/c hadron beam facility. Nucl. Instr. Meth. 2008;B266:93–106. DOI:10.1016/j.nimb.2007.09.043.
- Froeschl R Radiation protection assessment of the proton irradiation facility and the CHARM facility in the east area, Tech. Rep. CERN-RP-2014-008-REPORTS-TN, EDMS 2014:1355933.
- Froeschl R, Brugger M, Roesler S The CERN high energy accelerator mixed field (CHARM) facility in the CERN PS east experimental area. Proc. of SATIF-12 Batavia, Illinois, United States, 2014 Apr. NEA/NSC/R 2015;3:14–25.
- Iliopoulou E, Bamidis P, Brugger M, et al. Measurements and FLUKA simulations of bismuth and aluminium activation at the CERN Shielding Benchmark Facility (CSBF). Nucl Instr Meth. 2018;A855:79–85. DOI:10.1016/j.nima.2017.12.058.
- Kajimoto T, Sanami T, Nakao N, et al. Neutron energy spectrum measurement using an NE213 scintillator at CHARM. Nucl Instr Meth. 2018;B429:27–33. DOI:10.1016/j.nimb.2018.05.024.
- Kajimoto T, Sanami T, Nakao N, et al. Reproduction of neutron fluence by unfolding method with an NE213 scintillator. Nucl Instr Meth. 2018;A906:141–149. DOI:10.1016/j.nima.2018.07.079.
- Nakao N, Uwamino Y, Tanaka K. Measurement of the neutron angular distribution from a beryllium target bombarded with a 345-MeV/u 238U beam at the RIKEN RI beam factory. Nucl Instr Meth. 2018;B423:27–36.
- Gatignon L. Beam properties for the East area irradiation facility in the T8 beam line. Tech Rep EAT8. 2013; 1270807. EDMS.
- Bronson FL. Validation of the accuracy of the LabSOCS software for mathematical efficiency calibration of Ge detectors for typical laboratory samples. J Radioanal Nucl Chem. 2003;255:137–141.
- Sato T, Iwamoto Y, Hashimoto S, et al. Features of particle and heavy ion transport code system PHITS Version 3.02. J Nucl Sci Technol. 2018;55:684–690. DOI:10.1080/00223131.2017.1419890.
- Furihata S. Statistical analysis of light fragment production from medium energy proton-induced reactions. Nucl Instrum Meth. 2000;B171:251–258.
- Boudard A, Cugnon J, David JC, et al. New potentialities of the Li‘ege intranuclear cascade model for reactions induced by nucleons and light charged particles. Phys Rev. 2013;C87:014606.
- Nara Y, Otuka H, Ohnishi A, et al. Relativistic nuclear collisions at 10A GeV energies from p+Be to Au+Au with the hadronic cascade model. Phys Rev C. 2000;61(2):024901.
- Shibata K, Iwamoto O, Nakagawa T, et al. JENDL-4.0: a new library for nuclear science and engineering. J Nucl Sci Technol. 2011;48:1–30.
- Iwamoto Y, Sato T, Hashimoto S, et al. Benchmark study of the recent version of the PHITS code. J Nucl Sci Technol. 2017;54(5):617–635.
- Sanami T, Iwamoto Y, Kajimoto T, et al. Methodology for the neutron time of flight measurement of 120-GeV proton-induced reactions on a thick copper target. Nucl Instrum Meth. 2012;B274:26–35.
- Ferrari A, Sala PR, Fasso A, et al., FLUKA: a multi-particle transport cod e. CERN-2005-10, INFN/TC-05/11, SLAC-R-773; 2005
- Kajimoto K, Shigyo N, Sanami T, et al. Measurements and parameterization of neutron energy spectra from targets bombarded with 120 GeV protons. Nucl Instrum Meth. 2014;NIMB337:68–77.
- Agosteo S, Birattari C, Dimovasili E, et al. Neutron production from 40 GeV/c mixed proton/pion beam on copper, silver and lead targets in the angular range 30–135°. Nucl Instrum Meth. 2005;B229:24–34.
- Maekawa F, Von Mollendorff U, Wilson PPH, et al. Production of a dosimetry cross section set up to 50 MeV. Proc. 10th International Symposium on Reactor Dosimetry, 1999 Sep. 12–17, Osaka, Japan, American Society for Testing and Materials; 2001:417.
- Kim E, Nakamura T, Konno A, et al. Measurements of neutron spallation cross sections of 12C and 209Bi in the 20- to 150-MeV energy range. Nucl Sci Eng. 1998;129:209–223.
- Nakao N, Lee HS Evaluation and applications of shielding parameters for a heavy-ion accelerator facility. Proc. 10th Shielding Aspects of Target and Irradiation Facility (SATIF-11), Tsukuba, Japan, 11-13 September 2012:153–169.
- Alsmiller RG Jr, Santoro RT, Barish J. Shielding calculations for a 200-MeV proton accelerator and comparisons with experimental data. Part Accel. 1975;7:1–7.
- Carter LL. Bulk shield design for neutron energies below 50 MeV. Nucl Technol. 1983;3:165.