
 ?Mathematical formulae have been encoded as MathML and are displayed in this HTML version using MathJax in order to improve their display. Uncheck the box to turn MathJax off. This feature requires Javascript. Click on a formula to zoom.
ABSTRACT
For a highly enriched uranium subcritical core driven by an inherent or an external Am-Be source in Kyoto University Critical Assembly (KUCA), a series of the source multiplication measurements, the Feynman-α and the Rossi-α neutron correlation analyses was carried out to demonstrate quantitatively that the use of the former inherent source had some advantages over that of the latter external source. Under a reactor drive by the external source, the subcriticality obtained by the neutron source multiplication method (NSM) significantly depended on neutron counter position and was consequently in very poor agreement with that calculated by the continuous-energy Monte Carlo code MVP (version 3) with the nuclear data library JENDL-4.0. In contrast to the above drive, the other drive by the inherent source spectacularly reduced the counter-position dependence and lead to a good agreement with the calculation by the MVP. The prompt-neutron decay constant determined from the Feynman-α analysis under the external source was also significantly dependent on the counter position. The Rossi-α analysis had a relatively slight counter-position dependence of the decay constant to the Feynman-α analysis but had a very low S/N ratio, which indicated an inferior applicability of the Rossi-α analysis to the reactor drive and enlarged a statistical uncertainty of the decay constant. On the other hand, the reactor drive by the inherent source considerably reduced the counter-position dependence of the Feynman-α analysis and spectacularly enhanced the S/N ratio of the Rossi-α analysis. An effective strength of the inherent source could be also determined from the S/N ratio. When the prompt-neutron decay constant obtained under this reactor drive was transformed into each subcriticality by the Simmons and King method, where a subcritical dependence of the generation time and the effective delayed-neutron fraction was neglected, the subcriticality transformed seemed to agree well with that calculated by the MVP. When the decay constant was transformed by the inhour method, where the subcritical dependence of these kinetic parameters was considered, a systematic disagreement between the transformed and the calculated subcriticality appeared.
1. Introduction
A burnup nuclear fuel including transuranium nuclides has an intense inherent neutron source arising from spontaneous fission of these nuclides. A low-enriched no-burnup uranium core also has a weak inherent source originated from spontaneous fission of a large amount of 238 U nuclides. In a nuclear reactor system containing highly enriched uranium and light-metal alloy fuel; however, even the no-burnup core has a measurable inherent neutron source originated from (α, n) reaction of the metal nuclide of the fuel.
Various subcriticality measurements such as the Feynman-α analysis [Citation1] and the neutron source multiplication method [Citation2] have been performed in low-enriched uranium assemblies driven by the inherent sources [Citation3–Citation5]. Recently, an experimental reactor physics study for a highly enriched uranium core driven by the inherent source was reported [Citation6]. In another highly enriched core, an unexpected impact of the inherent source on the pulsed-neutron-source [Citation7,Citation8], the accelerator-beam trip [Citation9], and the rod drop measurements [Citation10] was also revaluated [Citation11]. Each fuel plate of the above two highly enriched uranium cores was made of uranium and aluminum alloy with a cladding, and the inherent source was generated from a considerable number of (α, n) reactions between α particles emitted from radioactive decay of uranium isotopes and aluminum nuclides of base fuel material, but spontaneous fissions of 238 U negligibly contributed to the inherent source. A comparison of reactor physics experiments for a certain reactor between two reactor drives by an inherent source and an external source should be studied to confirm whether the former drive has some advantages or not. The comparative experimental study between the two reactor drives has hardly been reported. Our previous studies [Citation6,Citation11] also were restricted to only the reactor drive by an inherent source and had no report on the source multiplication measurement and the Rossi-α correlation analysis [Citation12]. Moreover, to the best of our knowledge, any experimental attempt to determine the strength of the inherent source has never been found.
The main objectives of this paper are to confirm quantitatively some advantages in being driven by the inherent source for the source multiplication measurement and the neutron correlation analysis. The further objectives are to determine an effective strength of the inherent source experimentally and to examine a transformation of the prompt-neutron decay constant obtained from the correlation analysis into subcritical reactivity. To achieve these goals, a series of the source multiplication measurements, the Feynman-α and the Rossi-α correlation analyses was conducted in a subcritical thermal core of the Kyoto University Critical Assembly (KUCA) [Citation13], where these experiments were carried out under respective reactor drives by an inherent source and by an external Am-Be source. In this paper, the reactor configuration and the experimental setups are presented in Section 2, the discussion of the experimental results in Section 3, and the conclusion of this study in Section 4.
2. Reactor configuration and experimental setups
2.1. Description of KUCA facility
shows a side view of a fuel assembly referred to as 1/8″P60EUEU. Fuel and moderator plates of the assembly were set in a 1.5 mm-thick aluminum sheath and the cross-section of these plates within the assembly was the square of 2″ (50.8 mm). The fuel assembly consisted of 60 unit cells. The unit cell was composed of two (1/16″ thick) uranium plates with Al cladding and one (1/8″ thick) polyethylene plate. Each of the fuel assemblies had 120 sheets of the uranium plates. The active height of the core, namely 60 unit cells, was about 38 cm. Adjacent to the both axial sides of the active region of each fuel assembly, about 57 cm upper and 52 cm lower polyethylene reflectors were attached, respectively. The core configuration employed in this study is shown in . The 26 fuel assemblies were loaded on locations (J-N,10–14) and (I,12) of the grid matrix shown in this figure, to constitute a critical reactor core. The core was surrounded with many polyethylene-reflector assemblies. In the previous experiment [Citation11,Citation14,Citation15], the 25 fuel assemblies had been loaded to constitute the other critical core. In the present experiment, a new polyethylene plate having a somewhat different density from the previous one was used and consequently additional loading of the one fuel assembly was required to achieve the criticality. For the experiment under a reactor drive by an external neutron source, an Am-Be source was inserted on location (K,20). Under another drive by an inherent neutron source, however, no external source was inserted.
Figure 1. Description of 1/8”P60EUEU fuel assembly.
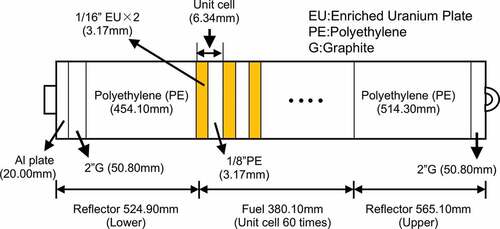
Figure 2. Top view of core configuration and neutron detector location.
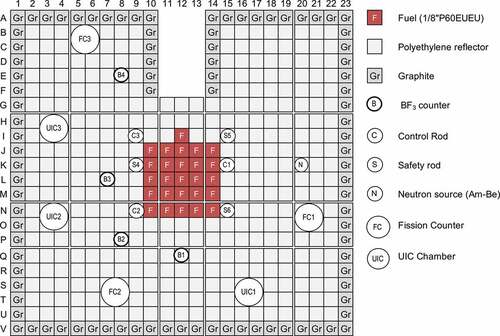
KUCA has six control rods, where three are assigned as safety rods for reactor scram and are referred to as S4 on location (K,9), S5 on (I,15) and S6 on (N,15), respectively. Others are rods for adjustment of reactivity and are referred to as C1 on (K,15), C2 on (N,9), and C3 on (I,9), respectively. The solid-moderated core of KUCA has an emergency shutdown system to prevent any reactivity accidents. Several fuel and reflector assemblies assigned as the central fuel loading are downward withdrawn to shut down urgently the reactor operation. To the central fuel loading withdrawn by the emergency system, we assigned three fuel assemblies on locations (N,11–13) and six polyethylene-reflector ones on locations (O-P,11–13) of the grid matrix. The detailed description of the central fuel loading was given by Sakon et al. [Citation16]. The subcritical reactivity for the present experiment was adjusted by changing the axial position of the central fuel loading, as well as the positions of safety and control rods. These subcritical and critical patterns employed in the present experiments are shown in , where these respective subcriticalities calculated by the continuous-energy Monte Carlo code MVP version 3 (MVP3) [Citation17] with the nuclear data library JENDL-4.0 [Citation18] are also included. For each of these patterns, 30,000 history × 1,000 batch were taken for the eigenvalue calculation. Validation of the second version [Citation19] of the MVP code with JENDL-4.0 was demonstrated in a KUCA subcritical core extremely similar to the present system [Citation11]. The latest MVP3 makes it possible to calculate reactor kinetics parameters.
Table 1. Experimental patterns of control rods and central fuel loading.
2.2. Nuclear instrumentation system and experimental conditions
In KUCA, three fission counters (FC1~ FC3) were employed as a reactor startup channel and three uncompensated ionization chambers (UIC1~ UIC3) were assigned as linear power, logarithmic power and safety power channel, respectively. In addition to the above neutron detectors for reactor operation, four BF3 proportional neutron counters (LND-202101, 1″ dia., 15.47″ len.) were used for the present experiment. These BF3 counters on locations (Q,12), (P,8), (L,7), and (E,8) are referred to as B1, B2, B3, and B4, respectively. The present nuclear instrumentation system consisted of conventional detector bias-supply, pre-amplifier, spectroscopy amplifier, and discriminator modules. Finally, signal pulses from these BF3 neutron counters were fed to a time-sequence data acquisition system, which registered the arriving time of the signal as digital data. The time length of the acquired data for each subcritical pattern was about 30 min.
2.3. Neutron source inherent in nuclear fuels
A uranium fuel plate of KUCA is made of a 93%-enriched uranium and aluminum alloy plate with an aluminum cladding. The composition ratio of uranium isotopes is shown in . As the mass of each uranium isotope, not nominal value available to the public [Citation20,Citation21] but actual value reported by a fuel fabrication facility was employed to estimate an inherent source strength accurately. Atomic number densities of all nuclides input into MVP3 code were also calculated based on the fabrication data. It should be noted that the fuel contains a considerable amount of 234 U, which has a much shorter half-life than those of the other isotopes. The isotopic properties of uranium used in the present study are also given in this table. The spontaneous fission rate was estimated using a spontaneous fission fraction per α-decay of each isotope [Citation22]. As a number of neutrons emitted from the spontaneous fission of each isotope, we employed an average number given by Ensslin [Citation23]. The (α, n) reaction rate of 27Al was estimated using a neutron yield for an energy of α particle released from radioactive decay of each isotope. Bair et al. [Citation24] gave the measured neutron yield in an α-energy range from 3 to 9 MeV at 0.5 MeV intervals and thus the present yield for a specified release energy was interpolated from their data. Some daughters may result from radioactive decay of each uranium isotope in the fuel plate fabricated but the contribution of the daughters to neutron source is negligible.
Table 2. Isotopic properties of uranium used in the present calculation.
shows the inherent neutron source strength per enriched fuel plate in every isotope and reaction. It was surprising to us that the inherent neutron source was dominantly generated from (α, n) reaction of 27Al induced by α-particle released from 234 U. The natural abundance of 234 U is 0.0054% but any enrichment operation artificially enhances not only the abundance of 235 U but also that of 234 U. Shiozawa et al. [Citation4] also calculated the inherent source strength of the enriched uranium plate to obtain 8.88 × 10⁻² [n/s/plate]. If their strength was not wrong, the inherent source might be never available to any subcritical experiments. shows the total inherent source strength of the present core, which compares with the measured inherent source strength in the following Subsection 3.5.
Table 3. Inherent neutron source strength per enriched fuel plate [n/s/plate].
Table 4. Total inherent neutron source strength of the present core.
In a previous study [Citation6], no contribution of 234 U to inherent neutron source was considered. Further, as neutron yield from (α, n) reaction per α particle emitted by 235 U decay, a large yield for the 235 U decay series in secular equilibrium was mistakenly employed. The contribution of 234 U should be considered and the mistake in the neutron yield must be corrected.
3. Results and discussion
3.1. Neutron source multiplication measurement
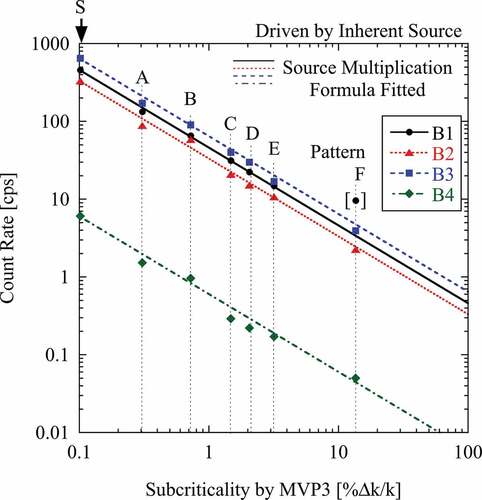
The count rate of each BF3 neutron counter was measured in respective subcritical states driven only by the inherent source. shows a dependence of the count rate originated from the inherent source on the subcriticality calculated by the MVP3 code. The average count rate was derived from integral neutron counts measured over 30 min and consequently statistical error of the count rate was considered to be negligible. A least-squares fit of the following source multiplication formula to the count rate R of each neutron counter was done:
Figure 3. Subcriticality dependence of neutron count rate measured for subcritical systems driven by inherent source.
where
An effective strength of a neutron source and a subcriticality of a reactor system are represented by S and -ρ, respectively. Here we define ε, λf , and
as detection efficiency, fission probability of a neutron per unit time, average number of neutrons emitted by a fission, and neutron generation time, respectively. EquationEquation (2)
(2)
(2) is arranged using
. In the above equations, it is assumed that the one-point approximation holds and a detection efficiency ε of neutron counter remains unchanged with a change in the subcriticality. The fitted formula is also included in . As can be seen from this figure, the count rate follows the above formula and consequently the one-point model is successful in the present subcritical range, except for only counter B1 in a particular subcritical pattern F (the data enclosed in brackets). The count rate of counter B1 in the pattern F is much higher relative to the fitted formula. This is because a large vacancy appears between counter B1 and fuel region with the withdrawal of the central fuel loading on locations (N-P,11–13), as seen in . The appearance reduces neutronic shielding effect and results in an increase in a number of neutrons arriving at B1. This local effect specific to B1 is responsible for the much higher count rate observed above.
In the above respective subcritical patterns with an Am-Be sources, once more, count rate of each BF3 neutron counter was measured. shows another dependence of the count rate on the calculated subcriticality, where the fitted curve of each neutron counter is also included. As can be seen from this figure, the count rate tends to move away from the fitted curve with an increase in the subcriticality and hence the assumption of the one-point model is poor, compared with the previous reactor derive by the inherent source. In the pattern F, not only the count rate of counter B1 but also that of counter B4 move much away from the fitted curve.
Figure 4. Subcriticality dependence of neutron count rate measured for subcritical systems driven by Am-Be source.
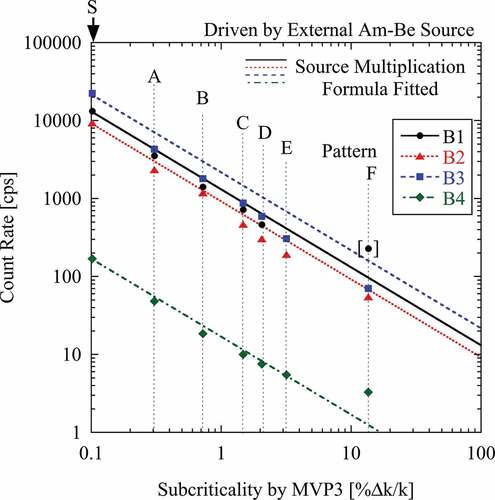
The inherent source is uniformly distributed in uranium fuels of reactor core and the uniform distribution of the source excites dominantly a fundamental spatial mode of the reactor system. The dominant excitation of the fundamental mode reduces the spatial effect of higher modes. At a deeply subcritical state, however, any external neutron source placed outside the core must significantly excite the spatial higher modes and consequently the one-point model falls into failure. The previous neutron source multiplication measurement gave an apparent spatial dependence of the subcriticality on external source position [Citation25]. The reactor drive by the inherent source must be more advantageous for neutron source multiplication method than any drive by an external source.
The neutron source multiplication (NSM) method is a simple subcriticality measurement technique based on the neutron multiplication in a subcritical state [Citation26]. Assuming the one-point approximation, count rates of respective neutron counters are inversely proportional to the subcriticality, and proportional to the strength of a neutron source, as can be seen from EquationEquation (1)(1)
(1) . Suppose that subcriticality (-ρ)ref of a reference subcritical system is known in advance, and both respective count rates Rref and R of the reference system and a different subcritical system are measurable by a specified neutron counter with unchanged detection efficiency. The NSM method gives an unknown subcriticality (-ρ) of the above different systems from the reference as follows:
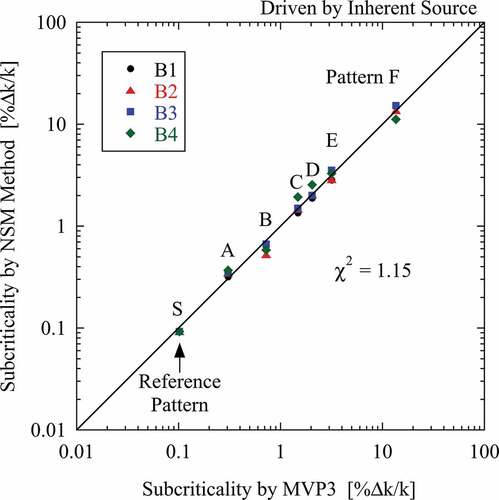
In this study, a certain subcritical system with the pattern S was employed as a reference system. Prior to the NSM analysis, a source jerk experiment was carried out in the subcritical system and the subcriticality 0.0923 ± 0.0025 [%Δk/k] was determined by using the least-squares inverse kinetics method (LSIKM) [Citation11,Citation16,Citation27–Citation29]. Substituting the reference subcriticality and the count rates shown in and into the above equation, an unknown subcriticality of a subcritical pattern other than S was determined for each counter. shows the subcriticality obtained by the NSM method for each subcritical system driven by the inherent source, compared with the subcriticality calculated by the MVP3, where the peculiar data of counter B1 in the pattern F are removed. As expected from the above observation in , the measured subcriticality agrees well with the calculated one. The chi-square value (1.15) of the measured subcriticality (observed value) to the calculated one (expected value) is also included in this figure. The chi-square is followed by the conventional definition used in the chi-square test.
Figure 5. Subcriticality obtained by neutron source multiplication method for subcritical systems driven by inherent source.
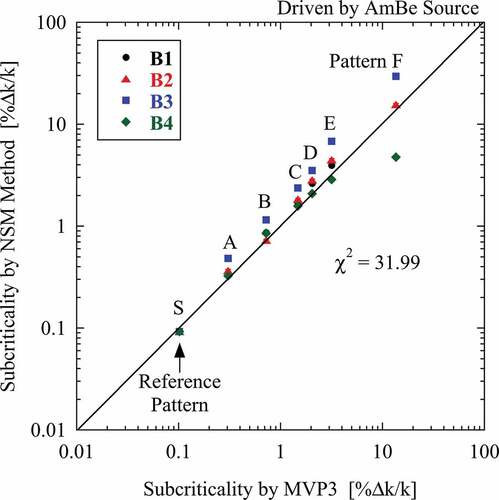
shows the subcriticality obtained by the NSM method for each subcritical system driven by the Am-Be source, compared with the calculated subcriticality. The measured subcriticality is in poor agreement with the calculated one. The chi-square value (31.99) of the measured subcriticality to the calculated one, as included in this figure, is much larger than that (1.15) of the other drive by the inherent source. Especially, the counter B3 has a very poor agreement. The counter is placed on the opposite side of the Am-Be source in between the core and consequently is considered to have a significant influence of an azimuthal higher harmonics most highly excited by the external source.
Figure 6. Subcriticality obtained by neutron source multiplication method for subcritical systems driven by Am-Be source.
3.2. Feynman-α neutron correlation analysis
Time-sequence counts data within a time interval (gate time) of 1 ms were generated from the arriving time data registered, and then the count data within longer intervals were synthesized by the moving–bunching technique [Citation30] to calculate a gate-time dependence of the Y defined as variance-to-mean ratio minus 1 of the counts data. The moving–bunching technique was used in place of the conventional bunching technique [Citation31] to reduce a statistical scatter of the Y. shows a gate-time T and subcritical-pattern dependences of the Y obtained by the Feynman-α analysis under reactor drive by the inherent source, where neutron counter is B1. The amplitude of the Y increases with a decrease in the subcriticality and the saturation of the amplitude requires a longer gate-time range with the decrease. We carried out a least-squares fit of the following formula to the Y data:
Figure 7. Subcriticality dependence of Y obtained by Feynman-α analysis under reactor drive by inherent source.
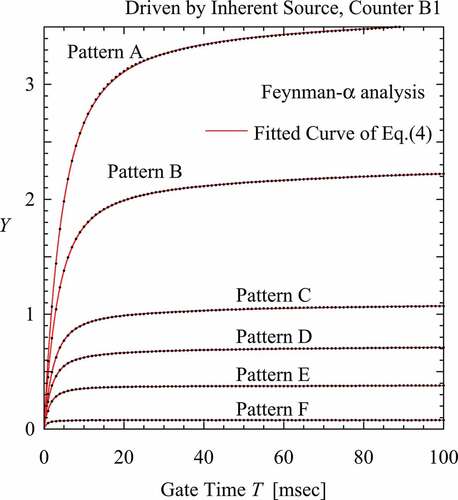
The above formula is based on the one-point and zero-power kinetics model. The first term is a correlated component originating from the multiplicity of fission neutrons, where Y∞ is a saturation amplitude of the Y and α is the prompt-neutron decay constant. The second term C2 is a negative constant to correct the dead-time effect of neutron counter [Citation32]. The last term was introduced to consider a delayed-neutron contribution to the Y [Citation33] and C3 was a positive constant related to the contribution. The fitted curves are included in , where these curves are in very good agreement with the Y data and the correlation coefficients of these fitting are over 0.999.
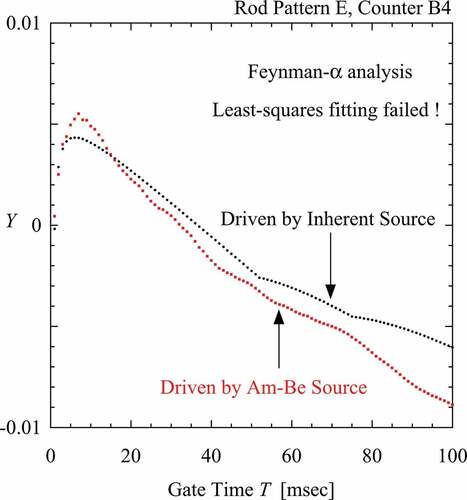
The result obtained from neutron counters B2 and B3 was similar to the above observation from counter B1. From counter B4 placed far from core, however, quite different behaviors could be observed. shows a non-physical behavior observed in the Y of counter B4. Regardless of different reactor drives by inherent source or external Am-Be source, the Y has a monotonous decreasing trend and the trend leads to fatal failure of the fitting of EquationEquation (4)(4)
(4) . When a neutron counter has a very low efficiency for fission neutrons, this kind of pseudo trend originates from any bunching techniques [Citation34]. As a result, the counter B4 could not be employed for the present Feynman-α analysis.
Figure 8. Non-physical behavior of correlation amplitude Y of counter B4.
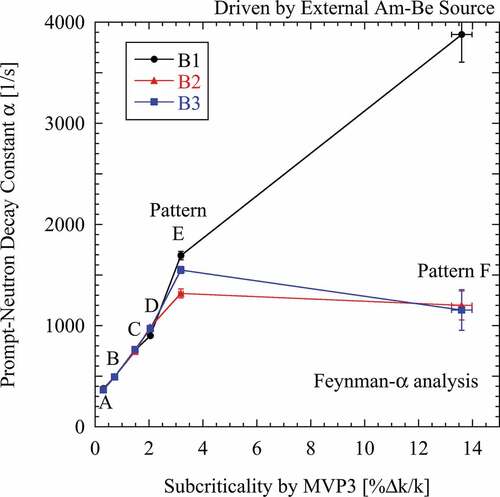
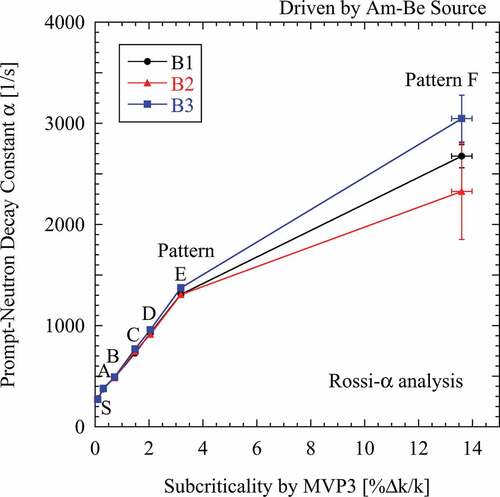
shows the prompt-neutron decay constant obtained from the Feynman-α analysis under a reactor drive by the inherent source, where the error bar of the decay constant represents statistical error derived from a nonlinear least-squares method and that of the subcriticality indicates statistical uncertainty ±1σ of the MVP calculation. The decay constants of three counters agree with each other within the statistical error range of the least-squares fitting. In the subcritical range from pattern S to E, a linear relation between the decay constant and the calculated subcriticality can be observed. Under deeply subcritical state such as pattern F, however, this relationship undoubtedly breaks. Further discussion about this break is described in Subsection 3.4. shows the prompt-neutron decay constant obtained from the Feynman-α analysis under another drive by the Am-Be source. Unlike the above drive by the inherent source, here, a significant counter-position dependence of the decay constant appears with an increase in the subcriticality. This dependence corresponds to the spatial dependence observed in the source multiplication measurement. The reactor drive by the inherent source is also advantageous for the Feynman-α analysis over that by the external Am-Be source.
Figure 9. Prompt-neutron decay constant obtained from Feynman-α analysis for subcritical systems driven by inherent source.
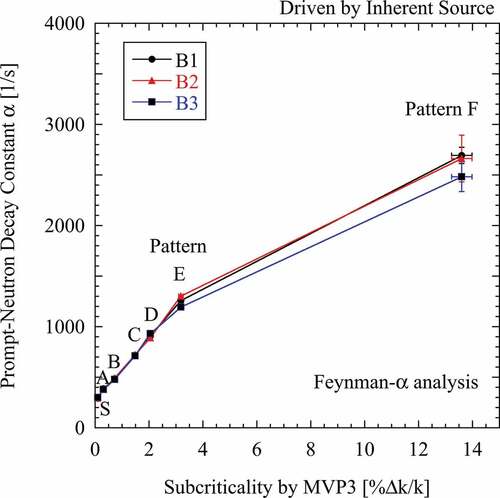
Figure 10. Prompt-neutron decay constant obtained from Feynman-α analysis for subcritical systems driven by Am-Be source.
3.3. Rossi-α neutron correlation analysis
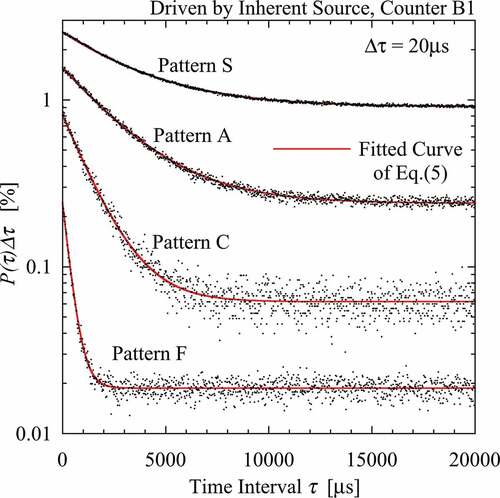
shows a time-interval τ and subcritical-pattern dependences of a conditional counting probability P(τ)Δτ obtained by the Rossi-α analysis under a reactor dive by the inherent source, where neutron counter is B1 and Δτ is 20μs. The conditional counting probability is a probability that, given a neutron count at a time, there is a subsequent count in Δτ around time τ later. We carried out a least-squares fit of the following formula [Citation35] to the P(τ)Δτ data:
Figure 11. Subcriticality dependence of conditional counting probability obtained by Rossi-α analysis under reactor drive by inherent source.
where
The above formula is also based on the one-point and zero-power kinetics model. The first term of EquationEquation (5)(5)
(5) is a correlated component originating from the multiplicity of fission neutrons and the second uncorrelated term C5 is a positive constant determined by the average count rate R. The fitted curves are also included in , where these curves are in very good agreement with the P(τ)Δτ data and the correlation coefficients of the fitting are over 0.99. As can be seen from this figure, the correlated component more slowly attenuates with a decrease in the subcriticality and the uncorrelated component increases with the decrease.
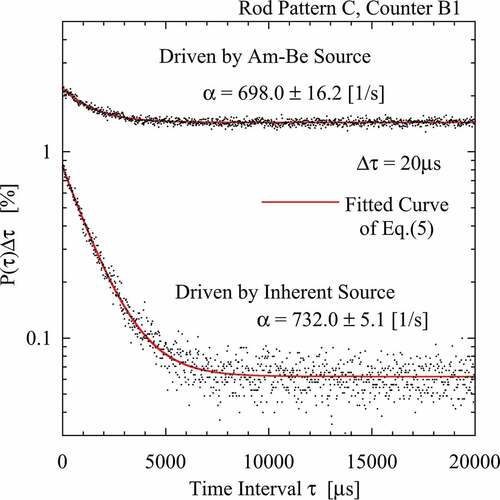
shows a comparison of the conditional counting probability between different reactor drives by the inherent and the Am-Be sources, where neutron counter is B1 and subcritical rod pattern is C. Comparing between the two drives, the correlated component has the same amplitude. However, the Am-Be source more enhances the uncorrelated component than the inherent source. Under the reactor drive by the Am-Be source, consequently, the correlated component buries in the uncorrelated component in the longer time-interval range and the statistical uncertainty of the fitting increases. If the Am-Be source was placed more closely to the core or a stronger external source was used, the correlated component must completely have varied in the uncorrelated component and the Rossi-α analysis would necessarily result in failure. In Subsection 3.5, the further quantitative discussion is done using the S/N ratio of the Rossi-α analysis.
Figure 12. Comparison of Rossi-α conditional counting probability under respective drives by inherent and Am-Be source.
shows the prompt-neutron decay constant obtained from the Rossi-α analysis under a reactor drive by the inherent source. Except for subcritical pattern F, the decay constants of three counters well agree with each other within the statistical error range of the least-squares fitting. In subcritical pattern F, however, a counter-position dependence of the decay constant can be observed. shows the prompt-neutron decay constant obtained from the Rossi-α analysis under another drive by the Am-Be source. The counter-position dependence of the decay constant can be observed already in subcritical pattern C and is larger than that under reactor drive by the inherent source. However, the Rossi-α analysis has a relatively small dependence on the Feynman-α analysis, as can be seen from a comparison between and .
Figure 13. Prompt-neutron decay constant obtained by Rossi-α analysis under reactor drive by inherent source.
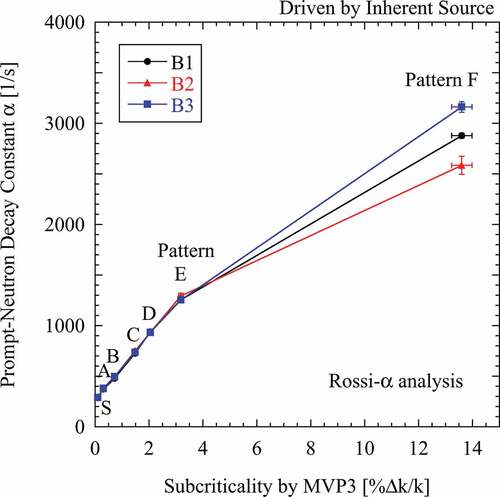
Figure 14. Prompt-neutron decay constant obtained by Rossi-α analysis under reactor drive by Am-Be source.
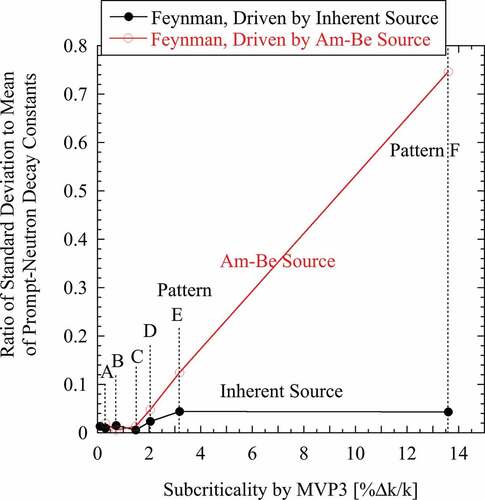
As an indication of the counter-position dependence of the prompt-neutron decay constant, we employ the ratio of standard deviation to mean of the decay constants obtained from three neutron counters B1, B2 and B3. shows the ratio of standard deviation to mean obtained by the Feynman-α analysis under the respective reactor drives by the inherent and the Am-Be source. In the slightly subcritical range from patterns A to C, both of the respective reactor drives hold the ratio small, that is, a slight spatial dependence. In the deeply subcritical range from pattern D to F, however, the reactor driven by the Am-Be source monotonically increases the ratio with an increase in the subcriticality. The increasing ratio indicates that the external source significantly enhances the spatial dependence. The reactor driven by the inherent source holds the ratio much smaller than that driven by the Am-Be source. From the above, the reactor drive by the inherent source is advantageous for reducing the spatial dependence of Feynman-α analysis.
Figure 15. Ratio of standard deviation to mean of prompt-neutron decay constants obtained by Feynman-α analysis for three neutron counters.
3.4. Derivation of subcriticality from prompt-neutron decay constant
In the era from the 1950s to the 1960s, many techniques for determining the subcriticality -ρ from the prompt-neutron decay constant α had been developed to interpret and analyze pulsed-neutron-source experiment. Assuming the one-point model, the decay constant can be described as:
where βeff and ᴧ are the effective delayed-neutron fraction and the generation time, respectively. The above equation can be rewritten as follows:
where
When the prompt-neutron decay constant αc at critical state is measured in advance, the Simmons and King method [Citation36] determines the subcriticality (in dollar unit) from the decay constant based on EquationEquation (8)(8)
(8) . Instead of measuring αc, recently, the two kinetic parameters βeff and ᴧ at critical state are frequently calculated to obtain the subcriticality in Δk/k unit. It should be noted that no subcriticality dependence of these kinetics parameters is assumed in this method. This assumption leads to a linear relationship between the decay constant and the subcriticality.
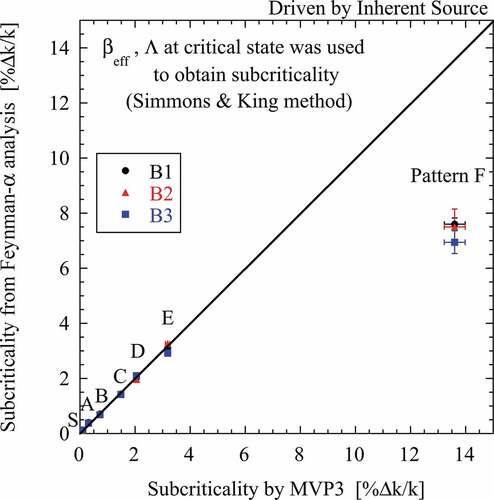
shows the subcriticality derived from the prompt-neutron decay constant based on the above method, where the decay constant is obtained by the Feynman-α analysis under reactor drive by the inherent source. The kinetic parameters at the critical state were calculated by the MVP3 code. Except for subcritical pattern F, the subcriticality derived from the decay constant apparently agrees well with that calculated by the MVP3 code. At only the pattern F, the subcriticality derived is significantly underestimated, compared with that calculated by the MVP3. This underestimation of the subcriticality at deeply subcritical states has been frequently reported and it has always been explained that no consideration of the subcriticality dependence of the kinetics parameters is responsible for the underestimation [Citation4,Citation37–Citation39].
Figure 16. Subcriticality derived from prompt-neutron decay constant by using Simmons & King method.
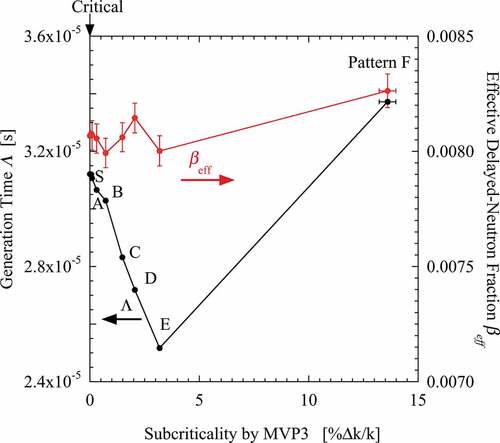
Here we examine the subcriticality dependence of these parameters. shows a subcriticality dependence of the parameters βeff and ᴧ with statistical uncertainty ±1σ calculated by the MVP3 code. The effective delayed-neutron fraction has a slight subcritical dependence, while the generation time significantly depends on the subcriticality. In subcritical-pattern range from S to E, as shown in , control and safety rods are successively inserted and the successive insertion hardens neutron energy spectrum. The absorption hardening shortens the generation time. In subcritical pattern F, however, a large vacancy appears closely to fuel region with the withdrawal of the central fuel loading and the appearance softens the spectrum. The diffusion cooling lengthens the generation time. This significant dependence of the generation time on the subcriticality should be considered to determine accurately the subcriticality.
Figure 17. Subcriticality dependence of kinetic parameters calculated by MVP3.
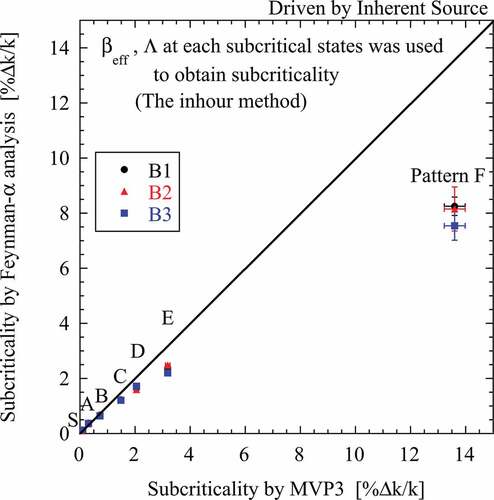
The technique considering the subcritical dependence of the generation time, referred to as the inhour method, has been very rarely employed to determine the subcriticality from the decay constant measured in pulsed-neutron-source experiments [Citation38,Citation39]. This is because the generation time has been hard to calculate accurately. Nowadays some continuous-energy Monte Carlo codes realize the accurate calculation but the inhour method has been forgotten for a long time. shows the subcriticality derived from the decay constant, based on EquationEquation (7)(7)
(7) , where the subcritical-pattern dependence of the kinetic parameters is considered. Here this technique is also referred to as the inhour method. Only the difference between the inhour method and the Simmons & King method is whether the subcritical dependence of the kinetic parameters included in EquationEquation (7)
(7)
(7) is considered or not. Compared with , the inhour method apparently reduces the consistency with the calculated subcriticality. A validation of the MVP code with JENDL-4.0 was demonstrated in several subcriticality measurements at a KUCA subcritical core similar to the present system [Citation11,Citation16]. Therefore, the present data analysis can be considered to be responsible for the above systematic disagreement. The inhour method is based on the inhour approximation, where the kinetic flux and the corresponding adjoint flux are assumed to have the same spatial shapes as the static flux and the corresponding adjoint flux, respectively. We are convinced that the disagreement must originate from ‘kinetic distortion’ [Citation40–Citation42].
Figure 18. Subcriticality obtained from prompt-neutron decay constant by using the inhour method.
The neutron correlation and the reactor noise analyses have suffered from the following three influences:
Influence of spatial higher modes on the prompt-neutron decay constant measured,
Subcritical dependence of the generation time in determining the subcriticality,
Kinetic distortion.
In this study, the above first troublesome influence could be significantly reduced by the reactor drive by the inherent source. The subcritical dependence of the generation time could be also considered by the accurate continuous-energy Monte Carlo calculation. Only the problem of the kinetic distortion is left. The apparent agreement shown in is just because an influence of the subcritical dependence of the generation time accidentally cancels out that of the kinetic distortion. The previous study of the kinetic distortion has been confined to the theoretical interpretation [Citation38–Citation40] and any experimental data such as have hardly been reported.
In reactor kinetics experiments such as pulsed-neutron-source experiment, some influences of a non-negligible difference between the static and the kinetic prompt-neutron fluxes have been referred to as the kinetic distortion. The static flux (eigenfunction) ɸ is defined by the following fictitious static (λ)-mode eigenvalue problem:
where L and M represent neutron destruction and production operators, respectively. The eigenvalue λ represents effective multiplication factor. Except for a critical state, the eigenvalue problem is fictitious, where the eigenvalue is adjusted to satisfy the above equation. On the other hand, the kinetic prompt-neutron flux φ is defined by the following kinetic (α or ωp)-mode eigenvalue problem:
or
The velocity of neutron having kinetic energy E is represented by V(E). This eigenvalue problem is derived from a physical approach and is not fictitious, where the eigenvalue α represents the prompt-neutron decay constant measurable directly in various kinetics experiments. The left-hand side of EquationEquation (12)(12)
(12) has a negative 1/V poison term. When a reactor system has a large subcritical reactivity, i.e. a large α, the thermal (small velocity V) neutron flux
rises in a reflector region which has relatively small absorption cross-section. Physically speaking, this rise describes an accumulation of prompt neutrons diffused from core to reflector. As can be seen from EquationEquation (10)
(10)
(10) , however, the eigenvalue λ fictitiously modifies only the neutron production (fission) operator of core and the modification never raises the static flux ɸ in reflector region. Consequently, the kinetic prompt flux has a distorted distribution relative to the static flux. Since a neutron counter sensitive to thermal neutrons is usually placed in a reflector region, the kinetic distortion appears significantly. The reactivities of vertical and horizontal axes in may be referred to as the kinetic reactivity and the static reactivity, respectively. The kinetic distortion makes a considerable difference between the two reactivities. Even today it is considered to be difficult to overcome the kinetic distortion, because not only the kinetic prompt fundamental and higher modes not only the corresponding adjoint modes must be accurately calculated to determine the static reactivity from the prompt-neutron decay constant measured experimentally [Citation40]. In unreflected thermal reactor and fast reactor systems, however, the kinetic distortion has been scarcely observed [Citation39,Citation43].
3.5. Derivation of inherent source strength from Rossi-α analysis
The ratio of C4 to C5 in EquationEquation (5)(5)
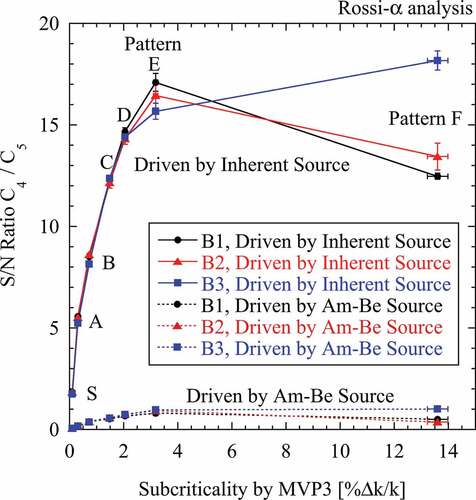
(5) has been frequently referred to as the S/N ratio of the Rossi-α technique [Citation44]. The S/N ratio indicates an applicability of the Rossi-α technique to a subcritical system and the higher ratio is favorable for the accurate analysis. When the S/N ratio is much lower than 1, the Rossi-α technique is inapplicable to the system. shows the S/N ratio obtained from fitting EquationEquation (5)
(5)
(5) , under the respective reactor drives by the inherent and the Am-Be source. The S/N ratio tends to increase with an increase in the subcriticality and consequently the Rossi-α technique seems to become advantageous with the increase. Conversely, we can say that the Rossi-α technique is inapplicable to a nearly critical state or a higher power condition. The Rossi-α and the Feynman-α techniques mutually complement each other. Comparing between the respective reactor drives by the inherent and the Am-Be source, as shown also in , the former drive has a much higher S/N ratio than the latter drive and this feature indicates a further advantage of the former reactor drive.
Figure 19. S/N ratio of Rossi-α analysis under respective reactor drives by inherent and Am-Be sources.
Next, we derive an effective strength of the inherence source from the S/N ratio. Using EquationEquation (6)(6)
(6) and
, the ratio can be written as follows:
The S/N ratio and the prompt-neutron decay constant α included in the above equation were already determined by this experimental study. As the first and second factorial moments of multiplicity distribution of neutrons emitted by a fission, we used the data recommended by Holden and Zucker [Citation45]. Employing the subcriticality (-ρ) and the generation time ᴧ calculated by the MVP3 code, we could evaluate an effective inherent source strength S. Since EquationEquation (13)
(13)
(13) is based on the one-point kinetics model, the source strength is not a neutron emission rate from fuels but just an effective characteristic value of the kinetics model.
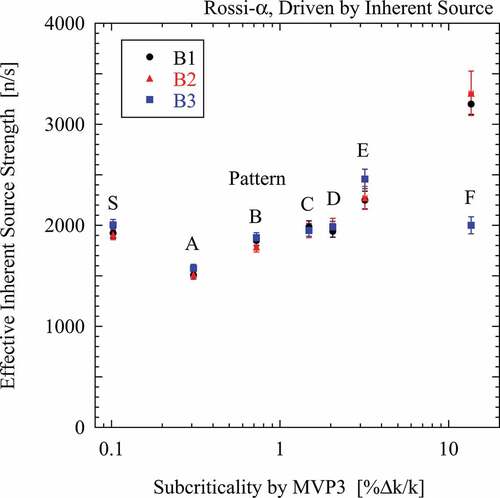
shows the effective strength of the inherent neutron source evaluated by the manner mentioned above. In the subcritical-pattern range from A to E, the effective strength is around 2000 n/s with a dispersion and is roughly a half of the total inherent source strength given in . In the subcritical pattern F, a significant counter-position dependence of the effective strength can be observed. A withdrawal of the central fuel loading highly excites a spatially higher mode and the excitation is responsible for the above counter-position dependence. It should be noted that the evaluated effective strength is not an actual neutron emission rate. A spatial correction factor of fission source [Citation46] and an importance ratio of fission neutron to source neutron emitted from fuels [Citation47] should be accurately considered to evaluate the neutron emission rate. Further, an influence of some higher modes probably should be considered. These accurate evaluations are beyond the scope of this study.
Figure 20. Effective inherent source strength derived from Rossi-α analysis.
4. Concluding remarks
A highly enriched uranium and aluminum alloy plate of KUCA had a considerable source strength inherent in the fuel plate. The inherent neutron source was dominantly generated from (α, n) reaction of 27Al induced by α-particle released from 234U. For a highly enriched uranium subcritical core driven by an inherent or an external Am-Be source in KUCA, a series of the source multiplication measurements, the Feynman-α and the Rossi-α neutron correlation analyses was carried out to demonstrate quantitatively that the use of the former inherent source had some advantages over that of the latter external source.
Under a reactor drive by the inherent source, a preferable applicability of the one-point source multiplication formula to count rates of several neutron counters could be confirmed over a wide subcritical range and the subcriticality obtained by the neutron source multiplication method (NSM) was in good agreement with that calculated by the MVP3 code with the nuclear data library JENDL-4.0. Under another drive by the external source, however, a significant deviation of the count rates from the one-point formula could be observed and the subcriticality obtained by the NSM was in poor agreement with that by the calculation. A spatially localized external source significantly excites many higher modes at a subcritical state and consequently the NSM suffers from spatial dependence of the subcriticality obtained. The reactor drive by the spatially uniform inherent source is advantageous to the NSM.
Under a reactor drive by the external source, the prompt-neutron decay constant obtained from the Feynman-α analysis was significantly dependent on counter position. Under another drive by the inherent source, however, the counter-position dependence was considerably reduced. On the other hand, the Rossi-α analysis under the Am-Be source had a relatively slight counter-position dependence on Feynman-α analysis but had a very low S/N ratio. The reactor drive by the inherent source significantly enhanced the S/N ratio of the Rossi-α. In KUCA, obviously, the reactor drive by the inherent source is advantageous to both the Feynman-α and the Rossi-α analyses.
When the above prompt-neutron decay constant was transformed into a subcriticality by the Simmons and King method, except for a most-deeply subcritical state, the subcriticality transformed apparently agrees well with that calculated by the MVP3 code. When the decay constant was transformed by the inhour method, where a subcritical dependence of the generation time and the effective delayed-neutron fraction was considered, a systematic disagreement between the transformed and calculated subcriticality appeared. The disagreement must originate from the kinetic distortion, which had been heatedly discussed to analyze pulsed-neutron-source experiment in the 1960s. This subject has been now forgotten but should be solved to determine the static subcriticality from various kinetic experiments including the Feynman-α and the Rossi-α analyses.
The effective strength of the present inherent neutron source derived from the S/N ratio of the Rossi-α analysis was around 2000 n/s and was roughly a half of a multiplication of an inherent source strength per the fuel plate by the number of the plates. It should be noted that the latter multiplication is not an effective value based on the one-point model but an intensity as a radiation source.
Acknowledgments
The present work was performed as a joint research program of the KUCA at the Institute for Integrated Radiation and Nuclear Science, Kyoto University.
Disclosure statement
No potential conflict of interest was reported by the authors.
References
- Feynman RP, De Hoffmann F, Serber R. Dispersion of the neutron emission in U-235 fission. J Nucl Energy. 1956;3:64–69.
- Goodman CD. The science and engineering of nuclear power. Vol. I. Boston: Addison- Wesley; 1947.
- Tonoike K, Yamamoto T, Watanabe S, et al. Real time α value measurement with Feynman-α method utilizing time series data acquisition on low enriched uranium system. J Nucl Sci Technol. 2004;41:177–182.
- Shiozawa T, Endo T, Yamamoto A, et al. Investigation on subcriticality measurement using inherent neutron source in nuclear fuel. In: Suyama K, Sugawara T, Tada K, et al., editors. Proceedings of the international conference on physics of reactors (PHYSOR 2014); 2014 September 28-October 3; Kyoto, Japan. Tokai-mura (JAPAN): Japan Atomic Energy Agency; 2015. (JAEA-Conf-2014-003 and 2014-003-appendix). DOI:10.11484/jaea-conf-2014-003.
- Endo T, Yamamoto A, Yagi T, et al. Statistical error estimation of the Feynman-α method using the bootstrap method. J Nucl Sci Technol. 2016;53:1447–1453.
- Sakon A, Nakajima K, Hohara S, et al. Experimental study of neutron counting in a zero-power reactor driven by a neutron source inherent in highly enriched uranium fuels. J Nucl Sci Technol. 2019;56:254–259.
- Sjostrand NG. Measurements on a subcritical reactor using a pulsed neutron source. Arkiv Fysik. 1956;11:233–246.
- Gozani T. A modified procedure for the evaluation of pulsed source experiments in subcritical reactors. Nukleonik. 1962;4:348–349.
- Taninaka H, Hashimoto K, Pyeon CH, et al. Determination of subcritical reactivity of a thermal accelerator-driven system from beam trip and restart experiment. J Nucl Sci Technol. 2011;48:873–879.
- Hogan WS. Negative-reactivity measurements. Nucl Sci Eng. 1960;8:518–522.
- Sakon A, Sano T, Hohara S, et al. An impact of inherent neutron source on subcriticality measurement in a highly enriched uranium core of Kyoto University Critical Assembly. J Nucl Sci Technol. 2019;56:935–944.
- Orndoff JD. Prompt neutron periods of metal critical assemblies. Nucl Sci Eng. 1957;2:450–460.
- Misawa T, Unesaki H, Pyeon CH. Nuclear reactor physics experiment. Kyoto: Kyoto University Press; 2010.
- Sakon A, Hashimoto K, Maarof MA, et al. Measurement of large negative reactivity of an accelerator-driven system in the Kyoto University Critical Assembly. J Nucl Sci Technol. 2014;51:116–126.
- Sakon A, Hashimoto K, Sugiyama W, et al. Determination of prompt-neutron decay constant from phase shift between beam current and neutron detection signals for an accelerator-driven system in the Kyoto University Critical Assembly. J Nucl Sci Technol. 2015;52:204–213.
- Sakon A, Sano T, Takahashi K, et al. Measurement of a very large negative reactivity inserted by rapid withdrawal of a partial fuel loading in Kyoto University Critical Assembly. J Nucl Sci Technol. 2020;57:33–343.
- Nagaya Y, Okumura K, Sakurai T, et al. MVP/GMVP Version3: general purpose Monte Carlo codes for neutron and photon transport calculations based on continuous energy and multigroup methods. Tokai-mura (Japan): Japan Atomic Energy Research Institute; 2016. (JAEA-Data/Code 2016-018).
- Shibata K, Iwamoto O, Nakagawa T, et al. JENDL-4.0: A new library for nuclear science and engineering. J Nucl Sci Technol. 2011;48:1–30.
- Nagaya Y, Okumura K, Mori T, et al. MVP/GMVP II: general purpose Monte Carlo codes for neutron and photon transport calculations based on continuous energy and multigroup methods. Tokai-mura (Japan): Japan Atomic Energy Research Institute; 2005. (JAERI 1348).
- Pyeon CH. Experimental benchmarks of neutronics on solid Pb-Bi in accelerator-driven system with 100 MeV protons at Kyoto University Critical Assembly. Kumatori-cho (Japan): Research Reactor Institute of Kyoto University; 2017. (KURRI-TR-447).
- NEA Nuclear Science Committee. International handbook of evaluated criticality safety benchmark experiments. Paris (France): Organization of Economic Cooperation and Development/Nuclear Energy Agency; 1995. (NEA/NSC/DOC(95)03/II).
- Chart of Nuclides [Internet]. Austria: IAEA Nuclear Data Section. [cited 2018 Nov 1]. Available from: https://www-nds.iaea.org/relnsd/vcharthtml/VChartHTML.html
- Ensslin N. The origin of neutron radiation. In: Reilly TD, Ensslin N, Smith HA, editors. Passive nondestructive assay of nuclear materials. Washington DC (USA): US Nuclear Regulatory Commission; 1991. pp. 337–356. (NUREG/CR-5550).
- Bair JK, Gomez Del Campo J. Neutron yields from alpha-particle bombardment. Nucl Sci Eng. 1979;71:18–28.
- Hashimoto K, Miki R. Space-dependent effect observed in subcriticality measurements for loosely coupled-core system. J Nucl Sci Technol. 1995;32:1054–1060.
- Serber R. The definitions of neutron multiplication. Los Alamos (USA): Los Alamos National Laboratory; 1945. (LA-335).
- Hoogenboom JE. van der Sluijs AR. Neutron source strength determination for on-line reactivity measurements. Ann Nucl Energy. 1988;15:553–559.
- Tamura S. Signal fluctuation and neutron source in inverse kinetics method for reactivity measurement in the sub-critical domain. J Nucl Sci Technol. 2003;40:153–157.
- Taninaka H, Hashimoto K, Ohsawa T. An extended rod drop method applicable to subcritical reactor system driven by neutron source. J Nucl Sci Technol. 2010;47:351–356.
- Okuda R, Sakon A, Hohara S, et al. An improved Feynman-α analysis with a moving-bunching technique. J Nucl Sci Technol. 2016;53:1647–1652.
- Misawa T, Shiroya S, Kanda K. Measurement of prompt-neutron decay constant and large subcriticality by the Feynman-alpha method. Nucl Sci Eng. 1990;104:53–65.
- Hashimoto K, Ohya K, Yamane Y. Experimental investigations of dead-time effect on Feynman-α method. Ann Nucl Energy. 1996;23:1099–1104.
- Hashimoto K, Mouri T, Ohtani N. Reduction of delayed-neutron contribution to variance-to-mean ratio by application of difference filter technique. J Nucl Sci Technol. 1999;36:555–559.
- Hohara S, Nakajima K, Sakon A, et al. An applied limit of the bunching method for the Feynman-α analysis. J Nucl Sci Technol. 2018;55(11):1309–1316.
- Williams MMR. Random processes in nuclear reactors. Oxford: Pergamon Press; 1974. p. 37–41.
- Simmons BE, King JS. A pulsed neutron technique for reactivity determination. Nucl Sci Eng. 1958;3:595–608.
- Husimi K, editor. Nuclear reactors[Genshiro]. Tokyo (Japan): Kyoritsu Shuppan Co., Ltd.; 1972. p. 202–209. [in Japanese].
- Preskitt CA, Nephew EA, Brown JR, et al. Interpretation of pulsed-source experiments in the peach bottom HTGR. Nucl Sci Eng. 1967;29:283–295.
- Fieno D, Fox TA, Mueller RA, et al. Analysis and experiments with a pulsed neutron source for an unreflected solution reactor up to $50 shutdown. Cleveland (USA): LewisResearch Center, National Aeronautics and Space Administration; 1969. (NASA TN D-5487).
- Gozani T. The concept of reactivity and its application to kinetic measurement. Nukleonik. 1963;5:55–62.
- Amano F, Sunako K. A method of transforming the prompt decay constants αi into the static reactivity ρs. J Nucl Sci Technol. 1968;5:65–73.
- Amano F. Interpretation of pulsed-neutron-source experiments in a multiregion reactor. J Nucl Sci Technol. 1969;6:689–697.
- Hashimoto K, Nishina K, Tatematsu A, et al. Theoretical analysis of two-detector coherence functions in large fast reactor assemblies. J Nucl Sci Technol. 1991;28:1019–1028.
- Yamamuro N, Inaba G. SN ratio in the Rossi-α experiment. J Nucl Sci Technol. 1968;5:140–141.
- Holden NE, Zucker MS. Prompt neutron emission multiplicity distribution and average values (nubar) at 2200m/s for the fissile nuclides. Nucl Sci Eng. 1988;98:174–181.
- Otsuka M, Iijima T. Space-dependent formula for Rossi-α measurements. Nukleonik. 1965;7:488–491.
- Yamane Y, Watanabe S, Nishina K, et al. Subcriticality determination of nuclear fuel assembly by Mihalczo method. J At Energy Soc Jpn. 1986;28:850–858. [in Japanese].