
 ?Mathematical formulae have been encoded as MathML and are displayed in this HTML version using MathJax in order to improve their display. Uncheck the box to turn MathJax off. This feature requires Javascript. Click on a formula to zoom.
ABSTRACT
The influence of materials of mineral-insulated (MI) cables on their electrical characteristics upon exposure to high-temperature conditions was examined via a transmission test, in the objective of achieving the stability of the potential distribution along the cable length. Occurrence of a voltage drop along the cable was confirmed for aluminum oxide (Al2O3) and magnesium oxide (MgO), as insulating materials of the MI cable. A finite-element method (FEM)-based analysis was performed to evaluate the leakage in the potentials, which was found at the terminal end. Voltage drop yields by the transmission test and the analysis were in good agreement for the MI cable of Al2O3 and MgO materials, which suggests the reproducibility of the magnitude relationship of the experimental results via the FEM analysis. To suppress the voltage drop, the same FEM analysis was conducted, the diameter of the core wires (d) and the distance between them (l) were varied. Considering the variation of d, the potential distribution in the MI cable produced a minimum voltage drop corresponding to a ratio d/D of 0.35, obtained by dividing d with that of the insulating material (D). In case of varying l, a minimum voltage drop was l/D of 0.5.
1. Introduction
The Fukushima Daiichi Nuclear Power Plant accident in March 2011 contributed an influence in the development of robots for collecting information on fuel debris and radiation dose in a primary containment vessel. On a parallel objective, several researchers, including those from the Japan Atomic Energy Agency (JAEA), developed a water level gage, a hydrogen concentration sensor, and a self-powered gamma detector (SPGD), as devices in obtaining data for monitoring of the inner-core reactor state of a nuclear plant in case of severe accidents (SA) [Citation1–3]. In particular, JAEA’s research actually conducted some irradiation Gamma irradiation tests on SPGD, and confirmed that the output current increased from 0 to about 3 × 10⁻¹⁰ A under the environment of 2.7 × 10⁻³ to 1.4 Gy/s. Therefore, the signal and power cables of the sensors, to be effective, must be incorporated with heat resistance and high transmission capabilities that can withstand the high-temperature, high-pressure, and irradiation environments associated with SA [Citation4–9]. One of the most promising cable materials that exhibits these properties is the mineral-insulated (MI) cable. MI cables are widely applied, for instance, as fire and safety-rated power/signal cables and high-temperature thermocouple cables. More particularly though, MI cables are used in specialized structures for process-heating applications, such as in immersion heaters, heat exchangers, and industrial heating cables for high-power density, high-temperature, or corrosive service. Configuration-wise, an MI cable is mainly covered with an insulating material, and a sheath material around the core wires, thereby allowing the possibility to bring the electrical resistance of the core wire to close-to-zero and that of the insulating material to close-to-infinity. However, the specifications of MI cable between the central conductor and the sheath used in nuclear fusion are that, for a cable with a length of 25 m, a temperature of 25°C/pressure of 4MPa, an irradiation dose of 10 Gy/s, a voltage of 300 mV, and a electrical resistance of 2.0 × 10⁻⁶ Ω·m. At least in terms of heat-resistant temperature, it cannot satisfy SA at all [Citation10]. And a study found that when polyvinylchloride (PVC) is used, insulation resistance tends to leak with a rise in temperature [Citation10]. In MI cables as a particular case, most alloys used as core wires exhibit the tendency of an increasing electrical resistance with temperature, as opposed to the decreasing trend with temperature associated with insulating materials. Moreover, given that these cables are expected to be heavily exposed to SA environments (O2, O2/H2O, I2, and I2/O2/H2O), it is just logical for them to possess excellent corrosion resistance [Citation11]. This study presents an investigation of the effect of core wire, insulating material, and cable design on the voltage drop of MI cables exposed to simulated high-temperature SA environments. The focus is on the core design, in terms of the influence of different core wires and insulation materials, diameter of core wire, and distance between two core wires, on the electrical characteristics of MI cables.
2. Configuration of MI cables
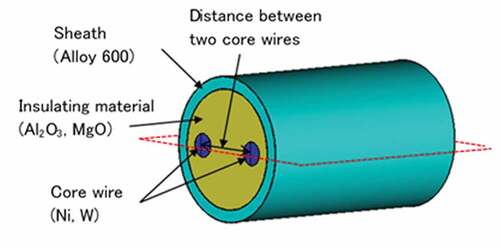
A schematic representation of an MI cable is shown in . Based on the perspective of a compact design, the dimensions of the sheath and core wires were examined within the region of specifications for commercial products [Citation12]. The MI cable studied in this paper comprised a pair of core wires [Citation13], separated by a variable distance. Because the insulating material was packed between the sheath and core wires, the electrical characteristics of the MI cable change considerably according to the type and thickness of the insulating material. Nickel (Ni) and tungsten (W) were considered as the candidate core wire materials, given their high-temperature strength and good electrical conductivity [Citation14]. Aluminum oxide (Al2O3) and magnesium oxide (MgO) were chosen as insulating materials, based on the principle of a combined insulation performance [Citation15,Citation16]. For the sheath, the nickel-based alloy 600 (Alloy 600) was selected for maintaining the corrosion resistance of the MI cable [Citation17].
Figure 1. Schematic representation of an MI cable
3. Experimental methods and numerical analysis condition
3.1. Experimental method for derivation of electrical and physical characteristics
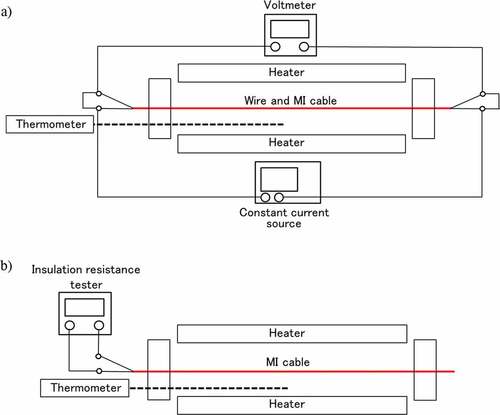
As shown in the reference [Citation18], after SA has occurred, the molten Zr fuel rod reached the bottom of the reactor pressure vessel, mixed with Fe and Ni present in the steel structure, and at a temperature near 930°C, the eutectic Debris has formed and may still be remained. Therefore, an SA environment was simulated by heating of the Ni core wire (length: 1.5 m; diameter: φ 0.31 mm) and W core wire (length: 1.5 m; diameter: φ 1.0 mm) from 25°C to 1000°C in a vacuum heat treatment furnace. Furthermore, the target value of the volume resistivity of the prepared wires was set to less than 2.0 × 10⁻⁶ Ω·m with reference to the specifications of Vila et al. for the magnetic diagnostic coil for fusion ITER described above [Citation10]. shows a schematic diagram for measuring changes in conduction resistance in a vacuum heat treatment furnace for wire. A voltmeter based on the four-terminal method was installed at both ends of the wires exiting from the furnace, and then the conduction resistance of Ni and W was measured as a function of temperature by controlling to 0.1 A direct current (DC) using a constant current source. Another measurement was carried out for the MI cable with a length of 1.5 m and outer diameter of φ 1.6 mm was measured with Ni as the core wire and Al2O3 or MgO as the insulating material. shows a schematic diagram for insulation resistance measurement using a vacuum heat treatment furnace for MI cable. For this measurement, the distance between the core wires was 0.483 mm, the diameter of the core wire was 0.31 mm, and the inner diameter of the sheath was 1.14 mm. In particular, when measuring the insulation resistance between core wires, insulation resistance tester was connected so as to straddle between core wires. Then, the target value of the volume resistivity of the insulating material was also set to 6.67 × 10¹⁰ Ω·m or higher for Al2O3 and 3.3 × 10¹⁰ Ω·m or higher for MgO with reference to the specifications of Vila et al. [Citation10]. Using the values of thermal conductivity, specific heat, and electrical conductivity of Ni, W, Al2O3, and MgO measured under different temperatures, the potential and electric field in the MI cable were determined via numerical analysis. Incidentally, regarding the chemical composition of each material, Electron Probe Micro Analyzer (EPMA) using a standard sample was performed on a 10-point average.
Figure 2. Schematic diagram for measuring changes in a vacuum heat treatment furnace of a) conduction resistance of Ni wire, W wire, MI cable with Al2O3 and MgO, b) insulation resistance between core wires in MI cable
3.2. Voltage transmission test with a long MI cable
shows a photograph after long MI cable (length: 6 m; diameter: φ 1.6 mm) was wrapped around a cylindrical container and placed in a heat treatment furnace as a coil. MI cable became compact with a length of 0.125 m and an outer diameter of φ 30 mm. A schematic diagram for performing voltage drop measurement in a coiled MI cable is shown in . Voltage transmission tests of the manufactured coiled MI cable were performed with a constant voltage source installed on one side and a voltmeter installed on the other side.
Figure 3. a) Photograph after winding a 6 m long MI cable in coil shape, b) schematic diagram for performing voltage drop measurement in a coiled MI cable
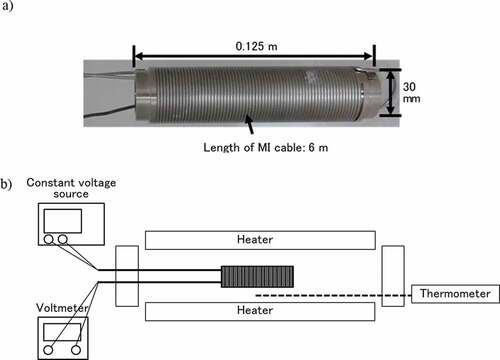
For the materials, Ni was used for the core wire, Al2O3 or MgO for the insulating material, and Alloy 600 for the sheath. Input potentials of 0.1, 1.0, and 10 V were applied at one side of the MI cable and the output potentials were measured at 500–1000°C, for estimation of the voltage drop.
3.3. Electrical analysis condition at 900°C to 1000°C
Three-dimensional electric finite-element method (FEM) was employed for the electrical analysis. In particular, the behavior is characterized with Poisson equation for the voltage potential, which can be understood as Ohm’s law in a differential form [Citation19]. And the analysis was performed under a steady-state condition at 900°C and 1000°C, so as to determine the corresponding potential according to the material of the core wire and the insulating material on the MI cable. Additionally, the potential was examined under varying diameters of the core wire or different distances between them. The analysis code was ABAQUS 2017 [Citation20]; a half-model such as the part represented by dotted red lines in , which crosses the two core wires in the MI cable of the φ 10 mm × 1.0 m, was used for the study, as the vertical cross section with respect to the longitudinal direction was a mirror surface relation. The sheath part was omitted to simplify the analysis model. Moreover, the diameter of the insulating material was fixed at φ 10 mm, that of the core wire changed from 1.0 to 4.9 mm, and the distance between the center of the two core wires changed from 3.0 to 7.0 mm. As a boundary condition for this model, potentials of 10 and −10 V were applied to an end of the two core wires, whereas the whole side of the sheath was maintained at 0 V. Conduction and insulation resistances obtained in the experiments were used as electrical and physical characteristics for the analyses, using the elements of 91,200 to 110,400 for each. Nevertheless, the model employed DC3D20E, a 20-node quadratic coupled thermal–electrical brick.
4. Results and discussion
4.1. Measurement test on electrical resistance of the materials
The core resistance RD [Ω] obtained via experiments was converted into the volume resistivity ρ [Ω·m] following the equation,
where A [m2] is the radial cross-sectional area, and L [m] is the cable length. Consequently, the electric conductivity can be derived from the reciprocal of . The impact of temperature on the volume resistivity of Ni and W is depicted in . Here volume resistivity for both materials increased gradually with temperature. Nevertheless, Ni exhibited a high resistance of 1.1 × 10⁻⁶ Ω·m at 1000°C, whereas W displayed a lower resistance of 2.3 × 10⁻⁷ Ω·m. Comparing these values with the reference values [Citation21], the volume resistivity of W 99.9 mass% wire analyzed by EPMA was almost equal to the experimental value, whereas that of Ni became considerably larger than the reference value as the temperature increased. In particular, this difference became significant at temperatures exceeding 200°C. Such difference in Ni, as described in reference [Citation22], was assumed as a result of impurity in the material. Also, in the actual EPMA analysis result, Ni content of 99.3 mass% and other Mn + Cr 0.7 mass% were obtained in the Ni wire, and it was confirmed that the small amounts of Cr and Mn, which change the electrical characteristics were contained. Based on this result, the volume resistivity of Ni could be lowered by reducing the amount of impurities through the improvement of the refining process during manufacturing of the material. By contrast, the increase in electrical resistance due to the rising temperature can be suppressed in the case where W was used. Nonetheless, W remains inferior to Ni, on the viewpoint of workability and flexibility of the core wire [Citation23], and the effect is also apparent from the difference in diameter of the core wire between Ni and W shown in Section 3.2. Further development for the core wire manufacturing methods of W-based materials is expected. In any case, these volume resistivities of both Ni and W are below the target value of 2.0 × 10⁻⁶ Ω·m, and it is assumed that the value itself does not cause a fatal potential drop as MI cable. Rather, it is more important to keep the voltage inside the cable so that it does not leak. From the above points of view, Ni was selected as the core wire material for the cable in this experiment in consideration of feasibility as MI cable.
Figure 4. Effect of temperature on volume resistivity of Ni and W
shows a semi-logarithmic plot of the effect of temperature on the volume resistivity of Al2O3 and MgO insulating materials. Note that the volume resistivity was derived from the reference equation [Citation24],
Figure 5. Effect of temperature on volume resistivity of Al2O3 and MgO
where l [m] is the distance between core wires; d [m] and D [m] are diameters of the core wire and the insulating material, respectively and; RZ [Ω] is the insulation resistance. Contrary to the trend associated with the volume resistivity of the core wire, in both cases the resistance decreased with temperature increase. Specifically, the resistance of Al2O3 decreased from 1.6 × 10¹³ to 1.7 × 10⁵ Ω·m, and that of MgO from 1.3 × 10¹² to 1.8 × 10⁵ Ω·m at 25–750°C. Subsequently, both values achieved an almost the same resistance at 750–900°C, followed by a drop in the resistance of MgO at 1000°C, to 3.5 × 10³ Ω·m. With this, MgO exhibited an overall lower resistance compared to Al2O3. On the other hands, it was confirmed that Al2O3 was already below the target value (6.67 × 10¹⁰ Ω·m) at 250°C and MgO was below the target value (3.3 × 10¹⁰ Ω·m) at 100°C. Therefore, if the insulation resistance cannot be increased as much as possible, there is a possibility that a voltage drop will occur at higher temperature. Both resistivity values of Al2O3 and MgO tended to deviate from the reference data [Citation25,Citation26]. It is assumed that these differences in resistance behavior were due to the insulating material wound in a coil shape achieving lower insulation resistance at the bent portion than the linear insulating material. And MgO is particularly known to exhibit deliquescence, and to absorb ambient water vapor. Previous study has generally shown that the inclusion of water vapor results in remarkably lower insulation resistivity than only ceramics including MgO and Al2O3 [Citation27]. Even before the actual experiment, these cables were not placed in a drying room and were not been dried sufficiently. Therefore, it is possible that the insulation resistance of MgO has decreased due to deliquescence. On the other hand, regarding the influence of the difference in the purity with respect to MgO, the results of measuring the conductivity of MgO at 99.9% purity and 99.99% purity are examined by Katheren et al. [Citation26]. As a result, no sufficient differences were found between the two. In actual EPMA analysis, it was 99.9 mass% MgO, and it is assumed that the difference between the experimental value and the reference value for MgO is not due to impurities. Meanwhile, the EPMA analysis values of Al2O3 were Al2O3 99.5 mass% and Ca 0.5 mass%, but it was unclear why the insulation resistance of Al2O3 was higher than the reference value.
4.2. Transmission test by different insulating materials, Al2O3 and MgO (core wire: Ni)
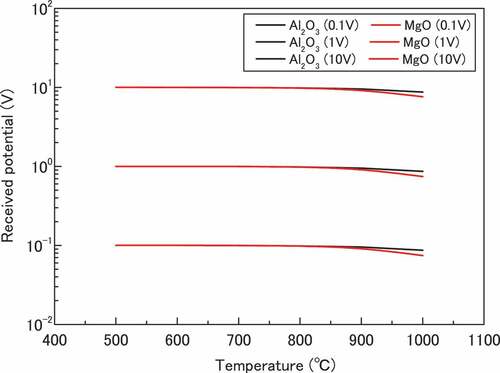
The change in the output potentials of the MI cable at 500–1000°C with input potentials of 0.1, 1.0, and 10 V, with Al2O3 or MgO as insulating material, is illustrated in . There was no significant difference in the input and output potentials at temperatures ≤800°C, regardless of the type of insulating material. At 900°C however, a potential leakage of 4.6–4.7% in Al2O3 and 6.3–6.8% in MgO was observed. Such voltage drop increased to 12.7–13.3% with Al2O3 and 23.9–25.7% with MgO at 1000°C. The maximum difference between the received potentials of Al2O3 and MgO was 1000°C/10 V, which is indicated to be caused by the decrease in MgO volume resistivity at 1000°C, as depicted in . In effect, the received potential presumably changed.
Figure 6. Change in the output potentials of Al2O3 and MgO at 500°C–1000°C with potentials of 0.1, 1.0, and 10 V
4.3. Analysis evaluation
4.3.1. Potential distribution analysis on inlet and outlet sides in different materials (Al2O3 and MgO)
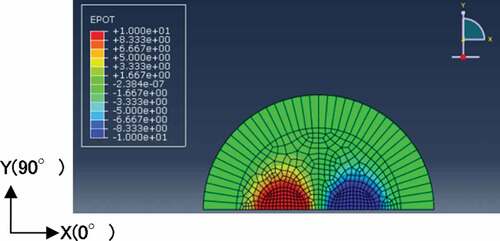
The electrical analysis result for the close to dimensions of the MI cable used in (length: 1.0 m; diameter: φ 1.6 mm) is described herein for the reproduction of the voltage drop phenomenon in . shows the potential distribution in the FEM analysis of the cross-sectional direction of the starting end of the MI cable, comprising a Ni core wire and Al2O3 insulating material, as the cable was heated at 1000°C. The electrical conductivity, as the reciprocal volume resistivity shown in and 5, respectively, was used herein. On one hand, the potential distribution narrowed in the 0°-direction, in cases wherein two core wires existed and spread in the 90°-direction, representing an elliptical shape. This is the effect of the two core wires being arranged in parallel. On the other hand, this FEM analysis can be used to predict the potential change at the 1 m long terminal end against potentials 10 and −10 V at the start. In fact, after verifying the change in the potential at the terminal end due to the difference between the Ni and W core wires, the Ni core wire potentials were found to change from 10 to 9.94 V, whereas those of the W core wire from 10 to 9.99 V. Given that such voltage drop was representative for a value for a length of 1 m, the potential at the terminal end portion in the case of the 6 m length was specified at the sixth power. Accordingly, for the case of the MI cable with Ni core wire, the potential was 9.66 V at the 6-m long terminal end, and 9.99 V for the case of the W core wire. This result suggests that with the conventional Ni core wire, a voltage drop of approximately 3.4% occurs when the cable length is 6 m, while almost no voltage drop is associated with W, even for a long core wire.
Figure 7. Results of potential distribution via the FEM analysis of the cross-sectional distribution of an MI cable, heated at 1000°C
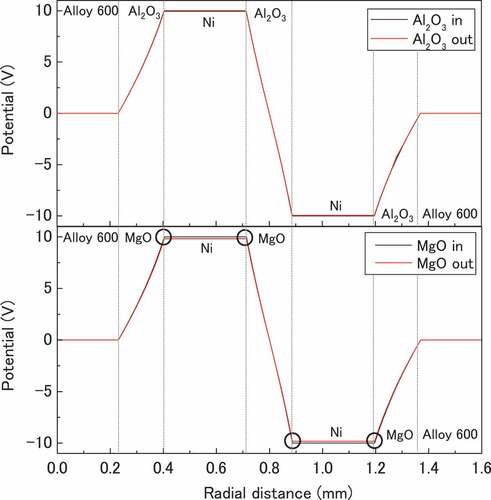
shows the FEM-analysis-derived potential distribution on the axial cross-sectional direction of the end of the MI cable comprising Al2O3 and MgO, respectively, as the insulating materials. In the case of Al2O3, only a slight change in the potential of Ni core wire between the inlet and outlet sides was observed. In the case of MgO, a clear voltage drop was confirmed in the Ni core wire, not because of the voltage drop in the Ni core wire but due to the voltage drop associated with the low insulation resistance of MgO. Figure-wise, the voltage dropped from 10 to 9.8 V for the 1 m cable length, and down further to 8.99 V, for the 6 m long cable. Here, as compared to the potential change of 10 V at 1000°C, the case where MgO was used as the insulating material () showcased a voltage drop experimental result that was quite larger than the value yield by FEM analysis. Nevertheless, the relative relationship of the voltage drop by FEM analysis in Al2O3 and MgO was consistent with the magnitude relationship illustrated in .
Figure 8. FEM-analysis-derived potential distribution on the cross-sectional direction of the MI cable at the starting end and the terminal end, with Al2O3 and MgO as insulating materials. (Alloy 600: sheath thickness part, Al2O3; MgO: insulation thickness part, Ni: core wire thickness part, ○: circle indicates the part where voltage drop is clearly observed in the wire)
shows a comparison of the potentials between the measured value of the terminal part at 900°C and 1000°C with Al2O3 and MgO as insulating materials, respectively, and the potentials by FEM analysis. At 900°C, the change in the terminal potential with Al2O3 and MgO as insulating materials disclosed a good agreement with that of the FEM analysis. On the contrary, at 1000°C, the analytical result was greater than the experimental value at any potential. There is the possibility that the voltage drop in the cable wound around the coil could not be completely reproduced by the FEM analysis. Nonetheless, this result can relatively reproduce the voltage drop in Al2O3 and MgO, as indicated in . Therefore, from a practical point of view, the utilization of Ni for the core wire and Al2O3 for the insulating material is appropriate for achieving a relatively small voltage drop.
Figure 9. Comparison of voltage drop and potentials yield by FEM analysis and the measured potentials at the terminal part of the 6-m long MI cable at 900°C and 1000°C, respectively, with Al2O3 and MgO as the insulating materials
4.3.2. Electrical analysis on inlet and outlet sides given a change in core wire diameter
This section provides an investigation and discussion on the influence of the difference in the core wire diameter of MI cables on the voltage drop. Additionally, a theoretical model is established to evaluate the magnitude relationship of voltage drop with varying d. shows a schematic of a lumped constant circuit model in an MI cable. The diagram displays the direction of the MI cable length with resistances RD at the top and the bottom of the circuit, and RZ between the core wires. Firstly, when the initial potential V reaches the end, the outlet side potential Vout is generated. Then, RD can be derived via EquationEq. (1(1)
(1) ), where
is constant value. In particular, A was defined as
, and L was 6 m.
Figure 10. Schematic diagram of lumped constant circuit model in MI cable
Correspondingly, RZ can be also derived via EquationEq. (2)(2)
(2) . Vout results from the values of RD and RZ by
Afterward, D, l, V, and d were set to 10 mm, 5.0 mm, 10 V, and 1.0–4.9 mm.
displays the Vout on the vertical axis, as well as the ratio d/D, obtained by dividing the diameter of the core wire with the insulating material diameter on the horizontal axis. Relatively, Vout had a maximum value when d/D was 0.35, associated with a rise and a drop of potentials. On the contrary, d/D for the MI cable used for the transmission test described in the previous sections was 0.272, which may not be an optimum cable design with no voltage drop. Based on the results in , along with a practical point-of-view, it is then appropriate to use Ni for the core wire and Al2O3 for the insulating material, so as to obtain a relatively small voltage drop. On such basis, the magnitude relationship of the voltage drop with variation in d of the MI cable with these materials was evaluated through FEM analysis.
Figure 11. Outlet side potential Vout accompanying the change in d/D obtained by dividing the diameter of the core wires with the diameter of the insulating material, based on a theoretical model
shows the Vout on the vertical axis and the ratio d/D on the horizontal axis derived by FEM analysis. Here, D, l, and d were set to the same values as in . The value of d/D gradually increased to 0.35, where it remained nearly stable to 0.4. After that, a voltage drop occurred rapidly upon approaching d/D = 0.5, which is the maximum core wire diameter entering the insulating material. Notice that although the profile shapes in and 12 are not exactly the same, the trend in both similar, based on the theoretical model. On one hand, an extremely small core wire diameter would have a corresponding voltage drop in the longitudinal direction due to the long cable. On the other hand, an extremely large diameter would have a corresponding voltage drop in the radial direction of the cable, as well as on the outlet side.
Figure 12. Outlet side potential Vout accompanying the change in d/D obtained by dividing the diameter of the core wires by the diameter of the insulating material, based on FEM analysis
4.3.3. Electrical analysis on inlet and outlet sides due to change in distance between the core wires
For the case of d/D = 0.35 depicted in and 13 displays the result of FEM analysis, which shows Vout on the vertical axis and the ratio l/D obtained by dividing the distance between the core wires with the diameter of the insulating material on the horizontal axis. Here, D, d, and l were set to 10 mm, 3.5 mm, and 1.0–9.0 mm, respectively. Vout increased monotonously as l/D was increased to 0.5, and then monotonously decreased beyond that. In particular, Vout did not exhibit a symmetric decrease of the same rate with 1/D = 0.5 as the boundary. By contrast, because the l/D of the MI cable that has been used for the transmission test was 0.424, such was a confirmation that commercially available MI cables do not always necessarily have to manifest an optimum structure. Therefore, it is desirable that the distance between the core wires where minimum voltage drop occurs is preferably half of the diameter of the insulating material with l/D = 0.5.
Figure 13. Outlet side potential Vout accompanying the change in l/D obtained by dividing the distance between the core wires with the diameter of the insulating material, based on FEM analysis
5. Conclusion
The potential distribution of the MI cable was objectively stabilized following an investigation via a transmission test of the influence of its various composition materials on electrical characteristics under high-temperature. Upon confirmation of an existent voltage drop, a FEM analysis was performed for the evaluation of the leakage potential. To suppress the voltage drop, the same analysis was carried out, this time, the core wire diameter and the distance between the two core wires were varied. The main findings are summarized as follows:
1)Based on measured received potentials for a long MI cable under high-temperature conditions, voltage drop occurred in Al2O3 and MgO from at least 900°C. The voltage drop observed for MgO was large. The lower volume resistivity of MgO was presumably attributed to the deliquescence.
2)The potential distribution analysis that was aimed at reproducing the voltage drop in the cable confirmed the existence of the phenomenon at the terminal end. There was a good agreement between the voltage drop yield by the FEM-based analysis and by the transmission test, for the MI cable of both Al2O3 and MgO exposed at 900°C. Therefore, the magnitude relationship of the experimental results can be relatively reproduced by the FEM analysis.
3)Variation of the core wire diameter produced a potential distribution with a minimum voltage drop corresponding to ratio d/D of 0.35, which suggests that the diameter should not be either too small or too large.
4)Accordingly, the variation of distance between the core wires generated a potential distribution with a minimum voltage drop corresponding to l/D of 0.5, which indicates that half the diameter of the insulating material is the desirable distance between the core wires.
The future direction of the study is aimed at suppressing the voltage drop via fabrication of the appropriate MI cable, which is achievable by setting of the optimum distance between the core wires and the optimum diameter of the core wires.
Acknowledgments
The authors wish to express their gratitude to Mr. Yuji Ito of Nippon Tungsten Co., Ltd., for supply of the W wire material.
Disclosure statement
No potential conflict of interest was reported by the authors.
References
- Takeuchi T, Ohtsuka N, Shibata A, et al. Development of a self-powered gamma detector. J Nucl Sci Technol. 2014 May;51(7–8):939–943.
- Todt WH Characteristics of self-powered neutron detectors used in power reactors. Proc. of a Specialists meeting by NEA; 1996 Oct 14–17; Mito, (Japan).
- Vermeeren L, Carcreff H, Barbot L, et al. Irradiation tests of prototype self-powered gamma and neutron detectors. ANIMMA 2011; 2011 Jun 1–8; Ghent, (Belgium).
- Shikama T, Narui M, Sagawa T. Radiation induced electromotive force in mineral insulated cable under reactor irradiation. Nucl Instrum Methods Phys Res Sect B. 1997 March;122(4):650–656.
- Nishitani T, Shikama T, Fukao M, et al. Irradiation effects on magnetic probes made of mineral insulated cable. Fusion Eng Des. 2000 Nov;51–52:153–158.
- Nishitani T, Vayakis G, Yamauchi M, et al. Radiation-induced thermoelectric sensitivity in the mineral-insulated cable of magnetic diagnostic coils for ITER. J Nucl Mater. 2004 Aug;329–333:1461–1465.
- Vila R, Hodgson ER. Thermally induced EMF in unirradiated MI cables. J Nucl Mater. 2007 Aug;367–370:1044–1047.
- Tanaka T, Sato F, Iida T, et al. Electrical properties of mineral-insulated cable under fusion neutron irradiation. Fusion Eng Des. 2003 Sep;66–68:837–841.
- Böck H, Suleiman M. Investigations of mineral insulated cables exposed to high temperature and intense gamma radiation. Nucl Instrum Methods. 1978 Jan;148(1):43–50.
- Vila R, Hodgson ER. RIEMF in MgO and Al2O3 insulated MI cable ITER magnetic diagnostic coils. J Nucl Mater. 2004 Aug;329–333:1524–1528.
- Keski-Rahkonen O. Effect of electrical conductivity on emergency performance of cables at high temperatures. Trans 17th Inter Conference on Structural Mechanics in Reactor Technology (SMiRT 17) Prague; 2003 Aug 17–22; Czech Republic.
- Nakano H, Hirota N, Shibata H, et al. High-temperature oxidation of sheath materials using mineral-insulated cables for a simulated severe accident. Bull JSME. 2018;5:No.2:1–12.
- Web site of Sukegawa electric co., LTD. [Internet]. Japan: sukegawa electric co., LTD; 2018 Oct 4; [cited 2019 Oct 7]. Available from: http://www.sukegawadenki.co.jp/products/micable.html
- Rafferty NR, Baen P, Brown DO. et al. Considerations for application of mineral insulated electrical resistance heating cable, 2005: DOI: 10.1109/PCICON.2005.1524545.
- Chen S-F, Komeda H, Fujii K, et al. Recrystallization Process of Powder Metallurgy Tungsten Wires. Nihon-Kinzoku-Gakkai Shi. 1989;53:1198–1207, in Japanese
- Shikama T, Narui M, Sagawa T. Fission-reactor-radiation-tests of MI-cables and magnetic coils for fusion burning plasma diagnostics. Fusion Eng Des. 2000 Nov;51–52:171–177.
- Srinivasan G, Bhaduri AK, Ray SK, et al. Vacuum brazing of Inconel 600 sleeve to 316L stainless steel sheath of mineral insulated cable. J Mater Proc Tech. 2008 March;198(1–3):73–76.
- Hofmann P. Current knowledge on core degradation phenomena, a review. J Nucl Mater. 1999;270(1–2):194–211.
- Yeow K, Teng H, Thelliez M, et al. 3D thermal analysis of li-ion battery cells with various geometries and cooling conditions using abaqus. SIMULIA Community Conference; Province (RI); 2012 May 15–17. p. 1–17.
- Matsuzaki R. Analysis of electrical characteristics using ABAQUS. Kyouka-Plastics. 2017 March;63(3):135–142. in Japanese.
- Ikeda K. 2016 Nov. Chronological scientific tables 2017, Maruzen Publishing Co., Ltd. pp. 422.
- Rossiter PL. The electrical resistivity of metals and alloys. Cambridge Solid State Sci Ser. 1987;First paper back edition:329–331.
- Wei Q, Jiao T, Ramesh KT, et al. Mechanical behavior and dynamic failure of high-strength ultrafine grained tungsten under uniaxial compression. Acta Mater. 2006;54:77–87.
- Kaul K. Einführung in die theoretische Elektrotechnik, Vol. 8, [in Germany]. Springer, 1965; p. 552.
- Web site of Earthwaterfire.com. [Internet]. Japan: earthwaterfire.com; 2018 Nov 4; [cited 2019 Oct 11]. Available from:https://www.earthwaterfire.com/japanese/alumina_rods.htm
- Kathrein H, Freund FJ. Electrical conductivity of magnesium oxide single crystal below 1200K. Phys Chem Solids. 1983;44(3):177–186.
- Yamanaka H, Maejima T, Terunuma Y, et al. Measurement of pure water resistivity in a high temperature region. JAEA-Tech Japan Atomic Energy Agency; 2014 Dec. p. 1–12 (JAEA-Technology 2014-037) [in Japanese.