
ABSTRACT
In order to clarify the cesium iodide (CsI) transport behavior with a focus on the mechanisms of gaseous iodine formation in the reactor coolant system of light water reactor (LWR) under a severe accident condition, a reproductive experiment of CsI transport behavior was conducted using a facility equipped with a thermal gradient tube. Various analyses on deposits and airborne materials during transportation could elucidate two mechanisms for the gaseous iodine formation. One was the gaseous phase chemical reaction in Cs-I-O-H system at relatively high-temperature region, which led to gaseous iodine transport to the lower temperature region without any further changes in gas species due to the kinetics limitation effects. The other one was the chemical reactions related to condensed phase of CsI, namely those of CsI deposits on walls with surface of stainless steel to form Cs2CrO4 compound and CsI aerosol particles with steam, which were newly found in this study.
1. Introduction
Following the severe accident (SA) of Fukushima-Daiichi Nuclear Power Station (1F), more accurate source term estimation under light water reactor (LWR) SAs are required for the continuous LWR safety improvement [Citation1] and the evaluation of fission product (FP) distribution inside the 1F towards various kinds of decommissioning works, such as debris removal [Citation2]. The source term under SAs is estimated considering release behavior from a nuclear fuel and transport behavior in a reactor of FPs. FP chemistry during the release and transport has been one of the key issues because the FP release and transport are strongly affected by the properties of FP chemical species, e.g. volatility, water solubility [Citation3]. In particular, FP chemistry in relatively high-temperature regions, namely in the reactor pressure vessel (RPV) and the reactor coolant system (RCS), is important [Citation4–7] because the FP chemistry in these regions could drastically be varied by the changes in conditions such as temperature and atmosphere, and determine the FP physical/chemical state in lower temperature region such as the primary containment vessel (PCV).
In the FP chemistry research, focuses have been placed on cesium (Cs) and iodine (I) because of the 1F decommissioning works and their radiological impact on the environment, respectively. In the present source term estimations, Cs release and transport behavior has been analyzed on the assumption that Cs takes cesium iodide (CsI) and cesium hydroxide (CsOH) forms [Citation8–10]. However, regarding the FP chemistry in the RCS temperature conditions under SAs, around 1000 K, recent researches have pointed out the possible formations of cesium molybdate (Cs2MoO4) [Citation11,Citation12] and cesium borate (CsBO2) [Citation13–16] by the reactions of Cs with one of the abundant FPs, molybdenum (Mo), and the control rod material, boron (B), respectively. The formation of these compounds could affect the amount of CsI, and consequently, a part of I could be transported as gaseous I instead of CsI [Citation17]. Besides, recent researches showed importance of the gas-solid phase chemical reactions for the evaluation of Cs and I transport behavior, e.g. Cs chemisorption onto the structural materials (Cs chemical reaction with the structural materials) in the RPV [Citation18,Citation19]. Appropriate application of chemical reaction kinetics is also important since Cs and I chemical species are expected to be transported to lower temperature regions before reaching to the chemical equilibrium (kinetics limitation effects [Citation20,Citation21]).
Thus, actual Cs and I chemistry in the high-temperature regions are very complicated and should be evaluated comprehensively for better source term estimation. Therefore, as a fundamental basis for them, we have been constructing an FP chemistry database named ECUME (Effective Chemistry database of fission products Under Multiphase rEaction) [Citation22,Citation23]. ECUME consists of three kinds of datasets: CRK (dataset for Chemical Reaction Kinetics), EM (Elemental Model set), and TD (ThermoDynamic dataset). The present ECUME is equipped with CRK for the reaction of Cs-I-B-Mo-O-H system in gas phase, EM for the Cs chemisorption onto stainless steel and TD for CsBO2 vapor species and solid Cs2Si4O9 and CsFeSiO4. The validation and improvement of ECUME will be continuously conducted based on new experimental and analytical results on Cs and I chemistry in SA conditions [Citation24].
This paper presents the experimental results for validation and improvement of the base part of ECUME, namely data for Cs-I-O-H system. In order to construct a reliable chemistry database, physical and chemical behaviors should be considered comprehensively in such validation and improvement. This is because FPs would be subjected to not only chemical but also complex physical processes such as condensation followed by the deposition on walls and aerosol formation/growth during transportation in the RCS [Citation3]. These changes in physical state would then affect FP chemical behavior. Therefore, in this study, a reproductive experiment of FP transport behavior in the RCS condition was conducted using the dedicated experimental facility named TeRRa (Test-bench for FP Release and tRansport) [Citation24]. The TeRRa is equipped with a thermal gradient tube (TGT) and enables a variety of analyses of FP physical and chemical state for not only deposits but also airborne aerosol at each temperature region in the TGT. So far, the TeRRa had acquired data on chemical and physical behaviors of B during transportation [Citation25] which is also mandatory for the validation and improvement of the CRK for the reaction of Cs-I-B-Mo-O-H system.
As a representative Cs-I-O-H chemical species, CsI was used for the present experiment. This is because CsI has been thought to be one of the major I-containing chemical species in both PWR and BWR even in the presence of B and Mo [Citation26]. In addition, CsI is a possible source of gaseous I, which underlines importance of its chemical behavior. A lot of experiments have been conducted so far to investigate CsI transport behavior under temperature gradient conditions in inert or steam atmosphere [Citation27–30]. Although some of the experimental results showed the formation of gaseous I [Citation27,Citation30], phenomena related to CsI transport in the RCS have not been sufficiently clarified because of the lack of detailed analyses of Cs and I physical/chemical states at each temperature region during transportation. Therefore, in this study, detailed CsI transport behavior in the RCS condition was investigated with a focus on the mechanisms of the gaseous I formation.
2. Experimental
2.1. Experimental setup
shows the schematic view and the basic specifications of the experimental setup of the TeRRa [Citation24]. The TeRRa is composed of two furnaces connected with a TGT and has a simple straight path for transport of vapor and aerosol of simulant FPs and/or structural materials such as B (hereafter, an FP path). The high-frequency induction furnace with a carbon susceptor (100 mm in length) and the electric resistance furnace (200 mm in length) heat a 37.2 mm-inner-diameter (I.D.) alumina tube where simulant FPs or structural materials can be vaporized. The TGT (1300 mm in length) has a linear temperature gradient from 1000 K to 400 K [Citation24] simulating the RCS temperature conditions under SAs. In order to suppress the temperature decreases between these furnaces where no heat source exists, insulators are placed on the bare alumina tube.
Figure 1. Schematic view and basic specifications of the experimental setup of the TeRRa
In the present experiment, 13 inner tubes (39.4 mm in I.D. and 100 mm in length) and 33 sampling coupons (10 mm × 10 mm and 1 mm in thickness) were placed in the TGT. These were made of 304 L-type stainless steel (SUS 304 L) as the SUS 304 L is one of the typical materials in the RCS [Citation31]. The coupons were sequentially numbered from 1 to 33 from the highest temperature position. At the outlet of the TGT, a sintered filter made of 316-type stainless steel (SUS 316) fiber having the nominal filtering accuracy of below 1 μm was equipped to collect airborne aerosol particles transported to the outlet of the TGT, followed by a polyvinylidene fluoride (PVDF) aerosol filter (Merck, 0.22 μm in pore size). Two liquid traps filled with a mixed solution of 0.2 mol/L sodium hydroxide (NaOH) and 0.02 mol/L sodium thiosulfate (Na2S2O3) were equipped at the downstream of these filters to collect gaseous I formed during transportation. By using the above-mentioned sampling equipment, the deposits in the TGT and the airborne materials transported to the outlet of the TGT were subjected to the post-heating test analyses as mentioned later.
In addition, the TeRRa can sample the airborne materials from seven extraction points in the TGT, every 100 K from 1000 K to 400 K. The extracted gas is diluted to adjust the flow rate for the following aerosol measurement and collection. The extraction line is composed of an on-line optical aerosol spectrometer (PALAS, welas® digital 2000) and a seven-stage cascade impactor (Tokyo Dylec Corp. MAIS-7) followed by a polytetrafluoroethylene (PTFE) backup filter (ADVANTEC, 0.1 μm in pore size) and two liquid traps filled with the same solution as the outlet of the TGT. The effective measurement range of particle size in the aerosol spectrometer is from 0.2 µm to 10 µm which is calibrated by the polystyrene latex (PSL). The cut-off diameters (Dp50 s) from the first to seventh stage of the cascade impactor are 5.6 µm, 2.8 µm, 1.4 µm, 0.48 µm, 0.24 µm, 0.07 µm, and 0.04 µm, respectively. The Dp50 represents the particle diameter at which particles are sampled with 50% efficiency. These values were roughly estimated based on the equations of Ranz and Wang [Citation32] on the assumption of ideally spherical CsI particles (4.5 g/cm3) and experimental flow conditions in the cascade impactor: 4 NL/min (NTP; conditions 273 K, 1.013 × 10⁵ Pa) and 400 K.
2.2. Experimental procedure
Before the experiment, the ultrasonic cleaning with acetone for the inner tubes and the sampling coupons was carried out to remove any impurities such as grease. And then, the inner tubes were set in the TGT and heat-treated under argon (Ar) atmosphere at about 400 K to remove the organic solvent of acetone.
lists the experimental conditions. CsI powder (Wako, 99.9 wt%) in an alumina crucible (14 mm in I.D. and 14 mm in height) was placed in the electric resistance furnace (). The high-frequency induction furnace was heated to above 1000 K to preheat the injected gas. The electric resistance furnace and the TGT were heated to 1273 K (the heating rate was about 8.8 K/min) and from 1000 K to 400 K, respectively. The inner-wall temperature at the crucible position was about 1000 K, which was confirmed in advance with a thermocouple. This CsI vaporization temperature was chosen not to run out of CsI in the crucible to keep the CsI vaporization rate nearly constant during the experiment, and to obtain adequate quantities of Cs and I samples for minimizing the uncertainty in ICP-MS described later in section 2.3. The inlet and extracted gas line including the aerosol spectrometer and cascade impactor were also heated to 400 K to prevent condensation of steam. Prior to the experiment, it was confirmed by the aerosol spectrometer that water droplets had not been formed in Ar/steam gas flow with 333 K dew point. During heating up of each furnace, 2 NL/min of Ar gas flow was provided inside the FP path. Then, when the maximum temperature in the electric resistance furnace reached about 900 K, steam was added to the Ar gas flow by the steam generator. The dew point of Ar/steam gas is about 333 K (20 vol% steam concentration). At that time, the temperature at the crucible position was about 200 K lower than maximum temperature in the electric resistance furnace [Citation25], about 700 K, which is lower than CsI melting point (about 900 K). The sampling of deposits in the TGT and airborne materials transported to the outlet of the TGT was performed for 2 h. After cooling down the furnaces, the sampling equipment was withdrawn.
Table 1. Experimental conditions of the reproductive experiment for CsI transport behavior
In addition, another experiment was conducted under the same conditions for the extraction of airborne materials. The airborne materials in the TGT were sampled from each extraction point at a flow rate of 2 NL/min. During the extraction, the gas was diluted to 5 NL/min and subjected to the aerosol measurement for 5 min. After the aerosol measurements for all the extraction points, the airborne materials at 400 K point were extracted at a flow rate of 2 NL/min, diluted to 4 NL/min and then flowed into the cascade impactor for 5 min. This temperature of the extraction point was chosen because sufficiently large number and stabilized size distribution of the aerosol particles, which are required for the characterization of aerosol particles, were expected to be obtained based on the results of previous experiment [Citation24]. The time interval between the extractions was set to be more than 1 min so that the gas in the FP path can be sufficiently replaced to form a steady flow of the airborne materials.
2.3. Post-experimental analyses
After the experiment, the deposits on each part of the TGT and the aerosol particles collected on the outlet filters and the cascade impactor plates were dissolved into NaOH solution (0.04 mol/L) for more than 18 h. After diluting these solutions and the liquid traps to appropriate concentration, the diluted solutions were subjected to the Inductively Coupled Plasma Mass Spectrometry (ICP-MS) for measurement of Cs and I amount. The ICP-MS was carried out by either an ELAN DRC-II (PerkinElmer) apparatus or an Agilent 8800 (Agilent Technologies) apparatus. Uncertainty of the measurement was estimated to be less than 5% (coefficient of variation) for both apparatuses based on the scattering of repeated measurement results made on some reference CsI samples.
The sampling coupons were examined with a JSM-IT100 (JEOL) Scanning Electron Microscope (SEM) equipped with an Energy Dispersive X-ray Spectroscopy (EDS) silicon drift detector. The voltage of the electron beam was set to 15 keV. X-ray Diffraction (XRD) analysis and Raman spectroscopy were also applied to evaluate the chemical forms of the deposits. The XRD analysis was performed with a Miniflex600 (Rigaku) at room temperature using a Cu-Kα spectrum over the 2Ɵ range from 3 to 80 degrees with a step size of 0.1 degrees and the scanning speed of 1 degree/min. The applied voltage and current were 30 kV and 15 mA, respectively. The Raman spectroscopy was performed with an NRS-3100 (JASCO) Raman micro-spectrometer which features a high performance 532 nm laser, thermoelectrically cooled Charge-Coupled Device (CCD) detector and an 1800 grooves/mm holographic grating. The spectral range in this study was from 100 to 4000 cm−1.
3. Results
3.1. Amount of Cs and I in the deposits and the airborne materials transported to the outlet of the TGT
The vaporized amount of CsI during the experiment was 0.64 g based on the change in the weight of CsI in the crucible. It was confirmed by the small-scale thermogravimetry-differential thermal analysis (TG-DTA) that the CsI vaporization rate during the experiment should be constant in the Ar/steam atmosphere. Thus, assuming that this weight loss was caused by a constant vaporization rate during the 2-h experiment, the vaporization rate can be calculated as 5.3 mg/min.
lists the amount of Cs and I in the deposits on each part of the TGT and the airborne materials collected by the outlet filters and the liquid traps. The I/Cs molar ratios were also listed. Noticeably large amount of Cs and I were observed in the deposits in the temperature range of 850–800 K. It seems that the I/Cs molar ratios of the deposits in the temperature region above 800 K show lower values than those of the lower temperature region, close to 1.0. The I/Cs molar ratio of the liquid traps were obviously higher than 1.0, indicating gaseous I formation. The gaseous I fraction, which was defined in this study as a ratio of I amount trapped by liquid traps to total amount of collected I, was 3.8 ± 0.3%. Standard deviation of 0.3% was calculated based on the law of propagation of errors using the coefficient of variation (5%) of each data listed in .
Table 2. Amount of Cs and I obtained by ICP-MS on each sample
3.2. Characteristics of the deposits
3.2.1. Morphologies and compositions of the deposits
The morphologies of the deposits and distribution of Cs and I changed according to the temperature. shows the representative morphologies of the deposits and distributions of Cs and I, which were observed by the SEM/EDS on the sampling coupons No. 3 (a), 9 (b), and 32 (c). Given an ideally linear temperature gradient in the TGT, the positions of these coupons correspond to the temperatures of 980 K, 860 K, and 400 K, respectively.
Figure 2. Results of SEM/EDS observations of the deposits on the sampling coupons (a) No. 3 (980 K), (b) No. 9 (860 K), and (c) No. 32 (400 K)
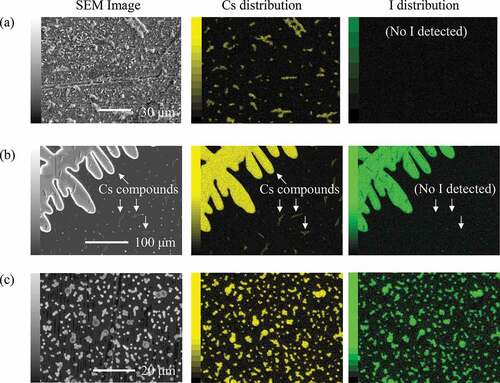
In the high-temperature region where the sampling coupon No. 3 was placed (980 K), Cs-containing deposits with irregular shape were observed as shown in (a). The result of EDS point analysis showed that these deposits contained no I. In the sampling coupon No. 9 which was placed in the temperature region where the large deposition amount was obtained (860 K), large deposits having the size of >100 µm were observed as shown in (b). These deposits seem to have been formed by agglomeration of condensed liquid materials onto the wall surface during the experiment and solidified along with the cooling down of the furnace. The EDS analysis revealed these deposits were composed of both Cs and I. On the other hand, there were some small deposits containing no I around the large ones. In the low-temperature region where the sampling coupon No. 32 was placed (400 K), numerous and nearly spherical particles having the diameters from 0.1 µm to several µm were observed as shown in (c). All of these particles contained both Cs and I.
3.2.2. Chemical forms of the deposits
shows the XRD patterns of the sampling coupons No. 3 (a), 9 (b), and 32 (c). The reference data for SUS 304 [Citation33] and CsI [Citation34] were also given. The sampling coupon No. 3 (980 K) showed only peaks derived from SUS 304. It seems that the peaks for the Cs and/or I compounds, which were observed in the XRD patterns of the sampling coupons No. 9 (860 K) and 32 (400 K), were derived only from CsI.
Figure 3. XRD patterns of the deposits on the sampling coupons (a) No. 3 (980 K), (b) No. 9 (860 K), and (c) No. 32 (400 K)
shows the Raman spectrum of the sampling coupon No. 9 (860 K). Three peaks positioned at 345 cm−1, 560 cm−1, and 690 cm−1 are considered to be derived from oxidized stainless steel [Citation35]. The other peaks positioned at 387 cm−1, 842 cm−1, 872 cm−1, and 886 cm−1 are consistent with those derived from Cs2CrO4 compound [Citation36]. In the other temperature regions, Raman spectra did not display any meaningful peaks for Cs and/or I compound.
Figure 4. Raman spectrum of the deposits on the sampling coupon No. 9 (860 K)
3.3. Characteristics of the airborne materials
3.3.1. Size distributions of the airborne aerosol particles
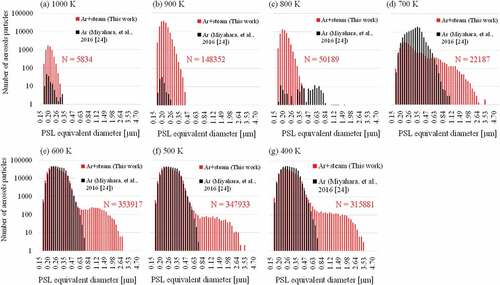
(a-g) shows the size distributions of the airborne aerosol particles at each 100 K point in the TGT. Those obtained in the previous experiment under the same experimental conditions except for the absence of the steam [Citation24] were also shown to see the effects of steam. Vaporized CsI amount in both experiments would be rather similar because the CsI vaporization rate would not strongly depend on the presence of steam, which was confirmed using TG-DTA. The generation of aerosol particles was rapidly accelerated at 800–700 K regardless of the presence of the steam. On the other hand, the following unique behavior could be seen for Ar/steam atmosphere. The aerosol particles grew up to the maximum diameter of about 3 µm at 700 K, which is three times bigger than that of Ar atmosphere. As a result, the bimodal distribution centered on two diameters, around 0.3 μm and 1.5 μm, was observed at lower temperature.
Figure 5. Size distributions of the airborne aerosol particles extracted from each 100 K point of the TGT (‘N = ’ in red letters means total number of aerosol particles in Ar/steam atmosphere)
3.3.2. Composition of the airborne materials
shows the cumulative amount of Cs and I in the airborne materials collected by each cascade impactor plate, the backup filter, and the liquid traps during 5-min-extraction from 400 K point of the TGT. The I/Cs molar ratios were also plotted. The airborne aerosol particles were collected mainly by the stages 3–6 of the cascade impactor (Dp50: 1.4–0.07 µm). The I/Cs molar ratios are obviously lower than 1.0 at the stages 1 and 2, while the ratios are nearly 1 at lower stages. Almost no gaseous I was trapped by the liquid traps, probably because of insufficient extraction time of 5 min for the collection of detectable amount of gaseous I.
Figure 6. Cumulative amount of Cs and I obtained by ICP-MS on each cascade impactor plate, the backup filter, and the liquid traps during 5-min-extraction from 400 K point of the TGT
4. Discussions
Regarding the physical effects on the CsI during transportation, one cause of the large deposits on the sampling coupon No. 9 (860 K) as shown in (b) is condensation. Previous studies also reported the CsI deposition due to condensation at similar temperature region in the TGT (950–800 K) under inert or steam-containing atmosphere [Citation28,Citation29]. Although the condensation temperature depends on the CsI vapor concentration, it can be said that the large amount of the deposits at the temperature range of 850–800 K in was caused by condensation on the wall surface. The other condensed CsI would be transported downstream as aerosol particles.
Regarding the chemical behavior of CsI during transportation, according to the I/Cs molar ratios of each sample listed in , a large part of released CsI seems to have transported without the change of its chemical form. On the other hand, as mentioned in section 3.1, small amount of gaseous I was formed and the gaseous I fraction was 3.8%. This result indicates that a part of CsI was changed into gaseous I due to chemical reactions during transportation. In the following sections, the detailed mechanisms of CsI transport and the associated gaseous I formation at each temperature region are discussed.
4.1. Gaseous phase chemical reaction during transportation in the high-temperature region (>900 K)
Gaseous phase chemical reaction in Cs-I-O-H system [Citation20,Citation21], which might have occurred mainly in the high-temperature region before condensation, is important for CsI transport behavior. In order to estimate the attribution of gaseous phase chemical reaction to the gaseous I formation, Cs and I chemical forms during transportation in the high-temperature region (>900 K) were estimated by two methods.
One was the chemical equilibrium calculation using Thermo-Calc software [Citation37] with SSUB4 substance thermodynamic database [Citation38]. The calculation was conducted for equilibrium gas compositions at 3 points in the TGT, namely at 1000 K point above the crucible and the following 1273 K and 1000 K points. In the other calculation method, chemical reaction kinetics was considered using the ECUME [Citation23]. The chemical reaction calculation was conducted using the chemical kinetics simulation software ANSYS CHEMKIN 18.2 [Citation39]. An ideal linear temperature distribution coupled with a simple flow pattern (plug flow) was assumed. As the inlet boundary conditions, chemical equilibrium composition above the crucible and the experimental flow rate, 2 NL/min, were given. The SSUB4 substance thermodynamic database [Citation38] was used to determine the chemical equilibrium compositions.
shows the calculated I chemical forms. The result of the chemical equilibrium calculation ( (a)) shows that about 2.5% of CsI was changed into other gaseous I species (hydrogen iodide (HI) and atomic I) at 1273 K. However, it almost completely changed into CsI or its dimer (Cs2I2) again and no other gaseous I species remained as transported to the lower temperature region of 1000 K. On the other hand, in the chemical reaction calculation ( (b)), approximately 1% of formed atomic I was transported downstream due to the kinetics limitation effects. Therefore, gaseous phase chemical reaction in Cs-I-O-H system and the kinetics limitation effects in this temperature region should partly attribute to the transport of gaseous I to the outlet of the TGT.
Figure 7. I chemical forms in the high-temperature region (>900 K) calculated by (a) chemical equilibrium calculation and (b) chemical reaction calculation
Another possible chemical reaction which may have occurred in this temperature region and attributed to the gaseous I formation was that including impurities possibly contained in the experimental system. As described in section 3.2, a part of Cs-containing deposits at the high-temperature region contained no I. These deposits were possibly formed by chemical reaction of unexpected impurities as contaminant in the carrier gas though the high purity (99.9999%) Ar gas was used in this study. The previous experiment also reported effects of impurities in the inert (N2) atmosphere [Citation28]. However, considering that the amount of Cs deposited in this temperature region was smaller than that of gaseous I in the liquid trap by about one order, the attribution of these impurities to the gaseous I formation should be very small and negligible in this study.
4.2. CsI vapor condensation and chemical reaction of the CsI deposits (850 – 800 K)
In this temperature region, the deposits containing no I were observed around the large ones ( (b)). The Raman spectrum of these deposits () showed the possible formation of Cs2CrO4 compound [Citation36]. These results show the possibility that a part of the gaseous I formation was attributed to the chemical reaction related to this formation of Cs2CrO4 compound.
The possibility of formation of Cs2CrO4 compound was confirmed based on the thermodynamic consideration. The Gibbs free energy of the formation reaction of Cs2CrO4 compound, for example, 4CsI(s) + Cr2O3(s) + 2.5O2(g) → 2Cs2CrO4(s) + 4I2(g), is negative. This means that the formation of Cs2CrO4 compound by the reaction of CsI deposits with surface of stainless steel could be favorable from a thermodynamic point of view.
The possibility of the chemical reaction of CsI deposits with surface of stainless steel was also confirmed by the formation of deposit without I only in small one as shown in (b). The high specific surface area of small deposits could enhance the reaction of CsI with surface of stainless steel, which might lead to the formation of deposits without I, namely deposits of Cs2CrO4 compound.
Therefore, the chemical reaction of the condensed CsI on the wall with surface of stainless steel to form Cs2CrO4 compound could be one of the mechanisms of the gaseous I formation.
4.3. Generation and transport behavior of CsI aerosol particles in low-temperature region (<800 K)
Although CsI deposition due to condensation was observed at the upstream of the 800 K extraction point, namely the temperature region of 850 K, rapid aerosol generation, and growth were observed at 700 K extraction point ( (d)) instead of 800 K. This is probably because the generated aerosol particles were smaller than the lower limit of detection by the aerosol spectrometer (0.2 μm) at 800 K and rapidly grew in the temperature region of 800–700 K. The bigger maximum diameter and the bimodal distribution of the aerosol particles for Ar/steam atmosphere shown in could be resulted from the following aerosol behavior including the hygroscopic growth [Citation40]. The result that the maximum size of aerosol particles reached to 3 µm at 700 K as shown in (f) means that the hygroscopic growth proceeded very rapidly in the temperature region of 800–700 K. From (e), more than 300,000 small aerosol particles were generated in the temperature region 700–600 K by the possible condensation of CsI vapor as is the case for Ar atmosphere. From (f) and (g), no agglomeration occurred below 600 K.
The I/Cs molar ratios of the aerosol particles collected from 400 K point on each cascade impactor plate () indicate that the I/Cs molar ratio of the larger aerosol particles was lower than 1.0 while that of the smaller ones was approximately 1.0. The Dp50 s of the stages 1–3 (>1.4 µm) indicate that the aerosol particles in the peak of larger particle diameter shown in (g) could be collected by these stages. It can be said that abundant steam was available for the chemical reaction with the aerosol particles collected at these stages because the larger particles were derived from those by hygroscopic growth in the temperature region in 800–700 K. This suggests that chemical reaction might have occurred between CsI aerosol particles and steam, which caused the gaseous I formation.
5. Conclusion
In order to clarify the mechanisms of CsI transport and associated gaseous I formation in the Reactor Coolant System (RCS), a reproductive experiment of CsI transport behavior was conducted using the TeRRa facility equipped with a thermal gradient tube (TGT). A large part of vaporized CsI was transported without the change of its chemical form, while small but meaningful amount of gaseous I was formed and transported to the outlet of the TGT. The results of detailed analyses of chemical/physical state of not only the deposits but also the airborne materials at each temperature region of the TGT suggested following gaseous I formation mechanisms.
During transportation in the high-temperature region above 900 K, gaseous I could be formed due to gaseous phase chemical reaction in Cs-I-O-H system and then transported downstream by the kinetics limitation effects.
In the temperature region of 850–700 K, gaseous I could be formed due to chemical reactions of condensed CsI on the wall with surface of stainless steel to form Cs2CrO4 compound and CsI aerosol particles with steam.
The amount of formed gaseous I obtained in this study was rather small: 3.8% of the total amount of collected I. However, the results of this study indicated the possibility that the gaseous I formation is enhanced by the chemical reactions mentioned above under the actual severe accident conditions where the steam concentration could be extremely high and widely varied in long term. Such chemical reactions would then significantly affect the distributions of Cs and I. Thus, in the validation and improvement of the base part, Cs-I-O-H system, of the FP chemistry database ECUME, these physical/chemical phenomena related to the CsI transport in the RCS should be appropriately considered. The results in this study would be the reference data for such validation and improvement, which make the database more reliable towards more complex system, e.g. B/Mo-including system.
Acknowledgments
This work was done in the framework of the collaboration between JAEA and VTT. The collaboration between the two institutes was supported by the Academy of Finland, project Number 294995.
The authors express their sincere gratitude to Mr. Juntaro Takada and Mr. Kunihiro Sumiya for their technical support on the operation of the TeRRa facility and Dr. Kunihisa Nakajima for fruitful discussion and comments on the thermodynamic calculations. We also thank the members of Corrosion Resistant Material Development Group of Japan Atomic Energy Agency for use of their apparatuses and technical support on SEM/EDS analysis and Raman spectroscopy.
Disclosure statement
No potential conflict of interest was reported by the authors.
References
- Nakamura H, Arai K, Oikawa H, et al. New AESJ thermal-hydraulics roadmap for LWR safety improvement and development after Fukushima accident. Proc. NURETH-16; 2015 Aug 30-Sep 4; Chicago (US).
- Suehiro S, Sugimoto J, Hidaka A, et al. Development of the source term PIRT based on findings during Fukushima Daiichi NPPs accident. Nuclear Engineering and Design. 2015 May;286:163–174.
- Sehgal BR. Nuclear safety in light water reactors. Waltham MA: Academic Press; 2012 425–517. 5, Fission Product Release and Transport.
- Haste T, Giordano P, Herranz L, et al. SARNET integrated European Severe Accident Research—Conclusions in the source term area. Nuclear Engineering and Design. 2009 Dec;239(12):3116–3131.
- Klein-Heßling W, Sonnenkalb M, Van Dorsselaere J-P, et al. Ranking of severe accident research priorities. Proc. ERMSAR-2012; 2012 Mar 21-23; Cologne (Germany).
- Klein-Heßling W, Sonnenkalb M, Jacquemain D, et al. Conclusions on severe accident research priorities. Annals of Nuclear Energy. 2014 Dec;74:4–11.
- Magallon D, Mailliat A, Seiler J-M, et al. European expert network for the reduction of uncertainties in severe accident safety issues (EURSAFE). Nuclear Engineering and Design. 2005 Feb;235(2–4):309–346.
- Kajimoto M, Muramatsu K, Watanabe N, et al. Development of THALES-2, a computer code for coupled thermal-hydraulics and fission product transport analyses for severe accident at LWRs and its application to analysis of fission product revaporization phenomena. Proc. Int. Topical Mtg. on Safety of Thermal Reactors; 1991 Jul 21-25; Portland (US).
- Soffer L, Burson SB, Ferrell CM, et al. Accident source terms for light-water nuclear power plants. US: US Nuclear Regulatory Commission; 1995. (Report no. NUREG-1465).
- Zheng X, Itoh H, Tamaki H, et al. Source term uncertainty analysis: probabilistic approaches and applications to a BWR severe accident. Mechanical Engineering Journal. 2015 Oct;2(5):1–14.
- Grégoire A-C, Kalilainen J, Cousin F, et al. Studies on the role of molybdenum on iodine transport in the RCS in nuclear severe accident conditions. Annals of Nuclear Energy. 2015 Apr;78:117–129.
- McFarlane J, Wren JC, Lemire RJ. Chemical speciation of iodine source term to containment. Nuclear Technology. 2002 May;138(2):162–178.
- Gouëllo M, Hokkinen J, Kärkelä T, et al. A Scoping Study of the Chemical Behavior of Cesium Iodide in the Presence of Boron in the Condensed Phase (650°C and 400°C) Under Primary Circuit Conditions. Nuclear Technology. 2018 Jul;203(1):66–84.
- Minato K. Thermodynamic analysis of cesium and iodine behavior in severe light water reactor accidents. Journal of Nuclear Materials. 2015 Nov;185(2):154–758.
- Miwa S, Yamashita S, Osaka M. Prediction of the effects of boron release kinetics on the vapor species of cesium and iodine fission products. Progress in Nuclear Energy. 2016 Sep;92:254–259.
- Vandeputte R, Khiri D, Lafont C, et al. Theoretical investigation of thermochemical properties of cesium borates species. Journal of Nuclear Materials. 2019 Apr;517:63–70.
- Gauntt RO. Synthesis of VERCORS and Phebus Data in Severe Accident Codes and Applications. US: Sandia National Laboratories; 2010. ( (Report no. SAND2010-1633)).
- Di Lemma FG, Nakajima K, Yamashita S, et al. Surface analyses of cesium hydroxide chemisorbed onto type 304 stainless steel. Nuclear Engineering and Design. 2016 Aug;305:411–420.
- Di Lemma FG, Nakajima K, Yamashita S, et al. Experimental investigation of the influence of Mo contained in stainless steel on Cs chemisorption behavior. Journal of Nuclear Materials. 2017 Feb;484:174–182.
- Cantrel L, Louis F, Cousin F. Advances in mechanistic understanding of iodine behavior in PHEBUS-FP tests with the help of ab initio calculations. Annals of Nuclear Energy. 2013 Nov;61:170–178.
- Cantrel L, Krausmann E. Reaction kinetics of a fission-product mixture in a steam-hydrogen carrier gas in the Phebus primary circuit. Nuclear Technology. 2003 Oct;144(1):1–15.
- Miwa S, Nakajima K, Miyahara N, et al. Development of fission product chemistry database ECUME for the LWR severe accident. Mechanical Engineering Journal; 2020 Jun; 7(3):19-00537.
- Miyahara N, Miwa S, Horiguchi N, et al. Chemical reaction kinetics dataset of Cs-I-B-Mo-O-H system for evaluation of fission product chemistry under LWR severe accident conditions. Journal of Nuclear Science and Technology. 2019 Nov;56(2):228–240.
- Miyahara N, Miwa S, Nakajima K, et al. Development of experimental and analytical technologies for fission product chemistry under LWR severe accident condition. Proc. WRFPM-2017; 2017 Sep 10-14; Jeju Island (Korea).
- Miwa S, Takase G, Imoto J, et al. Boron chemistry during transportation in the high temperature region of a boiling water reactor under severe accident conditions. Journal of Nuclear Science and Technology. 2019 Sep;57(3):291–300.
- Girault N, Payot F. Insights into iodine behaviour and speciation in the Phébus primary circuit. Annals of Nuclear Energy. 2013 Nov;61:143–156.
- Gouello M, Mutelle H, Cousin F, et al. Analysis of the iodine gas phase produced by interaction of CsI and MoO3 vapours in flowing steam. Nuclear Engineering and Design. 2013 Oct;263:462–472.
- Hidaka A, Igarashi M, Hashimoto K, et al. Experimental and analytical study on the behavior of cesium iodide aerosol/vapor deposition onto inner surface of pipe wall under severe accident conditions. Journal of Nuclear Science and Technology. 2016 Oct;32(10):1047–1053.
- Maruyama Y, Shibazaki H, Igarashi M, et al. Vapor condensation and thermophoretic aerosol deposition of cesium iodide in horizontal thermal gradient pipes. Journal of Nuclear Science and Technology. 1999 May;36(5):433–442..
- Tang IN, Aronson S, Munkelwitz HR, et al. A study of fission product transport and deposition using thermochromatography. Proc. Japan-US Semininar on HTGR Safety Technol. Vol. II; 1977 Sep 15-16; New York (US).
- Zinkle SJ, Was GS. Materials challenges in nuclear energy. Acta Materialia. 2013 Feb;61(3):735–758.
- Ranz WE, Wong JB. Impaction of Dust and Smoke Particles on Surface and Body Collectors.. Industrial and Engineering Chemistry. 1952 Jun;44(6):1371–1381.
- Pfoertsch D, Ruud C. Penn State University, University Park, Pennsylvania, US, ICDD Grant-in-Aid, ICCD Index No. 32-1254, 1980; 1272.
- Swanson HE, Fuyat RK, Ugrinic GM. Standard X-ray diffraction powder pattern. National Vureau of Standards Circular. 1955 Mar;539(6):47.
- Gardiner DJ, Littleton CJ, Thomas KM, et al. Distribution and characterization of high temperature air corrosion products on iron-chromium alloys by Raman microscopy. Oxidation of Metals. 1987 Feb;27(1–2):57–72.
- Robert LC, Clark EB. Lase-Raman spectra of crystalline K2CrO4, Rb2CrO4 and Cs2CrO4. Spectrochimica Acta. 1971 Apr;27A:569–580.
- Sundman B, Jansson B, Andersson J-O. The Thermo-Calc databank system. Calphad. 1985;9(2):153–190.
- Dinsdale AT. SGTE data for pure elements. Calphad. 1991;15(4):317–425.
- ANSYS. 18.2 Chemkin-Pro Theory manual. San Diego: ANSYS, Inc.; 2017.
- Jokiniemi J. The growth of hygroscopic particles in a containment vessel. Journal of Aerosol Science. 1988;19(7):1347–1350.