
 ?Mathematical formulae have been encoded as MathML and are displayed in this HTML version using MathJax in order to improve their display. Uncheck the box to turn MathJax off. This feature requires Javascript. Click on a formula to zoom.
ABSTRACT
Air dose rates within a range of 80 km from the Fukushima Dai-ichi Nuclear Power Plant measured via car-borne surveys using the KURAMA systems from 2011 to 2018 were analyzed. The ratio of the air dose rates relative to the first car-borne survey was 0.08 over a period of seven years, indicating a much more rapid decrease than that estimated by the physical decay of radiocesium (0.3). Differences in the decreasing trends of the air dose rates among the land-use categories and evacuation order areas were examined. The ecological half-lives were evaluated according to the land-use categories in each evacuation order area. To model the acceleration of the decrease in the air dose rates observed in the evacuation order area, we modified the bi-exponential curve formula of ecological half-life and introduced the two-group model. The ecological half-life of the fast components in the evacuation order area of ‘zone in preparation for the lifting of the evacuation order’ evaluated using the two-group model after 2013 were 0.5–1 y, which were much shorter than those before 2013 (2–3 y).
1. Introduction
Following the release of radioactive substances resulting from the Fukushima Dai-ichi Nuclear Power Plant (FDNPP) accident in March 2011, significant efforts were made to examine the radiologic deposition status and air dose rate distribution. A series of investigations, known as the ‘Fukushima mapping project’ [Citation1,Citation2], have been performed to evaluate the air dose rate distribution [Citation3–8], the spatial distribution of radionuclides deposited onto the ground [Citation9], and depth distribution of radionuclides in the ground [Citation10]. In the field of radioactive plume discharged by the FDNPP, new insights are being gained from recent studies on the types and quantities of discharged radionuclides [Citation11–13].
A car-borne survey is an efficient technique for measuring air dose rates over a wide area. It has been carried out since the first campaign of the Fukushima mapping project until the latest one [Citation1,Citation2]. The Kyoto University RAdiation MApping (KURAMA) system [Citation14], developed by the Kyoto University Research Reactor Institute, was used in the first and second car-borne surveys in the Fukushima mapping project in 2011. A modified KURAMA system, KURAMA-II [Citation15], was introduced in the third car-borne survey in March 2012, and has since been used in the project. As part of the Fukushima mapping project, 17 large-scale car-borne survey campaigns were carried out till December 2018; the results of the analyses of car-borne surveys conducted till November 2016 have already been reported [Citation4].
Ecological half-lives are parameters used in an empirical formula that models the decreases in the air dose rate generally using a bi-exponential model [Citation16–20]. Kinase et al. [Citation19] analyzed the car-borne survey data up to the fiscal year (FY) 2014, and evaluated the fast decreasing components of the ecological half-lives. Andoh et al. [Citation4] analyzed the measurement results of 13 car-borne surveys in the Fukushima mapping project, conducted from June 2011 to November 2016, and evaluated the fast and slow decreasing components of the ecological half-lives. However, the evaluation of the ecological half-lives in the evacuation order area was difficult, as the decrease in the air does rate was not constant due to human activity. Therefore, this paper proposes a new approach to obtain a fast decreasing component for such cases.
Herein, we analyze the measurement results obtained up to 2018 (in the roughly seven-and-a-half years following the FDNPP accident), including those in the two years following the analyses conducted by Andoh et al. [Citation4], to evaluate the decreasing trends of the air dose rates within a range of 80 km from FDNPP. In addition, we re-evaluate the ecological half-lives using the measured data, including the newly obtained ones.
2. Measurement and analysis method
2.1. Measurement of air dose rate and analysis of decreasing Trends
The measurement periods of each car-borne survey analyzed in this study are listed in . The measurement areas included in the car-borne surveys in the Fukushima mapping project are widely dispersed in eastern Japan (a maximum of 11 prefectures). Measurements in the first, fourteenth and sixteenth car-borne surveys were, however, focused on the regions within 80 km from the FDNPP (hereafter, the ‘80 km region’).
Table 1. Summary of car-borne survey period analyzed in this study
The car-borne surveys in the Fukushima mapping project were conducted using the KURAMA systems (KURAMA and KURAMA-II). KURAMA was used only in the first and second car-borne surveys; thereafter, KURAMA-II was employed in the third (March 2012) and subsequent surveys. The specifications and detailed characteristics of these systems are available in the references [Citation14,Citation15,Citation21]. The output pulse height spectra were weighted by a spectrum-dose conversion operator (G(E) function) [Citation22] to calculate the ambient dose equivalent rate H*(10) (μSv/h). Herein, the obtained value is termed the air dose rate. The air dose rates were automatically measured every three seconds (in the first and second surveys, every five to ten seconds) and sent to a data collection server, along with the geographic coordinates information, recorded by Global Positioning System. At the end of each measurement period, the measured regions were divided into 100 m × 100 m meshes (hereafter, ‘100 m mesh’), and the measured data were expressed as representative values of the meshes by taking the average of the data in the meshes, to reduce the statistical errors. Herein, we analyzed the data obtained primarily in the 80 km region, where the influence of radiocesium emitted by the accident was relatively significant. The air dose rate maps within the 80 km region obtained from the measurements after a previous study [Citation4], from the fourteenth to seventeenth car-borne surveys, are shown in the supplemental material (Figures S-1 to S-4).
The decreases in the air dose rate was evaluated as the ratios of the air dose rates in each car-borne survey to that in the first survey (normalization period). Hence, the air dose rates resulting from the natural background radiation evaluated separately for each city, town, and village [Citation23] were deducted from the results of each 100 m mesh. The ratios were calculated with respect to each 100 m mesh, and then were averaged (hereafter, ‘averaged ratio’) across the overall 80 km region, or in a specific area, e.g., for categories related to land use and evacuation order. Considering the decay of radiocesium over a period of seven years (from the first survey in 2011 to the final survey in 2018), air dose rate data greater than 0.2 µSv/h (after deducting the background radiation) measured in the first car-borne survey were used for subsequent calculations to avoid fluctuations in low air dose rates.
The decrease in air dose rate, excluding the physical decay of radiocesium, depends on the environmental conditions, for example, the removal of radiocesium by the weathering effect and human activities. Land use is considered a major parameter that affects the decrease in air dose rate, as radiocesium migration is quite different according to land use. The 100 m meshes fixed on the roads on which the car-borne surveys were performed were classified into different land-use categories, i.e., forest, rice field, urban area, and others (agricultural land, road, river and lake, wasteland, sea shore, rail way, golf course, and other lands), based on the National Land Numerical Information from the Ministry of Land, Infrastructure and Transport [Citation24]. The air dose rates were categorized according to specific land-use.
The evacuation order area category has a significant relation with the frequency of human activities, because the entry restriction differs according to the evacuation order classification. The evacuation order areas were classified into three areas by the Japanese Government, based on the radiation level: ‘zone in preparation for the lifting of the evacuation order,’ ‘residence restriction area,’ and ‘difficult-to-return zone.’ The classification was modified according to the decrease in radiation level. The boundary for each evacuation order area (declared on 5 September 2015 [Citation25]), which was used for the analyses in this study, is shown in the supplemental material (Figure S-5). Herein, the three categories of the evacuation order areas are represented as the evacuation order areas of Level-1, Level-2, and Level-3. The 100 m meshes, lying on the roads on which the car-borne surveys were performed were classified as evacuation order areas. About 90% of the 100 m meshes in all areas of the 80 km region analyzed in this study were outside the evacuation order area. The ratios of the 100 m meshes in each evacuation order area to the total 100 m meshes in the entire evacuation order areas were approximately equal (approximately 30%), except for that in the third car-borne survey, which was performed by local governments, where the ratios of the evacuation area of Level-3 were very small. The data from the third car-borne survey in the evacuation order area of Level-2 (urban area) and Level-3 (each land-use category) were not included in our analyses, as the number of 100 m mesh data was less than 50.
Andoh et al. [Citation4] compared the changing trends of the averaged ratios between each evacuation order area, introducing land-use factors to consider the effect of the differences among the land-use categories. In this study, the changing trends of the averaged ratios were evaluated with respect to each land-use category in each evacuation order area to investigate the changing trends in more detail.
2.2. Evaluation of ecological half-life
A decrease in the air dose rates, excluding physical decay of radiocesium, is expressed using a bi-exponential formula with the fast and slow decreasing components of the ecological half-lives [Citation19] (hereafter, ‘fast component’ and ‘slow component’, respectively):
where r(t) is the air dose rate ratio relative to the normalization period at elapsed time t, relative to the physical decay of radiocesium for the same period, which is corresponding to the environmental effect on the decrease of the air dose rate (hereafter, ‘environmental effect’). Herein, t is the elapsed time from the first car-borne survey (8 June 2011). The background (natural gamma rays) was deduced from the air dose rate. T1 and T2 are the half-lives of the fast and slow components, respectively, and p is a coefficient that indicates the fraction of the fast and slow components. In this study, the averaged ratios evaluated in the overall 80 km region, outside the evacuation order area, in the entire evacuation order areas (summation of areas of the three levels of evacuation order), and in each evacuation order area were used to obtain the parameters of the bi-exponential formula. The data in these regions were subdivided into three major land-use categories – forest, rice field, and urban area.
For the measurements of car-borne surveys within the mapping projects, the air dose rates were measured on paved roads; the measured air dose rates were affected by disturbances linked to human activity (including decontamination). Decontamination works have been actively carried out since a few years following the FDNPP accident. The air dose rate decreased after the decontamination [Citation2,Citation7], which accelerated the decrease in air dose rates measured in the evacuation order areas [Citation4]. In such a case, the fast component was not constant, and it was difficult to determine the fast and slow components in the evacuation order areas [Citation4]. Due to errors in the fitting procedures within the evacuation order areas (the entire evacuation order area and each level of evacuation order areas) using the bi-exponential model, the evaluation of the ecological half-lives was also difficult in this study. It was assumed that the decreasing rate of the air dose rate varied irregularly, and as hence, distinguishing the fast and slow components was difficult. For example, the decrease in the air dose rates due to the fast component began soon after the deposition, whereas the measured data indicate that a rapid decrease in air dose rates began a few years after the accident due to the impact of human activities. The slow component is a long time-scale change caused by the elimination processes in the local environment [Citation19], which is relatively stable. The weathering effect is a dominant factor that decreases the air dose rate, except for the physical decay of radiocesium [Citation26], and the effect in the evacuation order area is considered to be similar to that outside the area. Andoh et al. [Citation4] reported that the slow components in the whole area were similar to those in the evacuation order area of Level-3. Herein, we assumed that the slow components in the evacuation order area are similar to those in the overall 80 km region, and T2, obtained in the fitting procedure for the overall 80 km region was used for the analyses regarding evacuation order areas; that is, the fitting parameters in EquationEquation (1)(1)
(1) were p and T1.
To model the acceleration of the decrease in the air dose rates observed in the evacuation order area, it was necessary to modify the fast component of EquationEquation (1)(1)
(1) . We introduced the following equations for the data prior to, and following, an acceleration in the air dose decrease:
where p’ and T’1 are the modified coefficient of the fast component and the half-life of the fast component, respectively; t is the elapsed time from t0 (8 June 2011); and t1 is the cut-off period of prior to, and following, the acceleration. We assumed that thehalf-life of the slow component (T2) and the coefficient of the slow component (1–p) were not affected by the acceleration in the decrease in the air dose rates. The coefficient p in EquationEquation (2)(2)
(2) is enlarged by the acceleration to become p’ in EquationEquation (3)
(3)
(3) , which indicates that p’ + (1–p) could be over 1. Hence, we refer to this model as the ‘two-group model.’ It is applied in cases where the fitting parameters cannot be obtained using EquationEquation (1)
(1)
(1) due to the acceleration of the decrease in the air dose rates. In addition, the T2, obtained in the fitting procedure for the overall 80 km region using EquationEquation (1)
(1)
(1) , was used for the analyses in the evacuation order area (as noted), and the fitting parameters for EquationEquations (2)
(2)
(2) and (Equation3
(3)
(3) ) were p, p’, and T’1.
3. Results and discussion
3.1. Decreasing trend of air dose rate
3.1.1. Within 80 km of FDNPP and Dependent on land-use category
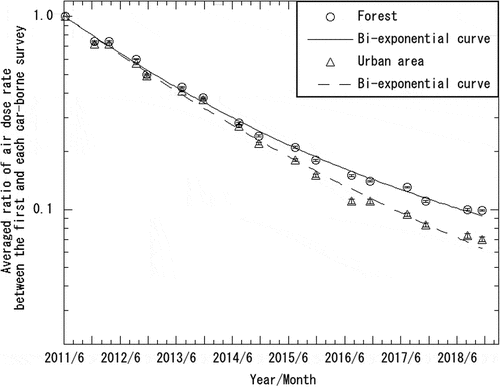
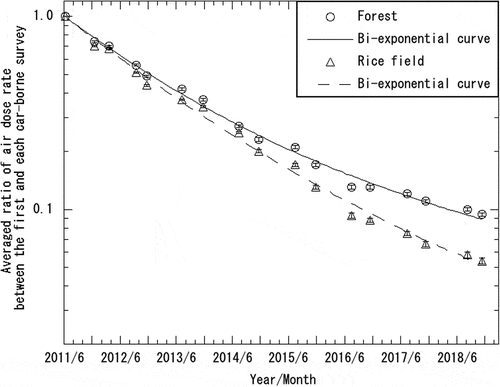
shows the changing trend of the averaged ratios with respect to the overall area in the 80 km region and for each land-use category. It also depicts the change in the air dose rates due to the physical decay of radiocesium. The error bars indicate the standard errors of the averaged ratios (applied similarly hereafter). The trend shown in the figure is consistent with that reported in a previous study [Citation4]; the rate of decrease in the air dose rate was lowest in the forest and highest in the urban area, among other regions. The obtained averaged ratios are summarized in . The averaged ratio in the overall 80 km region became 0.08 over a period of seven years from the first to the seventeenth car-borne survey, which is very small compared to the ratio predicted from the physical decay of radiocesium (0.3). Considering the last two years after 2016, though the decreasing rate in all land-use categories was moderate, the averaged ratios decreased by 23%, which was somewhat faster than the decrease caused by the physical decay of radiocesium (18%). The decrease in the air dose rates in the land-use category of others was similar to that in the rice field category. The others category is excluded in the subsequent analyses herein.
Figure 1. Changing trends of the air dose rates measured by car-borne surveys in the overall 80 km region for each land-use category. The measurement date for each survey indicated in the horizontal axis represents the middle of the measurement period (similarly affected hereafter)
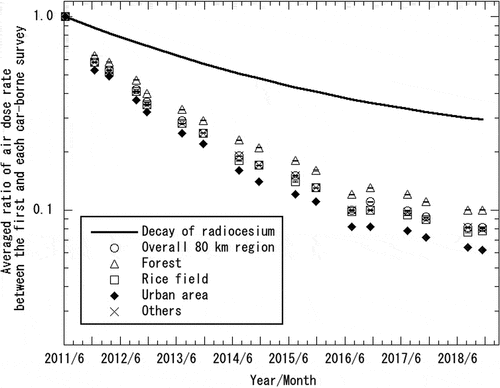
Table 2. Decreasing tendencies of averaged ratios in 80 km region relative to the first car-borne survey evaluated using overall 80 km region and that classified in each land use category
3.1.2. Dependent on evacuation order areas
) show the changing trends of the averaged ratios relative to the first car-borne survey in the 80 km region in each evacuation order area, comparing the forest, rice field, and urban area land-use categories. The obtained averaged ratios with respect to each evacuation order area are summarized in Tables S-1–S-3.
Figure 2. Changing trends of the air dose rates measured by car-borne surveys in the 80 km region, according to land-use categories in each evacuation order area
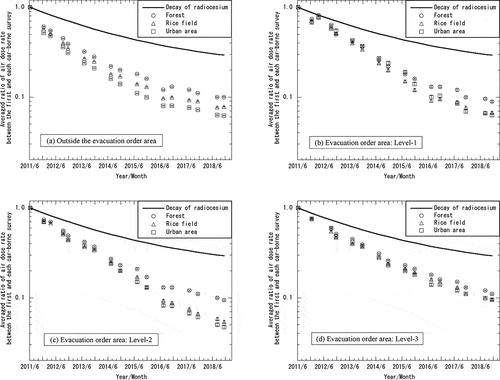
The trend of the averaged ratios was observed outside the evacuation order area, where the urban area represented the fastest and the forest area represented the slowest, among the categories ()). Some differences were observed in the changing trends among the evacuation order areas as follows. A rapid decrease in the air dose rate was observed in the urban area, occurring from the early period of the accident, but only outside the evacuation order area. In the evacuation order area of Level-1, the decreasing rate of the air dose rate in rice field was faster than the other land use categories from 2013 to 2016 ()). In the evacuation order area of Level-2, the decreasing rate of the air dose rate in the rice field and urban area land-use categories are similar throughout the whole period, and are faster than that in forest ()). Note that the decreasing rate of the air dose rate in urban area accelerated in the evacuation order areas of Level-2, which resulted in the faster decreasing rate than the others after 2015. The effect of human activity, including decontamination works that started around July 2012− October 2013 in these areas, is considered the reason for the acceleration of the decrease in the air dose rate, as is noted in Andoh et al. [Citation4]. A slight difference was observed amang the land-use categories in the evacuation order area of Level-3 ()), where human activity (including decontamination works) occurred less often than that in the other areas. However, decreasing rate was lowest in the forest land-use category, which was also the case in other evacuation order areas. In addition, a statistical test (Kruskal l–Wallis test) showed significant differences (p < 0.01) between the forest and rice field (or forest and urban area) land-use categories after the fifth car-borne survey (November 2012) with respect to the evacuation order area of Level-3.
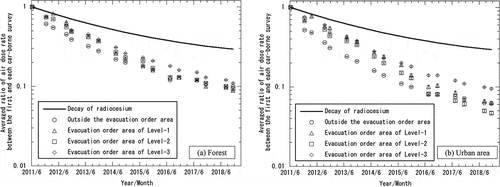
shows a comparison of the decreasing trends of the air dose rates with respect to the typical land-use categories (forest and urban area land-use categories) among the different evacuation order areas. In early periods after the accident, the decreasing rate outside the evacuation order area was higher than that in the other areas, both in forest and urban area land-use categories. The decreasing rate in the evacuation order areas of Level-3 is the slowest on the whole in both the land-use categories. ) shows that the decrease in the air dose rates in the evacuation order area of Level-2 was faster than those in the other areas after 2016. This could be a result of the vigorously performed decontamination works in the area, which caused lifting of the evacuation order in the evacuation order area of Level-2 area from July 2016 to April 2017 (e.g., Iitate Village, Minamisouma City, Namie Town, and Tomioka Town).
Figure 3. Comparison of the changing trends of the air dose rates measured by car-borne surveys in the 80 km region between each evacuation order area with respect to the forest and urban area land-use categories
3.2. Ecological half-life
3.2.1 The overall 80 km region and outside the evacuation order area
The ecological half-lives of the fast and slow components and the fractions of fast components with respect to the overall 80 km region and outside the evacuation order area are listed in . The table shows that the half-lives of both the fast and slow components tended to be the shortest and the fraction of the fast components the largest in the urban area category, as the surroundings in urban areas were artificial [Citation17]. The fraction of the fast components was smallest and the half-lives of both the fast and slow components were longest in the forest. This indicates that the migration of radiocesium was slowest in the forest.
Table 3. Ecological half-lives evaluated using car-borne survey data overall 80 km region and outside the evacuation order area
The ecological half-lives evaluated in each land-use category in the overall 80 km region were found to be in good agreement with the results reported by Andoh et al. [Citation4], although the slow components evaluated in the forest was longer in this study (8.5 y) than that in the previous study (6.4 y) [Citation4]. It is assumed that the longer fitting range adopted in this study resulted in more precise values. Based on this result, there is a need to further investigate the slow components. The fractions of the fast component in each land-use category outside the evacuation order area (0.43–0.52) were smaller than those reported by Jönsson et al. (0.79 on average) [Citation18] and Kinase et al. (0.66–0.78) [Citation19]. It is considered that the averaged ratios were normalized in the first car-borne survey (8 June 2011) in this study, which was about three months after the major release of radiocesium on 15 March 2011, i.e., elapsed time t in EquationEquation (1)(1)
(1) differs from that in other studies.
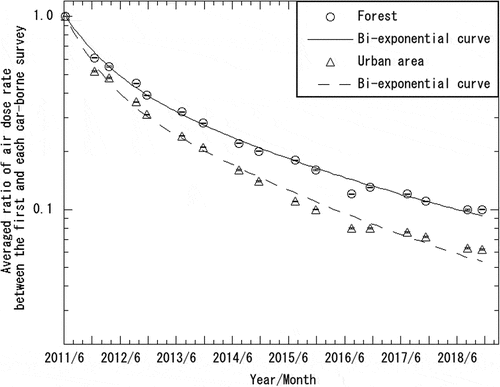
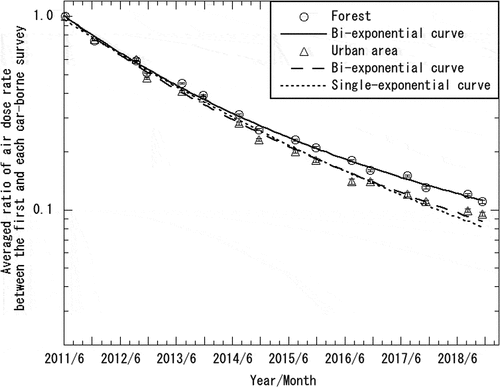
Representative curves (forest and urban area land-use categories) comparing the averaged ratios and bi-exponential curves evaluated outside the evacuation order area are shown in . The error bars indicate the standard errors of the averaged ratios (applied similarly hereafter). The figure shows a good agreement between the measured values and evaluated bi-exponential curves. However, a small discrepancy between the measured values and the fitted curve was observed in the urban area after 2015. Evaluating the ecological half-lives was slightly difficult because the decreasing rate of the air dose rates was not constant outside the evacuation order area, where human activities differ among municipalities.
Figure 4. Comparison of the averaged ratios and bi-exponential curves evaluated by the ecological half-lives outside the evacuation order area
3.2.2 Inside the Evacuation Order Area
In this section, as noted above, the ecological half-lives inside the evacuation order areas (the entire evacuation order area and areas of each level of the evacuation order) are analyzed under the assumption that the ecological half-lives of the slow components were 8.5, 6.3, and 5.1 y, as evaluated for the forest, rice field, and urban area in the overall 80 km region, respectively.
3.2.2.1. Entire evacuation order area
The fast components inside the evacuation order area were evaluated; the obtained results are listed in . Obvious discrepancies beyond the standard errors can be observed in the ecological half-lives of the fast components, comparing those outside the evacuation order area (0.4–0.5 y; ) and those within the entire evacuation order area (2.0–2.7 y; ). These reflect the differences related to human activity based on entry restrictions. The ecological half-lives of the fast components within the entire evacuation order area evaluated in this study occurred over a longer period than those evaluated by Kinase et al. (1.0–1.1 y) [Citation19]. The following differences between this study and that conducted by Kinase et al. [Citation19] are considered. a) The end period of measurement data used by Kinase et al. was FY2014, whereas it was FY2018 in this study. b) Kinase et al. [Citation19] evaluated the fitting parameters by median of the fitted values, resulting in half-lives smaller than those obtained by us (averaged ratios) because the half-life of the fast component follows a log-normal distribution. c) The data analyzed by Kinase et al. [Citation19] contained 20 data sets (from August 2011 until January 2015) in the evacuation order areas, which were not included in our study.
Table 4. Ecological half-lives evaluated using car-borne survey data inside the evacuation order area
Representative curves (the forest and urban area land-use categories) comparing the averaged ratios and bi-exponential curves are shown in , where good agreement was observed between the measured values and evaluated bi-exponential curves.
Figure 5. Comparison between the averaged ratios and bi-exponential curves, evaluated by the ecological half-lives for the entire evacuation order area
3.2.2.2. Evacuation order area of level-1
Although we employed the ecological half-life of the slow components evaluated in the overall 80 km region as the components in the evacuation order area, we were unable to obtain the fast components of EquationEquation (1)(1)
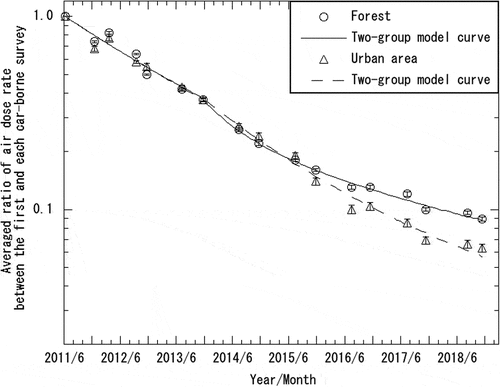
(1) with respect to the evacuation order area of Level-1, due to an error in the fitting procedure or a considerably large standard error. The decreasing trends of the air dose rate ratios relative to the physical decay of radiocesium, the environmental effect, with respect to the evacuation order area of Level-1 and for each land-use category is shown in . shows that the decreasing of the environmental effect in all the cases of the land-use categories accelerated after 2013. Therefore, we employed the two-group model to the evacuation order area of Level-1.
Figure 6. Changing trends of the air dose rates ratios relative to the physical decay of radiocesium for the evacuation order area of Level-1
In this case, the data used for the fitting procedure were divided into two groups: a) data up to the seventh car-borne survey conducted in November 2013 and b) data after the seventh car-borne survey. EquationEquation (2)(2)
(2) was used for the data up to the seventh car-borne survey, whereas EquationEquation (3)
(3)
(3) was used for data after the seventh car-borne survey. We chose the cutoff between the two groups because the decontamination works started around August 2012− October 2013 in the municipalities located inside the evacuation order areas of Level-1 [Citation27], and the acceleration of the decreasing trend of the air dose rates was observed after the period, as shown in . The values of t1 in EquationEquations (2)
(2)
(2) and (Equation3
(3)
(3) ) were determined by searching the intersection point of the fitted lines of the equations at which the fast decreasing components prior to, and following, an acceleration in the air dose decrease were consistent.
The ecological half-lives in the evacuation order area of Level-1 were successfully evaluated using the two-group model. The evaluated parameters of the fast components are listed in . The ecological half-life of the fast components after 2013 showed a period of 0.5–1 y, which was significantly shorter than those up to 2013 (2–3 y). Although there was a significant standard error in the fraction of the fast component after 2013 for the forest, the error in the fitting procedure was improved when the two-group model was employed. The two-group model improved the evaluation of the fast component, despite the acceleration observed in the decrease in the air dose rate. As shown in , the curves obtained from the model are in good agreement with the measured data overall. In addition, the coefficients of determination for the evaluated curves were 0.94, 0.98 and 0.98 with respect to the forest, rice field, and urban area land-use categories, respectively.
Figure 7. Comparison of averaged ratios between the measured values and two-group model curves, evaluated by the ecological half-lives for the evacuation order area of Level-1
3.2.2.3. Evacuation order area of level-2
The ecological half-lives were obtained using the bi-exponential model (EquationEquation (1)(1)
(1) ) for the forest and rice field land-use categories in the evacuation order area of Level-2. Even though the two-group model was employed in the urban area, where the fitting procedure with EquationEquation (1)
(1)
(1) yielded an error, we were unable to obtain the fast components. It was considered that the two-group model was not applicable for this case because the changing of the air dose rate was complicated, as shown in and 3.
The evaluated parameters of the fast components are also listed in . compares the averaged ratios and bi-exponential curves with respect to the forest and rice field land-use categories. This figure indicates a good agreement between the measured data and evaluated bi-exponential curves overall.
Figure 8. Comparison of averaged ratios between the measured values and bi-exponential curves, evaluated by the ecological half-lives for the evacuation order area of Level-2
3.2.2.4. Evacuation order area of level-3
The ecological half-lives were obtained using the bi-exponential model (EquationEquation (1)(1)
(1) ) for each land-use category in the evacuation order of Level-3. The evaluated parameters of the fast components are listed in . The evaluated bi-exponential curves are in good agreement with the measured data overall, as shown in .
The ecological half-life of the fast components in the evacuation order area of Level-3 showed a shorter period (0.9–1.4 y) than those in the evacuation order area of Level-2 (about 2 y); however, the human activity in the evacuation order area of Level-3 was limited compared to that of Level-2. The fraction of the fast components evaluated in the evacuation order area of Level-3 was, however, much smaller (0.2–0.3) than those evaluated in Level-2 (0.5–0.8); which indicates that the slow components were dominant in the decrease in the air dose rates in the evacuation order area of Level-3. In addition, the fraction of the fast components in the urban area was small, indicating difficulty in distinguishing between fast and slow components; thus, a single exponential curve can be employed for the ecological half-life. The fitting of a single exponential curve to the data resulted in an ecological half-life of 4.2 ± 0.2 y, which indicates a slight discrepancy between the bi-exponential and single exponential curves, as shown in .
Figure 9. Comparison of averaged ratios between the measured values and bi/single-exponential curves evaluated by the ecological half-lives for the evacuation order area of Level-3
4. Conclusion
The decreasing trends of the air dose rates were measured and analyzed within an 80 km region of the FDNPP from 2011 to 2018. The averaged ratios for the air dose rate (excluding the effect of the natural background radiation) relative to the first car-borne survey in the overall 80 km region became 0.08 over a period of seven years, indicating a decreasing rate significantly higher than estimated by the physical decay of radiocesium (0.3). The rate of decrease in the air dose rate was lowest in the forest category and highest in the urban area among other categories, which is consistent with the previous reports. A slight difference was observed among the land-use categories in the evacuation order area of the difficult-to-return zone. In early periods following the accident, the decreasing rate outside the evacuation order area was higher than that in other areas, both in the forest and urban area land-use categories. The difference in the decreasing trends in air dose rates between evacuation order areas in forest occurred smaller than that in urban area. The decrease in the air dose rates in the evacuation order area of ‘residence restriction area’ was faster than those in the other areas after 2016. This could be a result of the vigorously performed decontamination works in the area, which caused lifting of the evacuation order in the area.
The ecological half-lives of the fast components evaluated in the entire evacuation order area showed 2.0–2.7 y, which is considerably longer than those outside the evacuation order area (0.4–0.5 y). To model the acceleration of the decrease in the air dose rates, we modified the formula related to the bi-exponential curve of the ecological half-life to obtain the two-group model. The model was employed in the evacuation order areas of ‘zone in preparation for the lifting of the evacuation order’; the fast components prior to and following the acceleration were successfully obtained. The half-lives after 2013 were 0.5–1 y, which were much shorter than those before 2013 (2–3 y). The results of the two-group model are in good agreement with the measured data. The parameters of the ecological half-life in the evacuation order areas of ‘residence restriction area’ and ‘difficult-to-return zone’ were obtained using previous bi-exponential model except the urban area land-use category in the evacuation order area of ‘residence restriction area.’
Supplemental Material
Download Zip (7.2 MB)Acknowledgments
The authors wish to express their gratitude to Mr. S. Mikami and Dr. Y. Sanada of Japan Atomic Energy Agency for their encouragement of this study, as well as to Mr. K. Uno for the support in the analyses of the ecological half-life and the staff of the Japan Atomic Energy Agency for conducting the car-borne surveys in the Fukushima mapping projects.
This study was a part of the Fukushima mapping projects financially supported by the Nuclear Regulation Authority Japan.
Disclosure statement
No potential conflict of interest was reported by the authors.
Supplementary material
Supplemental data for this article can be accessed here.
Related Research Data
References
- Saito K, Onda Y. Outline of the national mapping projects implemented after the Fukushima accident. J Environ Radioact. 2015;139:240–249.
- Saito K, Mikami S, Andoh M, et al. Summary of temporal changes in air dose rates and radionuclide deposition densities in the 80 km zone over five years after the Fukushima Nuclear Power Plant accident. J Environ Radioact. 2019;210:105878.
- Andoh M, Nakahara Y, Tsuda S, et al. Measurement of air dose rates over a wide area around the Fukushima Dai-ichi Nuclear Power Plant through a series of car-borne surveys. J Environ Radioact. 2015;139:266–280.
- Andoh M, Mikami S, Tsuda S, et al. Decreasing trend of ambient dose equivalent rates over a wide area in eastern Japan until 2016 evaluated by car-borne surveys using KURAMA systems. J Environ Radioact. 2018;192:385–398.
- Andoh M, Yamamoto H, Kanno T, et al. Measurement of ambient dose equivalent rates by walk survey around Fukushima Dai-ichi Nuclear Power Plant using KURAMA-II until 2016. J Environ Radioact. 2018;190-191:111–121.
- Mikami S, Maeyama T, Hoshide Y, et al. The air dose rate around the Fukushima Dai-ichi Nuclear Power Plant: its spatial characteristics and temporal changes until December 2012. J Environ Radioact. 2015;139:320–343.
- Mikami S, Tanaka H, Matsuda H, et al. The deposition densities of radiocesium and the air dose rates in undisturbed fields around the Fukushima Dai-ichi Nuclear Power Plant; their temporal changes for five years after the accident. J Environ Radioact. 2019;210:105941.
- Sanada Y, Torii T. Aerial radiation monitoring around the Fukushima Dai-ichi nuclear power plant using an unmanned helicopter. J Environ Radioact. 2015;139:294–299.
- Mikami S, Maeyama T, Hoshide Y, et al. Spatial distributions of radionuclides deposited onto ground soil around the Fukushima Dai-ichi Nuclear Power Plant and their temporal change until December 2012. J Environ Radioact. 2015;139:250–259.
- Matsuda N, Mikami S, Shimoura S, et al. Depth profiles of radioactive cesium in soil using a scraper plate over a wide area surrounding the Fukushima Dai-ichi Nuclear Power Plant, Japan. J Environ Radioact. 2015;139:427–434.
- Satou Y, Sueki K, Sasa K, et al. Analysis of two forms of radioactive particles emitted during the early stages of the Fukushima Dai-ichi Nuclear Power Station accident. Geochem J. 2018;52:137–143.
- Chino M, Terada H, Nagai H, et al. Utilization of 134Cs/137Cs in the environment to identify the reactor units that caused atmospheric releases during the Fukushima Daiichi accident. Sci Rep. 2016;6:31376_1-31376_14.
- Moriizumi J, Oku A, Yaguchi N, et al. Spatial distributions of atmospheric concentrations of radionuclides on 15 March 2011 discharged by the Fukushima Dai-Ichi Nuclear Power Plant Accident estimated from NaI(Tl) pulse height distributions measured in Ibaraki Prefecture. J Nucl Sci Eng. 2020;57:495–513.
- Tanigaki M, Okumura R, Takamiya K, et al. Development of a car-borne γ-ray survey system, KURAMA. Nucl Instrum Methods Phys Res A. 2013;726:162–168.
- Tanigaki M, Okumura R, Takamiya K, et al. Development of KURAMA-II and its operation in Fukushima. Nucl Instrum Methods Phys Res A. 2015;781:57–64.
- Gale HL, Humphreys DLO, Fisher EMR. Weathering of caesium-137 in soil. Nature. 1964;4916:257–261.
- Andersson KG, Roed J. Estimation of doses received in a dry-contaminated residential area in the Bryansk region, Russia, since the Chernobyl accident. J Environ Radioact. 2006;85:228–240.
- Jönsson M, Tondel M, Isaksson M, et al. Modelling the external radiation exposure from the Chernobyl fallout using data from the Swedish municipality measurement system. J Environ Radioact. 2017;178-179:16–27.
- Kinase S, Takahashi T, Satio K. Long-term predictions of ambient dose equivalent rates after the Fukushima Daiichi nuclear power plant accident. J Nucl Sci Technol. 2017;54:1345–1354.
- Sanada Y, Urabe Y, Sasaki M, et al. Evaluation of ecological half-life of dose rate based on airborne radiation monitoring following the Fukushima Daiichi nuclear plant accident. J Environ Radioact. 2018;192:417–425.
- Tsuda S, Yoshida T, Tsutsumi M, et al. Characteristics and verification of a car-borne survey system for dose rates in air: KURAMA-II. J Environ Radioact. 2015;139:260–265.
- Tsuda S, Saito K. Spectrum-dose conversion operator of NaI(Tl) and CsI(Tl) scintillation detectors for air dose rate measurement in contaminated environments. J Environ Radioact. 2017;166:419–426.
- Andoh M, Matsuda N, Saito K. Evaluation of ambient dose equivalent rates owing to natural radioactive nuclides in eastern Japan by car-borne surveys using KURAMA–II. T J At Energy Soc Jpn. 2017;16:63–80. [in Japanese.
- Japan: Ministry of Land, Infrastructure and Transport [Internet]; [cited 2019 Dec 10]. [in Japanese]. Available from: http://nlftp.mlit.go.jp/ksj/gml/datalist/KsjTmplt-L03-b.html.
- Japan: Ministry of Economy, Trade and Industry [Internet]; [cited 2019 Dec 10]. Available from: http://www.meti.go.jp/english/earthquake/nuclear/roadmap/pdf/150905MapOfAreas.pdf.
- Nakama S, Yoshimura K, Fujiwara K, et al. Temporal decrease in air dose rate in the sub-urban area affected by the Fukushima Dai-ichi Nuclear Power Plant accident during four years after decontamination works. J Environ Radioact. 2019;208-209:106013.
- Japan: Ministry of the Environment [Internet]; [cited 2019 Mar 26]. Available from: http://josen.env.go.jp/en/policy_document/pdf/decontamination_projects_1902_01.pdf.