
ABSTRACT
Dissolution behavior of Sr and Ba is crucial for evaluating secondary source terms via coolant water from ex-vessel debris accumulated at Fukushima Daiichi Nuclear Power Station. To understand the mechanism, knowing the distribution of Sr and Ba in the ex-vessel debris is necessary. As a result of reaction tests between simulated corium and concrete materials, two-layered structures were observed in the solidified sample: (A) a silicate glass-based phase-rich layer in the upper region and (B) a (U,Zr)O2 particle-rich layer at the inner region. Measurable concentrations of Sr and Ba were observed in layer (A) (approximately 1.7 times that in the layer (B)). According to thermodynamic analysis, (U,Zr)O2 is predicted to solidify, in advance, in the concrete-based melt around 2177°C. Then, the residual melt is solidified as a silicate glass, and Sr and Ba are preferentially dissolved into the silicate glass. During the tests, (U,Zr)O2 particles sank in the melt because of its higher density, and the silicate glass relocated to the upper layer. In the actual situation, the crust layer might form on the top surface with cracks and cavities, and therefore the water is possible to contact with upper silicate glass containing Sr and Ba.
1. Introduction
In the severe accident (SA) at Fukushima Daiichi Nuclear Power Station (1F), molten corium, consisting of UO2, oxidized zircaloy, neutron absorber, and structural materials are predicted to relocate from the reactor pressure vessel and, then, spread over the concrete floor in the pedestal region of the primary container vessel (PCV) [Citation1]. This sequence may cause molten core-concrete interaction (MCCI) and form ex-vessel debris. After the cold shutdown state of the 1F accident, ex-vessel debris still continues to be exposed to cooling water [Citation2]. Under such conditions, water-soluble radionuclides may gradually dissolve from the ex-vessel debris into cooling water, and, then, some of these radionuclides will likely migrate via water, accumulate under water, or adhere to the surface of structural materials away from the ex-vessel debris. A portion of accumulated or adhered radionuclides may even coexist with sludge or rust from the structural materials. Diffusion via cooling water could also influence the delayed secondary source term after the cold shutdown of the damaged reactors at 1F and the decommissioning.
Although most fission gases (Kr, Xe) and volatile FPs (Cs, I, Te, Sb) are expected to evaporate as gaseous species at high temperatures during a SA, semi-volatile FPs (Ru, Mo, Sr, Ba, Pd, Rh) and low-volatile FPs (Zr, Nb, and rare earths) are predicted to remain in various forms of fuel debris, i.e. in-vessel or ex-vessel. As for the actinides, almost all the U, Np, and Pu are predicted to remain in the fuel debris, although a very small amount of U could be evaporated at high temperatures. The knowledge of Am and Cm behavior is still insufficient. Semi-volatile FPs 90Sr and 137 mBa are especially dominant influences of the secondary source term because 90Sr has high radioactivity, and 137 mBa contributes to the decay heat for more than 10 years after a SA [Citation3]. To understand their diffusion behavior in water, Sr and Ba distribution features need to be identified in both in-vessel and ex-vessel debris. In particular, information on the distribution of Sr and Ba in specific phases is crucial for evaluating dissolution behavior.
As for in-vessel debris, the distribution of Sr and Ba can be predicted by previous experiments and thermodynamic analysis. In the MASCA project, the distribution of Sr and Ba was studied using simulated in-vessel debris, consisting of a UO2–ZrO2–Zr-stainless steel (S.S.) mixture with a small amount of simulated FPs [Citation4]. In the solidified simulated corium, stratification of the U-Zr-S.S. metal layer and UO2–ZrO2 oxide layer was observed, in which Sr and Ba were concentrated in the oxide layer, and thermodynamic analysis reasonably predicted the concentrations of Sr and Ba in the oxide phase [Citation5]. In the COLIMA CA-U3 test, phase separation into U0.8Zr0.2O2 major and U0.4Zr0.6O2 minor phases was observed in the solidified simulated corium [Citation6]. The concentration of Ba was comparable in both phases, but Sr was concentrated to the minor phase with approximately 10 times larger amounts compared to the initial composition. These previous observations suggest that both Sr and Ba may be concentrated to the oxide phase of the in-vessel debris, and in particular, Sr might be concentrated to the Zr-rich phase, even in the case of the 1F accident.
As for the ex-vessel debris, however, more complex phase separation could occur during solidification due to the coexistence of concrete with molten corium. The chemical and mechanical characteristics of 1F ex-vessel debris have been experimentally and thermodynamically studied. In the VULCANO test [Citation7–9], the distribution and phase relationships of the main components in the ex-vessel debris were investigated by reaction tests between simulated corium and a concrete crucible, as well as thermodynamic analysis. However, Sr and Ba were not added to the simulated corium. Nakayoshi et al. carried out a simulated MCCI test, in which small amounts of SrO and BaO were contained in the simulated corium [Citation10]. The results indicated that the alloy, consisting mainly of Fe and Cr, was precipitated in the oxide phase. The oxide phase mainly consisted of (U,Zr)O2 grains with various contents of Zr and U depending on the analysis position. No significant distributions of Sr and Ba were identified in these phases because the initial contents of SrO and BaO were less than 0.1 wt% of the total amount, which is too small for accurate elemental analysis. Thus, experimental knowledge on the distribution tendencies of Sr and Ba in ex-vessel debris is still insufficient. Furthermore, taking more realistic MCCI conditions into consideration, the solidification of ex-vessel corium is predicted to occur in a temperature gradient from molten corium (higher temperature) to non-melted concrete (lower temperature). Such a temperature gradient may facilitate distribution of Sr and Ba.
The present study aimed to obtain information on the characteristic distributions of Sr and Ba in ex-vessel corium, solidified under a temperature gradient. To simulate a temperature gradient from the top corium layer to the bottom concrete layer, a light-concentrated heating technique was employed for reaction tests between simulated corium and a concrete piece. Although such small-scale experiments cannot clarify the whole aspect of MCCI phenomena on the concrete floor, at least the tendency of distribution and chemical forms of focused elements in the fully molten mixture among core materials and concrete could be obtained. Additionally, thermodynamic analysis was performed to better understand solidification behavior of Sr and Ba in the ex-vessel debris.
2. Experimental procedure
Heating tests were performed using a light-concentrated heating device (Crystal System Corporation, IRM-3000-X), which was designed for examining interactions between concrete and simulated corium. This unique technique has the potential to heat across a wide temperature gradient from the top to the bottom of a sample. shows a schematic diagram of the device. Light from a xenon lamp, with maximum output of 3 kW, was concentrated onto the sample by a dome-type reflector. The lamp power was manually controlled based on the molten state by monitoring the sample during heating with a video camera. Because temperature measurement by a pyrometer was difficult due to the strong heat output from the lamp, the maximum temperature of the melt was estimated by phases observed in solidified samples.
Figure 1. Schematic diagram of the light-concentrated heating device
Simulated corium, which was prepared from a powder mixture of U0.5Zr0.5O2, ZrH2, S.S., B4C, platinum group alloy (PGM; Mo-Ru-Rh-Pd), BaCO3, and SrCO3, and basaltic concrete pieces were used as starting materials. Type 304 S.S. (100 mesh), B4C (60 µm, >98%), BaCO3 (99.98%), and SrCO3 (>99.9%) were commercially obtained. Zr metal chips (99.9%, low Hf) were hydrogenated under an Ar-20% H2 mixed gas flow at ~500°C for 22 h to form ZrH2, which was then pulverized into a coarse powder. This hydride decomposes to Zr metal and gaseous hydrogen during heating tests. The PGM alloy was prepared by powder metallurgy. Namely, the compacted mixture of Mo/Ru/Rh/Pd (22/56/9/13 wt%) was heat treated at 1530°C for 5 h under Ar gas flow. The obtained alloy piece was pulverized in a mortar by a planetary ball mill with a pot and balls made of tungsten carbide. Normal Portland cement, domestic river sand, and river gravel crushed below 5 mm in size were commercially obtained and mixed in a weight ratio of 1:2:3. Then, the mixture was kneaded with water with a mass of approximately 60% of the cement weight and solidified in S.S. containers. After curing for more than a month, the concrete pieces were obtained. The average composition of crushed concrete, which was roughly evaluated by a scanning electron microscope (SEM) attached with energy-dispersive X-ray spectrometry (EDS), was 51.0 at% Si, 24.9 at% Ca, 10.5 at% Al, 5.4 at% Fe, 3.3 at% Na, 2.8 at% K, 1.3 at% Mg, and 0.8 at% Ti+Mn.
The composition of simulated corium is summarized in . For full liquefication of simulated corium and a smooth spread of melt over the concrete piece, the total ratio of metal components (ZrH2, S.S., and PGM alloy) was over 30 wt%. Although the contents of FP elements in the light water reactor spent fuels are only 3–5 wt% [Citation11], the mass ratio of BaCO3, SrCO3, and PGM was set to be higher than the mass ratio in actual fuels to facilitate the detection of FP elements in the simulated ex-vessel debris. To investigate the influence of Zr oxidation on phase relationships in the simulated ex-vessel debris, both S.S.-rich (no. 1) and ZrH2-rich (no. 2) compositions were prepared. Because BaCO3 and SrCO3 thermally decompose into oxides and gaseous carbon dioxide at approximately 1000°C [Citation12] and 1200°C [Citation13], respectively, BaCO3 and SrCO3 were expected to be present as BaO and SrO during heating. The expected composition of simulated corium at temperatures over 1200°C is summarized in .
Table 1. Composition of simulated corium
Table 2. Composition of simulated corium over 1200°C
The powder mixtures were pressed into tablets at a pressure of 200 MPa with diameter of 10 mm, height of approximately 5 mm, and mass of ~1.5 g. A tablet was then placed on a ZrO2 powder bed atop a cylindrical piece of basaltic concrete (see ). The ZrO2 powder acted as a thermal insulator to prevent the concrete piece from melting earlier than the tablet due to heat transfer. A chemical reaction between concrete and simulated corium is predicted to be hardly influenced by the ZrO2 powder, because of its inactivity in both oxidation and reduction of constituent materials. The sample was placed on top of the holding rod, and then, the inside of the sample chamber was filled with Ar gas flow. Light from the Xe lamp was directed onto the tablet surface, and the current value was gradually increased from 20 to ~100 A for approximately 5 min (constant voltage at 30 V). A melt pool was formed on the surface of the tablet, and the simulated corium was fully liquefied. The maximum output was kept for approximately 1 min and the simulated molten corium and concrete melt were fully mixed. Then, the current value was decreased for approximately 1.5 min, and the sample was solidified in Ar atmosphere. The solidified samples were embedded in acrylic resin and, then, cut in a vertical direction. Polished cross-sections of the samples were observed using an optical microscope, and elemental analysis was completed with an SEM. Elemental analysis was performed by using an electron probe microanalyzer (EPMA, JXA-8900) with XM-36030L pentaerythritol spectrometer (PETJ), lithium fluoride (LIF), thallium acid phthalate (TAP), XM-3`20H pentaerythritol spectrometer (PETH), and new stearate (NSTE) analyzing crystals. A 20.0 kV voltage and current between 0.2 and 0.4 µA were used with a step size of 50 µm, and the detection time for each point was 100 ms. Point analyses of each phase were performed with a ~ 1 µm beam diameter, and average compositions of each region were determined with a beam diameter of 300 µm.
Figure 2. Schematic illustration of the sample
3. Results
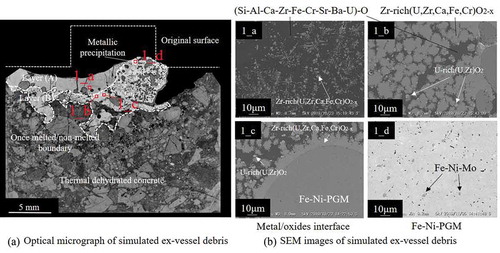
To understand the general tendencies of FP elements in ex-vessel debris under S.S.-rich conditions, more S.S. powder was added to the simulated corium in test no. 1. shows the appearance of solidified simulated ex-vessel debris, which had a mass of 16.9 g. shows an optical micrograph of a vertical cross-section of the sample. The left side of the original tablet completely melted, and the interface with concrete moved downward compared to the sample prior to heating. Although the shape of the right side of the original tablet was still intact, the reaction with concrete occurred even in the inner region. In the once-melted zone, metallic precipitations with 0.5 mm in diameters were observed. Below the once-melted zone, the un-melted concrete with low strength was recognized as a result of dehydration. shows SEM images of the upper region (layer (A); 1_a), and the inner region (layer (B); 1_b). EPMA point analysis in 1_b revealed gray Zr-rich (U,Zr)O2-based oxide (69.0 at% Zr, 27.0 at% U, 1.5 at% Ca, 1.3 at% Fe, and 1.2 at% Cr) and a dark matrix of silicate glass (53.2 at% Si, 13.3 at% Al, 10.4 at% Ca, 7.6 at% Fe, 5.2 at% Zr, 3.5 at% Cr, 3.1at% Sr, 2.1 at% Ba, and 1.6 at% U). In layer (B), grain-growth of the Zr-rich (U,Zr)O2 was significantly more prominent compared to layer (A). Additionally, small U-rich (U,Zr)O2 areas (~2–3 µm) were observed in layer (B). 1_c shows the SEM image of the interface between the oxide region and metallic precipitation. Zr-rich (U,Zr)O2 precipitated around the metal particle. In 1_d, two phases were observed in the metallic precipitation; the matrix phase consisted of Fe-Ni-based alloy containing a small amount of PGM (70Fe–12Ni–10Ru–3Mo–3Pd–2Rh) and a small amount of Fe-Ni-Mo alloy with higher Mo content (38–44 at%). The average concentrations of Sr and Ba in the dark matrix of no. 1 (1_a–1_c) were approximately 3 and 2 at%, respectively. Sr and Ba were not detected in Zr-rich (U,Zr)O2, U-rich (U,Zr)O2, or the metallic phase. Further, B and C were not detected in all phases.
Figure 3. (a) Views of the solidified simulated ex-vessel debris after experiment no. 1 and (b) after experiment no. 2
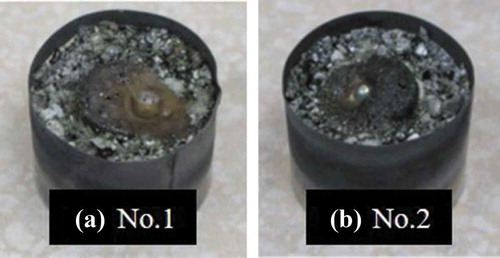
Figure 4. Cross-sectional images of the solidified simulated ex-vessel debris after experiment no. 1. (a) Optical micrograph of simulated ex-vessel debris. (b) SEM images of simulated ex-vessel debris: (1_a) close-up view of layer (A), (1_b) close-up view of layer (B), (1_c) interface between the oxide region and metallic precipitation, and (1_d) metallic precipitation
In test no. 2, the ZrH2 content was higher than in test no.1, to observe the influence of Zr oxidation on the phase relationships in simulated ex-vessel debris. shows the appearance of solidified simulated ex-vessel debris with the mass of 16.6 g. shows an optical micrograph of a vertical cross-section of the sample. Although the shape of the original tablet seemed unchanged, the right side of the tablet melted and reacted with the concrete. Metallic precipitation, with a diameter of 3.0 mm, was observed, which was bigger than in sample no. 1. Below the once-melted zone, the concrete was thermally dehydrated. 2_a and 2_b show the SEM images of the near-upper region (layer (A)) and the inner region (layer (B)), respectively, of the once-melted zone. EPMA point analysis of region 2_b reveals gray Zr-rich (U,Zr)O2-based oxides (76.6 at% Zr, 18.8 at% U, and 4.6 at% Ca) and a dark matrix of silicate glass (51.4 at% Si, 15.3 at% Al, 15.3 at.% Ca, 6.5 at% Zr, 3.8at% Sr, 3.5 at% Ba, 2.2 at% U, and 2.0 at% Cr). Additionally, tiny precipitations of U-rich (U,Zr)O2 (~2–3 µm) are observed in 2_b. 2_c shows the SEM image of the interface between the oxide region and metallic precipitation. Zr-rich (U,Zr)O2 precipitated around the Fe-Si-Cr-Ni-PGM metal particle. 2_d shows the SEM image of a vertical cross-section of the metallic precipitation. The metal phase was determined to be Fe-Si-Cr-Ni-PGM-based alloy (55Fe–16Si–10Cr–7Ni–7Ru–3Pd–2Mo). Although slight phase separation was observed in the metallic phase, no significant difference in the compositions between the gray matrix and the grain boundary phase were detected. In the metallic phase of no. 2, Si and Cr were detected, whereas Fe-Ni-PGM and Fe-Ni-Mo were detected in no. 1. The average concentrations of both Sr and Ba in the dark matrix of no. 2 (2_a–2_c) were approximately 4 at%. Sr and Ba were not detected in Zr-rich (U,Zr)O2 and U-rich (U,Zr)O2. B and C were not detected in all phases. The phases and average compositions, determined by EPMA point analysis, of no. 1 ( 1_a–1_d) and no. 2 ( 2_a–2_d) are summarized in .
Figure 5. Cross-sectional images of the solidified simulated ex-vessel debris after experiment no. 2. (a) Optical micrograph of simulated ex-vessel debris. (b) SEM images of simulated ex-vessel debris: (2_a) close-up view of layer (A), (2_b) close-up view of layer (B), (2_c) interface between the oxide region and metallic precipitation, and (2_d) metallic precipitation
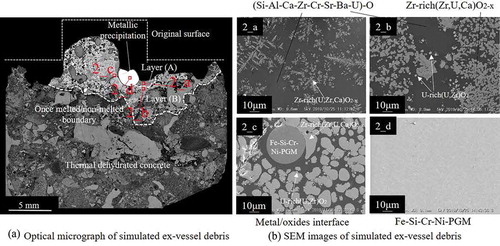
Table 3. Phases and average compositions in the solidified simulated ex-vessel debris (at%)
4. Discussion
4.1. Solidification progress of each phase
The UO2–SiO2 diagram suggests that the liquidus temperature of UO2 is lowered to ~2000°C when UO2 coexists with SiO2 [Citation14]. As for the ZrO2–SiO2 system, although the liquidus temperature is slightly lower than UO2–SiO2, the tendency is similar to that of the UO2–SiO2 system [Citation15]. Therefore, the maximum temperature of the once-melted zone is predicted to be >2000°C, and (U,Zr)O2 solidified in the glass matrix around this temperature. After the melt pool was observed on surface, the temperature was decreased for approximately 1.5 min by controlling the lamp current. When the lamp was turned off, the surface of melt was below red heat, and the temperature of the surface was predicted to be ~1000°C. The cooling rate from maximum temperature to ~1000°C was roughly estimated to exceed 670°C/min.
In this study, Si, Ca, and Al were observed as the main components of the silicate glass matrix. Glass formation of a SiO2–Al2O3–CaO-based compound (containing small amounts of ZnO, TiO2, and B2O3) occurs when the melt is cooled at >0.9°C/min [Citation16]. Under quick solidification during the light-concentrated heating tests, the SiO2–CaO-Al2O3-based matrix may solidify as silicate glass with minor soluble elements (Zr, Fe, Cr, Sr, Ba, and U). In fact, there are many studies on silicate glasses containing these minor elements [Citation17–19].
In both solidified samples no. 1 and no. 2, fine dendritic precipitation of Zr-rich (U,Zr)O2 (~10 µm) were observed in layer (A), whereas Zr-rich (U,Zr)O2 particles (20–30 µm) and U-rich (U,Zr)O2 particles were observed in layer (B). This difference in precipitation size and shape indicates a difference in solidification rate between the upper and inner regions. When the current value was decreased, the upper region solidified quickly, and layer (A) was formed. Subsequently, the inner region solidified slowly, in comparison, because of thermal insulation by layer (A), and grain-growth of the Zr-rich (U,Zr)O2 phase occurred. According to the previous study, cubic (U,Zr)O2, which is a high-temperature phase of (U,Zr)O2, was maintained during quick solidification, whereas phase separation into cubic and tetragonal phases occurs during slow solidification [Citation20]. In the simulated ex-vessel debris, phase separation into Zr-rich (U,Zr)O2 and U-rich (U,Zr)O2 is predicted to occur in the inner region under slow solidification.
Most Fe, Ni, and PGM solidified as alloy phases, in accordance with previous works [Citation4,Citation5]. In metallic precipitation of sample no. 1, a Mo-rich Fe-Ni-Mo phase was detected. The Fe-Mo phase diagram suggests that the Laves-phase and µ-phase are precipitated in the Fe-Mo alloy with Mo content higher than 3 at% at low temperature [Citation21]. In the Fe-Ni-Mo alloy, these phases are also observed [Citation22]. Contrarily, Mo concentration in the metallic precipitation of sample no. 2 was small (~2 at%), and consequently, the Mo-rich phase was not precipitated in no. 2.
According to the previous work [Citation23], B tends to be detected in the metallic phase in the simulated fuel debris and the chemical forms of B is predicted to be B4C or borides (ZrB2 and (Fe, Cr)2B) or dissolved in Fe-based alloys with low concentration. However, specific phases containing B were not detected in the metallic phase in this work. Most of B is expected to be volatilized from the sample as gaseous species in the initial heating stage of the tests. C in simulated ex-vessel debris could not be detected because the polished surface was coated with carbon to avoid electric charge.
4.2. Order of element oxidation in simulated ex-vessel debris
Due to difference in the initial Zr metal content in the simulated corium, sample no. 1 melted under oxidizing conditions and sample no.2 under relatively reducing conditions. The order of oxidation of the metallic elements in simulated ex-vessel debris can be understood by the Ellingham diagram and is Ca, Sr, Zr, U, Ba, Al, Si, Cr, Mo, Fe, Ni, Ru, Rh, and Pd, as determined from the standard free energies shown in [Citation24,Citation25]. Under test no. 1 conditions, the Fe concentrations in Zr-rich (U,Zr)O2 and silicate glass were ~7 and ~1 at%, respectively. The Cr concentrations in Zr-rich (U,Zr)O2 and silicate glass were ~4 and ~1 at%, respectively. However, in sample no. 2, Fe was not detected in either Zr-rich (U,Zr)O2 or silicate glass. Also, Cr was not detected in Zr-rich (U,Zr)O2, and the concentration of Cr in silicate glass was lower than in no. 1. This indicates that a portion of Fe and Cr in S.S. is transferred to the oxide phases under the oxidizing conditions of test no.1. On the other hand, Fe-Ni-PGM and Fe-Ni-Mo alloys are detected in the metallic phase of no. 1, whereas Fe-Si-Cr-Ni-PGM is detected in no. 2 with the significant content of Si because of SiO2 reduction by Zr, while Cr was oxidized under the condition of test no. 1. 1_c and 5(b) 2_c show that Zr, which is more susceptible to oxidation, is transferred from the metallic phase to the oxide phase.
Figure 6. Ellingham diagram for ex-vessel debris [Citation24]. *The standard free energies of uranium oxides are obtained by Lindemer et al. [Citation25]
![Figure 6. Ellingham diagram for ex-vessel debris [Citation24]. *The standard free energies of uranium oxides are obtained by Lindemer et al. [Citation25]](/cms/asset/56a9443a-7e5b-46da-925b-b3f24b3d12c1/tnst_a_1879690_f0006_b.gif)
4.3. Thermodynamic evaluation of Sr and Ba solidification behavior in silicate glass
To understand the behavior of Sr and Ba in the present experiments, thermodynamic evaluation was performed using the Mephista database [Citation26], which covers binary and ternary systems among the main elements (U, Zr, Si Ba, Sr, O) in the present experimental conditions. The average compositions of the main elements of the once-melted zone (1_a, 1_b, and 1_c of sample no. 1) are summarized in . The average composition of the three regions is 41.9 at% Si, 34.9 at% Zr, 17.4 at% U, 3.7 at% Sr, and 2.1 at% Ba. Based on experimental results, the chosen calculation conditions are shown in . The temperature ranged from 1300 to 2200°C, which covers the experimental heating temperatures, and the variation in mole fractions of solid and liquid phases in the SiO2–UO2–ZrO2–SrO-BaO system is drawn in as a function of temperature. The expected solidification path flow under the temperature gradient is summarized in . According to the equilibrium calculation, solid-state cubic (U,Zr)O2 and concrete-based liquid exists around the maximum temperature (2177°C), and then, the solidification of the concrete-based liquid phase proceeds with decreasing temperature. In the experimental results, although phase separation of fcc-(U,Zr)O2 and the concrete-based phase were identified, phase separation of the concrete-based melt ((Zr,U)SiO4, SrSiO3, Ba3Si5O13, and Ba5Si8O21) was not identified. This is because the experimental cooling rate was too high to achieve equilibrium. During the heating tests, cubic (U,Zr)O2 may still be solidified in the melt at elevated temperatures, while the concrete-based liquid rapidly solidified as silicate glass. During this process, Sr and Ba dissolved into the silicate glass. At the bottom of containment vessel, the inner region of molten corium on the concrete floor is predicted to solidify at an extremely slow cooling rate with erosion of concrete [Citation27]. Under such conditions, crystal structure ((Zr,U)SiO4, SrSiO3, Ba3Si5O13, and Ba5Si8O21) is possible to occur at the molten core/concrete interface region, rather than silicate glass structure.
Figure 7. Variation in the mole fractions of solid and liquid phase SiO2–UO2–ZrO2–SrO–BaO as a function of temperature using the Mephista database [Citation26]
![Figure 7. Variation in the mole fractions of solid and liquid phase SiO2–UO2–ZrO2–SrO–BaO as a function of temperature using the Mephista database [Citation26]](/cms/asset/12c1dd5b-6340-4110-9ecb-e150fe677e55/tnst_a_1879690_f0007_oc.jpg)
Figure 8. Solidification path flow of SiO2–UO2–ZrO2–SrO-BaO based on the equilibrium calculation, indicating the tendency of phase transformation
Table 4. Average composition of the main components of the once-melted zone in sample no. 1: 1_a, 1_b, and 1_c
Table 5. Calculation conditions for the investigation of Sr and Ba behavior in the simulated ex-vessel debris
4.4. Sr and Ba distribution in the upper layer of ex-vessel debris
er layer (B), with different microstructures, were both observed, depending on the (U,Zr)O2 particle size. Moreover, EPMA analysis of sample no.1 showed higher U content in layer (B) (1_b and 1_c), as shown in . The U concentration of layer (B) was approximately 2.1 times higher than layer (A). In contrast, Si, Sr, and Ba concentrations of layer (A) were 2.1, 1.8, and 1.7 times higher than layer (B), respectively. This reveals that (U,Zr)O2 particles, which have higher densities, may sink, leaving the upper region (layer (A)) with a silicate glass-rich composition. Although the cooling rates during the tests were fast, the cooling rate of layer (B) might not be so fast due to the thermal insulation of layer (A). It may be result of the gravity segregation of (U,Zr)O2 particles to inner region. In fact, solidified corium formed in the Chernobyl nuclear power plant had two main forms, known as brown lava and black lava [Citation28]. Although both forms mainly consisted of glass matrix, UOx with Zr particles, and metal phase, these forms were completely stratified to the upper black lava and bottom brown lava due to the U content. Based on the prediction by the stratification of solidified corium in the Chernobyl and the experimental results in this work, most of the silicate glass phase containing Sr and Ba is expected to be solidified as an upper layer of ex-vessel debris during the 1F accident, as well. If the phase separation of the concrete-based melt ((Zr,U)SiO4, SrSiO3, Ba3Si5O13, and Ba5Si8O21) occurs at an extremely slow cooling rate at 1F, these phases are predicted to solidify in upper layer because of the lower densities than (U,Zr)O2 particles.
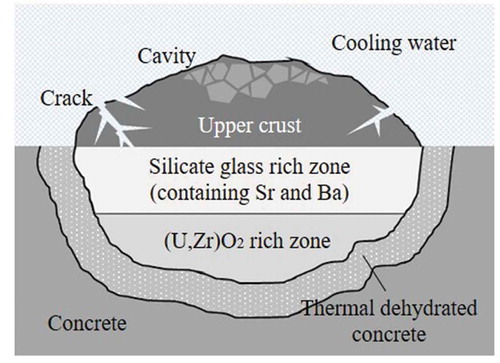
When the molten corium spread over the concrete floor in the pedestal region during the SA at 1F, the surface region of the corium was predicted to be quenched by cooling water, and then, an upper crust formed. Especially, most of molten corium is predicted to be spread over the concrete floor in 1F unit1 and the crust forming could significantly influence the characteristics of ex-vessel debris [Citation2]. Furthermore, the quenched upper crust layer may have some cracking and cavities. Under such conditions, cooling water is possible to contact with the silicate glass phase containing Sr and Ba. Additionally, radiolysis of water, decay heat, and water composition are possible to influence stability and solubility of Sr and Ba in the long term. An image of the ex-vessel debris layered structure is drawn in .
Figure 9. Image of the layered structure of the ex-vessel debris
5. Conclusion
To obtain characteristic information on Sr and Ba in ex-vessel debris under a temperature gradient, reaction tests between simulated corium and concrete were performed.
A cross-sectional view of the once-melted zone of solidified simulated ex-vessel debris revealed that (U,Zr)O2-based particles precipitated in silicate glass matrix and metallic precipitations. Sr and Ba were dissolved in the silicate glass. This phenomenon was reasonably recognized from the solidification path expected by thermodynamic evaluation. During heating tests, (U,Zr)O2 solidified in the melt at approximately 2000°C, and then, the residual concrete-based liquid solidified later as silicate glass.
In the upper layer of the once-melted zone of the simulated ex-vessel debris, silicate glass with higher concentrations of Sr and Ba was observed. The concentrations of Sr and Ba in the upper layer were approximately 1.7 times higher than in the lower layer. During solidification, the silicate glass phase may relocate to the upper layer because of its lower density. At 1F, upper crust may have some cracks and cavities and cooling water is possible to contact with upper silicate glass phase. This information can be used for evaluating secondary source terms.
Acknowledgments
The authors would like to thank Dr. E. Yamamoto from Sector of Nuclear Science Research Advanced Science Research Center, Japan Atomic Energy Agency, for his committed support in handling an elemental analysis using an electron probe microanalyzer. The authors would like to thank Dr. M. Kurata from Collaborative Laboratories for Advanced Decommissioning Science, Japan Atomic Energy Agency, for useful discussions and encouragement in constructing this research.
Disclosure statement
No potential conflict of interest was reported by the authors.
References
- Sehgal BR. Nuclear safety in light water reactors severe accident phenomenology. USA: Academic Press; 2012.
- TEPCO HP [Internet]. [ cited 2020 Aug 18] Available from: https://www.tepco.co.jp/decommission/data/plant_data/ [in Japanese].
- Miwa S, Amaya M, Tanaka K, et al. Research program for the evaluation of fission product and actinide release behavior, focusing on their chemical forms -position and plan of the research program-, JAEA-review; 2013 [in Japanese].
- Tsurikov DF, Strizhov VF, Bechta SV, et al. Main results of the MASCA-1 and 2 projects. NEA/CSNI/R, vol 15 (2007), Russian Research Centre “KURCHATOV INSTITUTE” OECD MASCA Project; 2007.
- Fukasawa M, Tamura S. Thermodynamic analysis for molten corium stratification test MASCA with ionic liquid U-Zr-Fe-O-B-C-FPs database. J Nucl Sci Technol. 2007;44(9):1210–1219.
- Journeau C, Piluso P, Correggio P, et al. The PLINIUS/Colima CA-U3 test on fission-product aerosol release over a VVER-type corium pool. Rapport CEA-R-6160; 2007.
- Kitagaki T, Ikeuchi H, Yano K, et al. Characterization of the VULCANO test products for fuel debris removal from the Fukushima Daiichi Nuclear Power Plant. Prog Nucl Energy. 2018;5:217–220.
- Kitagaki T, Yano K, Ogino H, et al. Thermodynamic evaluation of the solidification phase of molten Core-concrete under estimated Fukushima Daiichi nuclear power plant accident conditions. J Nucl Mater. 2017;486:206–215.
- Brissonneau L, Ikeuchi H, Piluso P, et al. Material characterization of the VULCANO corium concrete interaction test with concrete representative of Fukushima Daiichi Nuclear Plants. J Nucl Mater. 2020;528:151860_1-151860_18.
- Nakayoshi A, Jegou C, Windt LD, et al. Leaching behavior of prototypical Corium samples; a step to understand the interactions between the fuel debris and water at the Fukushima Daiichi reactors. Nucl Eng Des. 2020;36:110522_1-110522_18.
- Japan Atomic Energy Relations Organization HP [Internet]. [ cited 2020 Aug 18] Available from: https://www.jaero.or.jp/data/03syuppan/energy_zumen/energy_zumen.html (in Japanese).
- Arvanitidis I, Sichen D, Seetharaman SA. Study of the thermal decomposition of BaCO3. Metall Mater Trans B. 1996;27:409–416.
- Bagherisereshki E, Tran J, Lei F, et al. Investigation into SrO/SrCO3 for high temperature thermochemical energy storage. Sol Energy. 2018;160:85–93.
- Ball RGJ, Mignanelli MA, Barry TI, et al. The calculation of phase equilibria of oxide core-concrete systems. J Nucl Mater. 1993;201:238–249.
- Suzuki M, Sodeoka S, Inoue T. Structure control of plasma sprayed zircon coating by substrate preheating and post heat treatment. Mater Trans. 2005;46(3):669–674.
- Ota R, Kuribayashi H, Fukunaga J. Viscosity and crystallization behavior of non-alkali multicomponent glass. J Soc Mater SciJap. 1991;40(451):395–399. [in Japanese].
- Imaoka M, Yamazaki T. Studies of the glass-formation range of silicate systems. investigations on the glass-formation range, 2. J Ceram Assoc Japan 1963;71(816):215–223 [in Japanese].
- Koizumi S, Xu G, Ueda S, et al. Dissolution behavior of Fe from CaO-SiO2-FeOx glassy phase. Tetsu-to-Hagané. 2019;105(6):664–673. [in Japanese].
- Wang JS, Shen FH. The development of SiO2 resistant Cr-doped glass ceramics for high Cr4+emission. J Non Cryst Solids. 2012;358(2):15:246–251.
- Takano M. Characterization study on fuel debris. Atomic Energy Society of Japan 2016 Fall Meeting; 2016 July 6. Available from: http://www.aesj.or.jp/~wchem/27-5kennkyukai.pdf [in Japanese].
- Wang D, Su D, Schlögl R. Crystallographic shear defect in molybdenum oxides: structure and TEM of molybdenum sub‐oxides Mo18O52 and Mo8O23. Cryst Res Technol. 2003;38(2):153–159.
- Ishikawa S, Matsuo T, Takeyama M. Phase equilibria among γ-Fe, γ-Fe and Fe2Mo phases and stability of the laves phase in Fe-Mo-Ni ternary system at elevated temperatures. Mrs Proc. 2006;0980-II05-17.
- Takano M, Nishi T, Shirasu N. Characterization of solidified melt among materials of UO2 fuel and B4C control blade. J Nucl Sci Technol. 2014;51:859–875.
- Barin I. Thermochemical data of pure substances. 3rd ed. Germany: Wiley-VCH; 1995.
- Lindemer TB, Besmann TM. Chemical thermodynamic representation of <UO2±x>. J Nucl Mater. 1985;130:473–488.
- Cheynet B, Fischer E. MEPHISTA: a thermodynamic database for new generation nuclear fuels. [ cited 2020 July 30] Available from: http://hal.archives-ouvertes.fr/hal-00222025/fr/
- Washiya T. Fundamental research program for removal of fuel debris. International Symposium on the Decommissioning of TEPCO’s Fukushima Daiichi Nuclear Power Plant Unit 1-4; Japan; 2017 Dec 12.
- Burakov BE, Anderson EB, Shabalev SI, et al. The behavior of nuclear fuel in first days of the chernobyl accident. Mrs Proc. 1996;465:1297–1308.