
 ?Mathematical formulae have been encoded as MathML and are displayed in this HTML version using MathJax in order to improve their display. Uncheck the box to turn MathJax off. This feature requires Javascript. Click on a formula to zoom.
ABSTRACT
The occurrence of common cause failures poses a critical threat to the seismic safety of nuclear power plants. The installation of diverse components such as isolation systems is believed to be a promising strategy to avoid such failures, especially in the context of disasters such as the Fukushima accident. Although the effectiveness of implementing diverse components in enhancing the seismic safety has been qualitatively evaluated, a quantitative examination considering the system reliability has not been performed yet. Therefore, in this study, a method to quantitatively evaluate the effectiveness of diverse components in preventing failures was developed. The definitions of the seismic diversity and robustness in different domains were examined. Subsequently, the proposed approach was used to evaluate the effectiveness of the seismic diversity strategy on enhancing the system reliability at 11 sites in Japan. Moreover, the seismic robustness of the system was assessed. The results indicated that the optimal constitution of diverse components depends on the seismic environment at each site, and the seismic diversity is a more effective strategy compared to that of multiplicity to ensure the seismic safety of nuclear power plants.
1. Introduction
The 2011 accident of the Fukushima Dai-ichi Nuclear Power Plant has highlighted the importance of defense in depth (DiD) [Citation1] to ensure the safety of nuclear power plants (NPPs) in certain scenarios [Citation2–4] (e.g. seismic, tsunami, tornado). To effectively implement the DiD scheme for enhancing the power system safety by avoiding common-cause failures (CCFs), the installation of diverse structures, systems, and components (SSCs) is believed to be a promising principle strategy for preventing and mitigating accidents within the design basis, especially to address external hazards.
To ensure the seismic safety of NPPs in locations that are frequently prone to various types of earthquakes, such as in Japan, it is imperative that the system robustness against not only unexpected events within the design basis but also beyond the design basis events be improved, and a key technique to realize this aspect is to enable system diversity [Citation5–10]. Thus, enhancing robustness in addition to ensuring seismic diversity in terms of the installation directions of the devices and their seismic isolation could be more strengthened strategy than ensuring multiplicity.
In general, the response of a device varies considerably depending on the natural frequency and damping of the device. Therefore, it can be intuitively considered that a system comprising both seismic design devices (SDDs) and seismically isolated devices (SIDs) may involve higher levels of safety than systems that have just the SDDs or SIDs. Although the effectiveness of such a system against the seismic events is widely known qualitatively, the quantitative examinations considering system reliability have not been performed yet.
Probability of failure is used as a risk index in this paper as it is considered a useful index to quantify the effectiveness of seismic diversity. The seismic probabilistic risk assessment (SPRA) has generally been used in literatures and practice to quantify risk. The SPRA uses hazard, fragility, and system information to evaluate the core damage frequency (CDF) and containment failure frequency (CFF). The uniform hazard spectrum (UHS) has also been used for generating the fragility curves. The fragility curve is defined as the conditional failure probability of the structure at a given value of seismic intensity. Although the UHS facilitates risk assessment, it cannot express the variety of ground motion characteristics attributable to earthquake types (e.g. crustal, subduction plate-boundary, subduction intra-plate), magnitudes, and distances from the seismic sources to the sites. Instead, these factors are indirectly considered via the ground motion prediction equation (GMPE). In addition, the periodic dependencies on spectral accelerations between specific periods affect the dynamic analyses of structures and produce conservative results. However, such dependencies are not taken into consideration in the UHS.
To complement this dependency, Baker and Cornell [Citation11] proposed the conditional mean spectrum associated with epsilon (CMS-ε); Baker [Citation12] provided the CMS as a ground motion selection tool, and Mousavi et al. [Citation13] proposed the eta-based CMS. Since these methods require selection of a conditioning period, the effects of the period are examined [Citation14–16].
In addition to these, the CMS has been extended to multiseismic source regions [Citation17] and multiple earthquake scenarios [Citation18]. Although these studies have overcome conservative results by mean of the CMS, their main aim was to evaluate the seismic responses and not the evaluation of the reliability of a complex system, such as an NPP. The major difference between structural dynamics and system reliability is that system reliability cannot determine the conditioning period that affects the final results. In the case of SPRA in the nuclear industry, Bohn and Lambright [Citation19] provided the thumb rule for response correlation, which was obtained from the Seismic Safety Margins Research Program (SSMRP) [Citation20]. In the case of system reliability, the SSCs are classified into three frequency ranges, namely zero-period acceleration, 5–10 Hz, and 10–15 Hz [Citation19,Citation21], which then reflect to determine f the correlation coefficient between specific components. The method can easily take into account the spectral variations for equipment with differing periods by means of classification of the eigen frequencies. Since the thumb rule was developed based on the results of the SSMRP, the applicability to other type of NPPs and other frequency ranges (i.e. up to 5 Hz) is not clear.
This work presents the definitions of seismic diversity and robustness, and proposes their quantitative evaluation methodologies. The methodology of seismic diversity is then applied to 11 sites in Japan that have different seismic environmental characteristics, and the failure probability of the systems is calculated for each instance based on the seismic environment of the site. The insights gained from the results from the 11 sites are discussed. Moreover, the relationships between the seismic hazard characteristics and the effectiveness of the diversity to robustness are examined.
2. Definition of seismic diversity and robustness
2.1. Seismic diversity
In general, diversity refers to a condition of having or being composed of differing elements, and its various definitions in different domains, including nuclear engineering, are as follows.
According to NUREG/CR-6303, diversity is a principle in instrumentation systems that corresponds to the sensing of different parameters using different technologies, different logic or algorithms, or different actuation means to provide several ways of detecting and responding to a significant event. Diversity is complementary to the principle of DiD, and its implementation increases the chances that the defense at a particular level or depth is actuated when required. Moreover, the defenses at different levels of depths may be different. In this regard, the diversity amongst humans, design, software, functions, signals, and equipment must be considered [Citation22].
Ensuring diversity involves changing the characteristics and layout of safety-critical equipment in NPPs. By realizing this aspect, the robustness of a power plant against CCFs, such as natural disasters, can be enhanced [Citation23].
To ensure diversity of two or more SSCs with different characteristics, the same functionalities must still be used. In contrast, to realize multiplicity, two or more SSCs with the same characteristics and functionalities must be used [Citation24].
When realizing diversity, different types of equipment must be prepared to prevent loss of function of the entire system owing to a CCF. For example, to ensure the constant operation of a cooling water injection pump, it is necessary to use several components, such as electric drives, steam turbine drives, and gas pressure drives, in combination as a power source [Citation25].
The risk of CCF of SSCs, which attempt to avoid the occurrence of severe accidents while implementing the DiD strategy, must be reduced. To this end, it is important to introduce seismic diversity by changing the installation direction of the SSCs and introducing seismic isolation [Citation26].
Considering these definitions, the concept of diversity in the context of nuclear safety against natural disasters can be defined as follows: A diverse system is one that comprises multiple devices with different characteristics to reduce the risk of functional loss of the entire system owing to the occurrence of a CCF caused by a significant natural disaster.
Furthermore, the focus of this study was to ensure seismic diversity by implementing seismic isolation. Therefore, we defined seismic diversity as ‘a seismically diverse system that is a parallel system composed of multiple devices with different natural frequencies and dampings to reduce the risk of functional loss to the entire system from the occurrence of a CCF caused by a significant natural disaster.’
2.2. Robustness
In general, robustness refers to the quality or condition of sufficient strength and resilience, or the ability to withstand or overcome adverse conditions or rigorous testing. The various definitions of robustness from different domains, including nuclear engineering, are as follows.
Servo systems must exhibit the desired behaviors even under fluctuations that affect the system during operation; examples of such fluctuations include wind gusts, wear, and changes in the configurations of aircraft, mechanical systems, and robots, respectively. This requirement is termed as robustness to uncertainty [Citation27].
In flood risk management, robustness is defined as the ability of a system to remain functional under disturbances even with a variable and uncertain magnitude [Citation28].
A robust structure is one that can withstand an accidental action caused by an unexpected event that is not considered in the design, without being damaged to an extent disproportionate to the original cause [Citation29]. Moreover, the robustness of a structure against a beyond-design-basis earthquake is assessed using the following criteria established by the German Reactor Safety Commission: (a) The vital functions to ensure compliance with the protection objectives are ensured. (b) Effective emergency measures can be considered [Citation30]. Robustness has also been defined as the ability of a structure to withstand an abnormal event involving a localized failure, with limited consequences or simple structural damages [Citation31]. Furthermore, the robustness of a structure can be defined as its tolerance to damage from extreme or accidental loads [Citation32], or the ability to avoid disproportionate collapse caused by any initial damages [Citation33].
In a robust design, the aim is to develop a product with an optimized functional performance that is insensitive to variations in the noise factors, as classically promoted by Taguchi, and to variations in the product design parameters [Citation34].
Considering these definitions, the robustness of a system can be defined as the ability to maintain functionality or withstand a certain amount of disturbance. The relevant disturbances can be classified as follows:
Fluctuations, disturbances, variations in the noise factors, or variations in the design parameters [Citation27,Citation28,Citation34].
Accidental actions caused by unexpected events, accidental loads, or beyond-design-basis earthquake events [Citation29,Citation30,Citation32].
Localized failure or initial damages [Citation31,Citation33].
In this study, we considered disturbances of type (2) because in the light of the Fukushima accident to enhancing nuclear safety, and defined robustness as ‘the ability of a system to maintain its functionality regardless of the occurrence of various types of beyond-design-basis ground motions.’
3. Evaluation of seismic diversity and robustness
3.1. Evaluation procedure
We focused on dual and triple parallel systems composed of SDDs and SIDs, as shown in , and calculated the failure probability in the event of seismic motions to examine the effectiveness of the seismic diversity and robustness to quantitatively optimize the seismic designs of NPPs. We used horizontal seismic isolation system for components to illustrate the concept of the seismic diversity and robustness clearly, though there are various type of isolation system.
Figure 1. Fault tree of a dual parallel system [Citation7]
![Figure 1. Fault tree of a dual parallel system [Citation7]](/cms/asset/2f6a1fc6-6ce6-44d6-b4ee-fe49f982a19d/tnst_a_1899994_f0001_b.gif)
Figure 2. Fault tree of a triple parallel system
The process to evaluate the seismic diversity by calculating the failure probability for various seismic motions based on the seismic environment at the target site is illustrated in . The robustness is evaluated by calculating the failure probability in the event of specific seismic motions, including those beyond the design basis, and considering the magnitude of the earthquake and the distance from the seismic source to the site. A Monte Carlo simulation (MCS) was performed to calculate the failure probability, considering the variability in the capacity and response of the devices. To equalize the failure probability of SDDs and SIDs with different natural periods, the median capacity of each device was determined based on the seismic environment at the target site, considering the UHS obtained by performing a probabilistic seismic hazard analysis (PSHA) with the same annual exceedance frequency. The design seismic motion of a nuclear power plant is set as a pseudo-velocity response spectrum, and the median capacity of each device is assumed to be designed on the pseudo velocity response spectrum at a natural period of the device. We assumed that the variability of the capacity and response depended on a lognormal distribution and thus utilized their respective logarithmic standard deviations. The response of each device was determined using the ground motion prediction equation (GMPE) obtained through seismic observation data. The objective was to characterize the overall seismic diversity and robustness using a conceptual simplified model; therefore, it was assumed that the seismic motion was not amplified between the ground surface and device. When determining the device response, we considered the variability of the GMPE, and if the natural periods of each device included in the system were different, the inter-period correlation was considered. We provided the median and variation of the device capacity, seismic parameters (the magnitude of the earthquake, the distance from the seismic source to the site), the GMPE variation, and the response variation. When the response exceeded the capacity, the device was determined to have failed. When all the devices in the system failed simultaneously, the system itself was considered to have failed. Finally, the failure probability for each device and system was calculated considering the failure determination results for all the seismic sources.
Figure 3. Process to evaluate the seismic diversity and robustness
3.2. GMPE
As mentioned previously, the ground motion was evaluated using the GMPE, which is obtained by the regression analysis of the data pertaining to many seismic observation records and expresses the seismic motion indexes such as the peak ground acceleration, peak ground velocity, and response spectrum as a function of the magnitude, distance, earthquake type, and ground conditions. In general, the seismic motion can be determined using the GMPE in a relatively simple manner. Of the many available GMPEs, we selected the one proposed by Morikawa and Fujiwara [Citation35], as shown in Equation (1). This expression can be applied to mega-earthquakes with a maximum moment magnitude of 9, as the researchers developed this equation considering the strong motion data observed during the 2011 Off the Pacific Coast of Tohoku Earthquake [Citation35]. In particular, Equation (1) was used to predict the horizontal component of the acceleration response spectrum at the ground surface with a damping factor of 5%, considering amplification by the deep sedimentary layers and shallow soft soil at the site. The amplification by the deep sedimentary layers and shallow soft soil was corrected using Equations (3) and (4), respectively, as reported by Morikawa and Fujiwara [Citation36]. Moreover, the correction term for the intra-plate earthquakes, as introduced by Morikawa and Fujiwara [Citation37], was employed.
Here, is the mean value of the common logarithm of the acceleration response spectrum at natural period T, Mw is the moment magnitude; X is the shortest distance from the seismic source to the site, a(T), bk(T), ck(T), and d(T) denote the regression coefficients, and k is the suffix of the earthquake type (1: crustal, 2: subduction plate-boundary, 3: subduction intra-plate).
Here, D1400 is the depth of the layer having an S-wave velocity of 1400 (m/s) at the site, Vs30 is the average S-wave velocity until a site depth of 30 m, and pd, D1400min, ps and Vsmax denote the regression coefficients.
Equation (1) represents the mean value of the common logarithm of the acceleration response spectrum. To consider the variability of the GMPE in the MCS, the common logarithmic standard deviation σ was used. In the paper of GMPE of Morikawa and Fujiwara [Citation35], σ including both inter-event and inter-site variability is shown as a value of 0.30 to 0.43 for each natural periods. Since it is necessary to consider only inter-event variability in this study, we assumed a constant value of 0.25 within the full periodic range. In addition, the capacity and response of the devices were represented in terms of the pseudo velocity response spectrum Sv (T), which was calculated from the acceleration response spectrum Sa (T), using Equation (5).
3.3. Inter-period correlation
The device response considering the variability of GMPE was calculated in the MCS by relating the mean value of the common logarithm of the acceleration response spectrum to the common logarithmic standard deviation as in Equation (6).
Here, logSa(T) is the common logarithm of the acceleration response spectrum at the natural period T, is the mean value obtained using Equation (1), σ is the common logarithmic standard deviation, and Z is a standard normal random number. We considered the inter-period correlation proposed by Baker and Jayaram, as shown in , when calculating Z at two different natural periods [Citation38]. In particular, Baker and Jayaram considered the observation records of various sites and earthquakes to determine the residual between the observation record and response calculated using the GMPE at T [Citation38]. The researchers calculated the correlation coefficients of the residual at two natural periods and expressed them as a function of natural periods T1 and T2, as shown in . When T1 = 0.3 s and T2 = 3.0 s, the inter-period correlation ρ = 0.25. The variation in the response can thus be considered by using the logarithmic standard deviation for Sa(T) calculated using Equation (6). The variability σ and the inter-period correlation ρ represent the variability in seismic ground motion between the seismic source and the site, and the variability β’ represents the variability in the response of the device.
Figure 4. Contours of the predicted inter-period correlation coefficient vs. T1 and T2 proposed by Baker and Jayaram [Citation38]
![Figure 4. Contours of the predicted inter-period correlation coefficient vs. T1 and T2 proposed by Baker and Jayaram [Citation38]](/cms/asset/3f89604c-34d2-400a-81c9-413da064b2db/tnst_a_1899994_f0004_oc.jpg)
4. Case studies pertaining to the seismic diversity
To examine the actual effectiveness of the seismic diversity and robustness in enhancing the seismic safety of NPPs, feasibility studies were performed for various sites in Japan with different seismic environments. Simple models, in which the damage criteria of each component is defined using seismic intensity, were adopted to illustrate the effectiveness clearly.
4.1. Target sites and ground conditions
We selected 11 sites in Japan that have a characteristic seismic environment predominant to hazards. shows the location of the sites and major seismic sources. shows the characteristics of the seismic environment of each site considered in the selection. In Equation (1), D1400 and Vs30 correspond to conditions with deep sedimentary layers and shallow soft soils, respectively. Because the purpose of this study was to investigate the effect of the seismic environment on the seismic diversity and robustness for NPPs, the ground conditions D1400 = 30 m and Vs30 = 1000 m/s, which are representative for NPP locations, were considered at all the sites, based on the government siting regulations from the seismic safety viewpoint [Citation39].
Table 1. List of target sites and characteristics of seismic environment for each site
Figure 5. Location map of the site and major seismic sources [Citation40]. (The specific site locations are plotted on the J-SHIS’s map.). National Research Institute for Earth Science and Disaster Resilience (2019), J-SHIS, National Research Institute for Earth Sience and Disaster Resilience, <https://doi.org/10.17598/nied.0010>
![Figure 5. Location map of the site and major seismic sources [Citation40]. (The specific site locations are plotted on the J-SHIS’s map.). National Research Institute for Earth Science and Disaster Resilience (2019), J-SHIS, National Research Institute for Earth Sience and Disaster Resilience, <https://doi.org/10.17598/nied.0010>](/cms/asset/33294f03-02bb-4242-b3f6-87cb6837e2b5/tnst_a_1899994_f0005_oc.jpg)
4.2. Seismic environment
The seismic environment data such as the location, magnitude, earthquake type, and average recurrence interval of the seismic source, issued by the National Research Institute for Earth Science and Disaster Prevention on the Japan Seismic Hazard Information Station (J-SHIS) [Citation40] were considered. shows the locations of the major seismic sources issued on the J-SHIS. J-SHIS classifies earthquake types into subduction type and crustal type based on the long-term evaluation of the Headquarters for Earthquake Research Promotion. According to this, the earthquakes on the eastern edge of the Sea of Japan are classified as subduction type. All the seismic sources within a radius of 400 km from the target sites were selected, and values of Mw, shortest distance from the seismic source to the site, occurrence frequency, and earthquake type were set based on the J-SHIS data. Consequently, 310,000 to 470,000 seismic sources were selected at each site. Although J-SHIS evaluates the occurrence frequency in the next 30 or 50 years using both the average recurrence interval and the latest activity time, we evaluated the long-term average occurrence frequency independent of time to examine the nuclear safety. Therefore, the occurrence frequency was evaluated using only the average recurrence interval. Moreover, the maximum value of the average recurrence interval was considered instead of the average value.
4.3. Device capacity
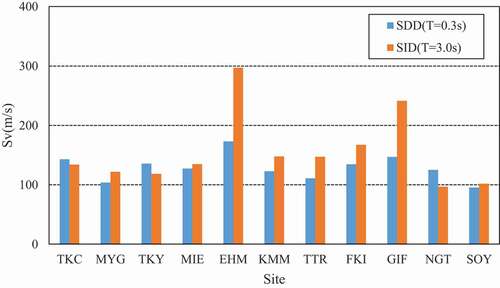
We determined the capacity of the SDDs and SIDs based on the UHS, which was determined considering the seismic environment at each site. Subsequently, the pseudo velocity response spectrum determined based on the acceleration response spectrum corresponding to the annual exceedance frequency of 10−5 (year−1) was set as the median capacity of each device. The natural periods of the SDDs and SIDs were assumed to be 0.3 s and 3.0 s, respectively, as a representation of various SSCs based on the performance of an actual NPP [Citation41–43].
show the hazard curves of the acceleration response spectrum at natural periods of 0.3 s and 3.0 s, respectively. As shown in , the acceleration response spectrum corresponding to the annual exceedance frequency of 10−5 (year−1) existed in the range from 2000 to 3600 cm/s2, and the maximum value was 1.8 times the minimum value. In the case shown in , the range was from 200 to 620 cm/s2, and the maximum value was 3.1 times the minimum value. The maximum values for both the natural periods occurred in EHM, and the largest contribution to the hazard curve corresponded to the earthquake occurring in the Median Tectonic Line fault zone. show the contribution of each earthquake type to the acceleration response spectrum corresponding to the annual exceedance frequency of 10−5 (year−1). The contribution of the subduction earthquakes was relatively large at TKC, TKY and NGT, and the contribution of the crustal earthquakes was considerably large at the other sites. The median capacity of the device is shown in . At sites such as TKC, TKY, and NGT, in which the contribution of the subduction earthquakes to the seismic hazard curves was large, the median capacity of the SDD tended to be larger than that of the SID. In contrast, at sites in which the contribution of the crustal earthquakes was large, the median capacity of the SID was larger than that of the SDD. Specifically, the median capacity of the SID was considerably larger at sites such as EHM and GIF, which may experience earthquakes around Mw7 within 5 km; particularly earthquakes in the Median Tectonic Line fault zone (Mw6.9, shortest distance 3 km) and Shogawa fault zone (Mw7.2, shortest distance 2 km), respectively. It was thus concluded that the median capacity of a device differs considerably depending on the seismic environment at a site.
Figure 6. Hazard curve of the acceleration response spectrum (T = 0.3 s)
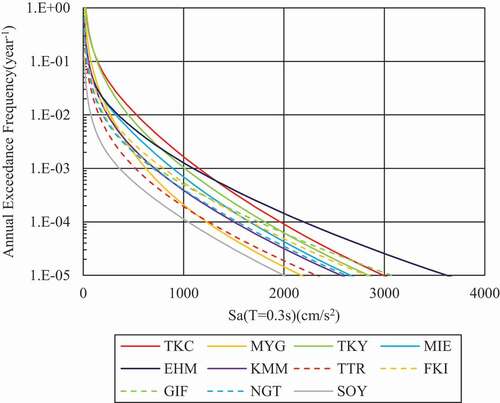
Figure 7. Hazard curve of the acceleration response spectrum (T = 3.0 s)
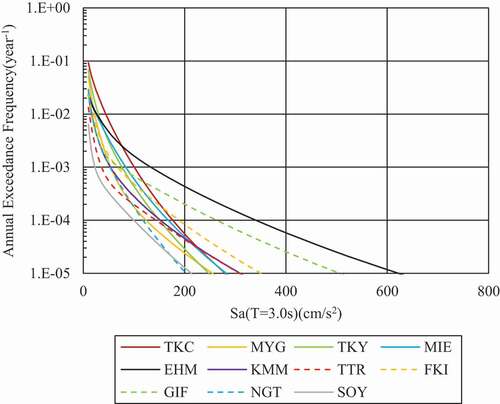
Figure 8. Contribution of the earthquake type to the hazard curve (T = 0.3 s)
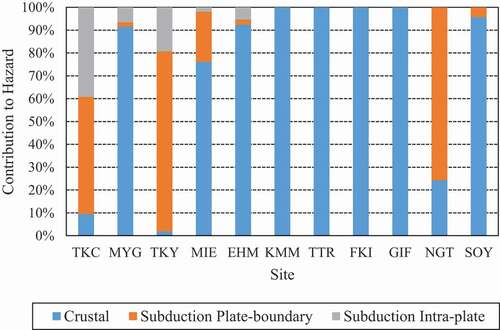
Figure 9. Contribution of the earthquake type to the hazard curve (T = 3.0 s)
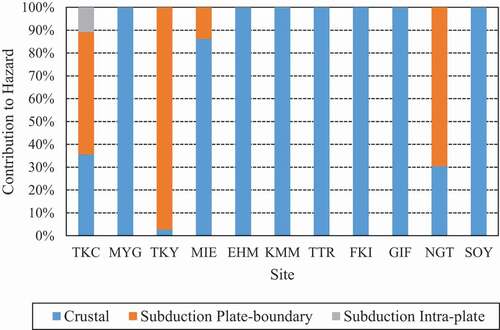
Figure 10. Median capacity of seismic designed and isolated devices
4.4. Evaluation results for the seismic diversity
4.4.1. Relationship between the inter-period correlation and seismic diversity
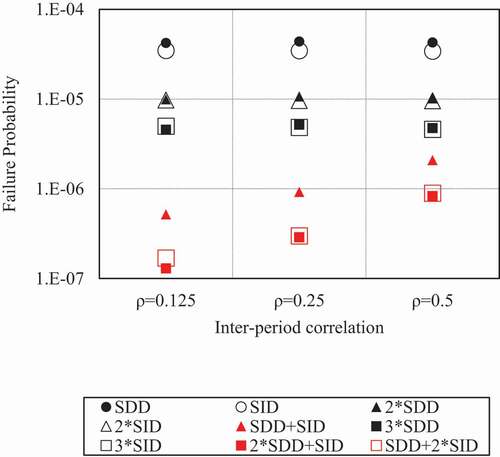
To examine the effectiveness of the multiple strategies and their combinations, we calculated the failure probability of single devices (SDD, SID), dual systems (2*SDD, 2*SID, SDD+SID) and triple systems (3*SDD, 3*SID, 2*SDD+SID, SDD+2*SID). In this paper, the systems including only one type of device (2*SDD, 2*SID, 3*SDD and 3*SID) and both types of devices (SDD+SID, 2*SDD+SID and SDD+2*SID) are referred to as exclusive and inclusive systems, respectively. The inter-period correlation proposed by Baker and Jayaram [Citation38] was obtained from the regression analysis of a large number of seismic observation records, and thus, it exhibits variability. Furthermore, the natural period of the actual structure also exhibits variability. To investigate the relationship between the inter-period correlation and seismic diversity, we conducted sensitivity analyses of three cases with the inter-period correlation ρ = 0.125, 0.25 and 0.5, considering TKY as the target site. Here, ρ = 0.25 is the inter-period correlation corresponding to the natural periods of 0.3 s and 3.0 s, which was proposed by Baker and Jayaram [Citation38]. The capacity (β) and response variabilities (β’) were set as 0.3 and 0.2, respectively. The sample size for one seismic source in the MCS was set as 100,000, based on the results of the sensitivity analysis of the sample size.
shows the relationship between the inter-period correlation and failure probability. In the case of exclusive systems, the failure probability decreases as the number of devices increases, indicating the effectiveness of the multiplicity strategy. Under the same number of devices in the system, the failure probability of the inclusive systems was lower than that of the exclusive systems. Therefore, the effect of the seismic diversity was more desirable compared to that of the multiplicity. Furthermore, the failure probability of the dual inclusive systems (SDD+SID) was lower than that of the triple exclusive systems (3*SDD, 3*SID), which demonstrates the remarkable effectiveness of the seismic diversity strategy. The failure probability of the exclusive systems was not affected by the inter-period correlation, whereas the failure probability of the inclusive systems increased as the inter-period correlation increased owing to the increase in the occurrence probability of the CCF. Nevertheless, even when the inter-period correlation increased, the difference between the failure probability of the single device (SDD, SID) configuration and inclusive systems remained the same. Therefore, the seismic diversity strategy was effective even when the inter-period correlation increased from 0.125 to 0.5. The failure probability of the nine systems decreased in the following order in all the cases: SDD≒SID>2*SDD≒2*SID>3*SDD≒3*SID>SDD+SID>2*SDD+SID≒SDD+2*SID.
Figure 11. Relationship between inter-period correlation and failure probability (TKY, β = 0.3, β’ = 0.2)
4.4.2. Relationship between the capacity variability and seismic diversity
To investigate the relationship between the capacity variability of the devices and seismic diversity, sensitivity analyses were performed considering four cases with β = 0.0, 0.2, 0.3, 0.4 and TKY as the target site. Moreover, for all the cases, ρ = 0.25 and β’ = 0.2.
shows the relationship between the capacity variability of the devices and failure probability. If β = 0.0 and β’ = 0.0, there is no variability in the capacity and response of each device, and they are equal to the median value of each. Therefore, the failure probabilities of single devices (SDD, SID) and exclusive systems are both equal to 10−5.
Figure 12. Relationship between capacity variability and failure probability (TKY, ρ = 0.25, β’ = 0.2)
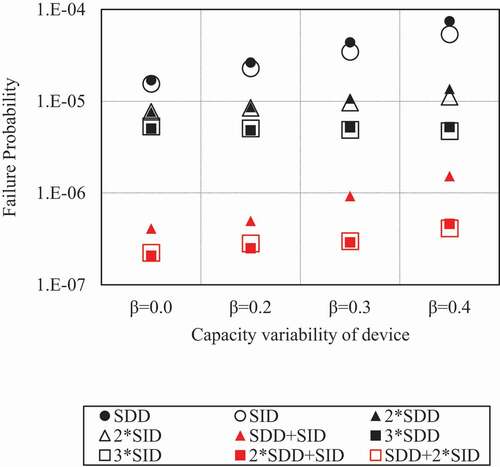
In the case of β = 0.0 and β’ = 0.2 shown on the left side of , the capacities of each device did not have variability and therefore were equal to the median capacities, while the responses had variability and therefore the number of devices whose response was more than the median capacity increased. Therefore, the failure probability of single devices (SDD, SID) was greater than 10−5. On the other hand, in the exclusive system, the correlation of the responses between the devices reduced, so the failure probability was smaller than 10−5.
The failure probability of the single device (SDD, SID) increased as β increased because the number of the devices with a smaller capacity increased. In contrast, the failure probability of the exclusive systems does not increase as much as that for the single device (SDD, SID), as β increased owing to the decrease in the correlation. The failure probability of the inclusive systems increased as the capacity variability increased, although the corresponding increase for the single device (SDD, SID) was higher. In other words, the effectiveness of the seismic diversity increased as the capacity variability increased. Moreover, even when β changed from 0.0 to 0.4, the order of failure probability for the nine systems did not change.
4.4.3. Seismic diversity at each site
show the failure probability of the device and system calculated for the 11 sites shown in . In all the cases, ρ = 0.25, β = 0.3, and β’ = 0.2. The seismic diversity strategy was noted to be effective at all the sites. However, the degree of the effectiveness varied depending on the seismic environment.
Figure 13. Failure probability for each site (ρ = 0.25, β = 0.3, β’ = 0.2) [Citation9]
![Figure 13. Failure probability for each site (ρ = 0.25, β = 0.3, β’ = 0.2) [Citation9]](/cms/asset/be94a8bc-5f56-4668-88e8-f10d9303d31d/tnst_a_1899994_f0013_oc.jpg)
The failure probability of the single device (SDD, SID) and inclusive systems was relatively low and high, respectively, at MYG, TTR and SOY. Therefore, the difference between the failure probability of the two types of systems was relatively small. In other words, the effectiveness of the seismic diversity was relatively low. shows the contribution rate (%) of each seismic source to the seismic hazard curves of natural periods of 0.3 s and 3.0 s. In MYG, TTR and SOY, the contribution rates of one seismic source in both natural periods are more than 50%. shows the slope of the seismic hazard curve. In these sites, the slope was gentle. Such a slope indicates that the failure probability of the single device (SDD, SID) for a seismic source other than the most dominant seismic source was low. Because the most dominant seismic sources in the hazard curves for the SDDs and SIDs were the same, the correlation between the SDDs and SIDs was high, and the failure probability of the inclusive systems was high.
Table 2. List of earthquakes with a high contribution to hazard curves
Table 3. Slope of the hazard curve of the acceleration response spectrum
In contrast, at TKC and TKY, the failure probability of the single device (SDD, SID) was relatively high, and that of the inclusive systems was relatively low. Therefore, the difference between the failure probabilities of the two systems (the single device and the inclusive system) was relatively large, which indicates that the seismic diversity was considerably effective. The seismic hazard curves pertaining to these sites indicated that the seismic hazard curves at the natural periods of 0.3 s and 3.0 s were not dominated by a single common seismic source (see ), and the slope of the hazard curve was steep (see ). Such a slope implies that the failure probability for a single device (SDD, SID) by seismic sources other than the most dominant seismic sources was high. Because the seismic hazard curves of the SDDs and SIDs were not dominated by a single common seismic source, the correlation between the SDDs and SIDs was weak, and the failure probability of the inclusive system was low. As shown in , at TKC and TKY, the contribution of the subduction earthquakes was relatively large.
In summary, the effectiveness of the seismic diversity is affected by the seismic environment of each site. In particular, the effectiveness of the seismic diversity is relatively large when the slope of the seismic hazard curve is steep, and the seismic hazard curves of the SDDs and SIDs are not dominated by a single common seismic source. Moreover, the failure probability for the configurations 2*SDD+SID and SDD+2*SID is similar.
5. Case studies on robustness
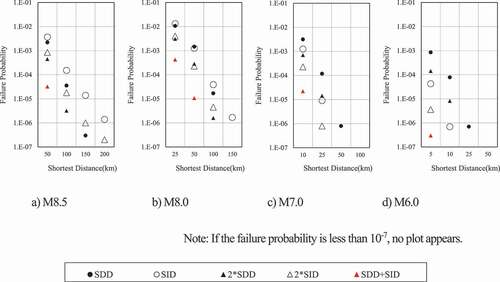
5.1. Study conditions
To evaluate the system robustness quantitatively, we calculated the failure probability of the device and system, considering the magnitude and shortest distance presented in , for TKY as a representative site. Although various parameters affect to the seismic intensity of a specific site, only the magnitude and shortest distance were varied for simplicity. As in the case studies of the seismic diversity, the median capacity of the device was obtained considering the pseudo velocity response spectrum with the annual exceedance frequency of 10−5 (year−1), determined by conducting a PSHA. In this case, ρ = 0.25, β = 0.3, and β’ = 0.2. The sample size for one seismic source in the MCS was set as 10,000,000, based on the results of the sensitivity analysis of the sample size.
Table 4. Cases to analyze the robustness
5.2. Study results
shows the failure probability of the single device (SDD, SID) and dual system for each case. The failure probabilities of the SDDs and SIDs were different and reflected the response spectrum characteristics of the seismic sources. When the failure probability of the single device (SDD, SID) was larger than 10−5, the seismic motion was considered to exceed the design seismic motion at TKY. In such cases, the failure probability of the dual inclusive system was lower than that for the dual exclusive system. Therefore, inclusive systems were noted to be more robust than exclusive systems.
Figure 14. Failure probability of single device and dual system (TKY, ρ = 0.25, β = 0.3, β’ = 0.2)
shows the failure probability for the single device (SDD, SID) and triple system for each case. Similar to that in the case of the dual system, the failure probability for the triple inclusive system was lower than that for the triple exclusive system. Therefore, inclusive systems were noted to be more robust than exclusive systems. In addition, the failure probability was nearly the same for the configurations 2*SDD+SID and SDD+2*SID.
Figure 15. Failure probability of single device and triple system (TKY, ρ = 0.25, β = 0.3, β’ = 0.2)
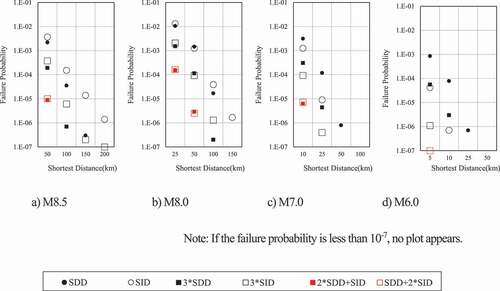
In summary, in the case of both the dual and triple systems, inclusive systems are more robust than exclusive systems. Although the details for the 10 sites other than TKY are not presented herein owing to space limitations, similar results were obtained for all the sites.
6. Conclusion
This paper presents some available definitions for seismic diversity and robustness and then proposes some rigorous quantitative methods to evaluate them. Moreover, the seismic diversity method is applied to assess some real sites in Japan, and the system diversity is investigated using the proposed method for seismic robustness as an illustrative example. The following conclusions and insights are derived from this study.
Seismic diversity is hereby defined as ‘a seismically diverse system that is a parallel system composed of multiple devices with different natural frequencies and dampings to reduce the risk of functional loss to the entire system from the occurrence of a CCF caused by a significant natural disaster.’ The seismic robustness has also been defined herein as ‘the ability of a system to maintain its functionality regardless of the occurrence of various types of beyond-design-basis ground motions.’
A rigorous quantitative method for seismic diversity was proposed and applied to 11 sites in Japan with various seismic environments. From the results of the real environment, the seismic diversity strategy was observed to be effective at all the sites. Nevertheless, the effectiveness of seismic diversity was influenced by the seismic environment of each site. In particular, the seismic diversity was considerably effective when the slope of the seismic hazard curve was steep and the seismic hazard curves of the SDD and SID were not dominated by a single common seismic source.
In addition to (2), the illustrative examples of seismic diversity show that the optimal constitution of the diverse components depends on the seismic environment at each site, and seismic diversity is a more effective strategy compared to multiplicity for ensuring the seismic safety of NPPs.
The seismic robustness is examined for systems with and without diverse components. The results show that the failure probability of an inclusive system was smaller than that of an exclusive system for various beyond-design-basis ground motions. Therefore, we conclude that the inclusive systems are more robust than the exclusive systems.
Since we focus on proposing the quantification methods of seismic diversity and robustness, we used simple models for clarity. However, in the future, we plan to conduct a detailed study considering realistic and specific failure modes and failure locations of devices. Because the seismic diversity and robustness are key concepts in ensuring seismic safety of NPPs, future studies should focus on the identification of appropriate indicators to express the robustness. In addition, the computational burden should be reduced in order to apply these quantitative methods to real complex systems, such as nuclear power plants.
Acknowledgments
We would like to thank Dr. Tamura and Mr. Kuramasu for useful comments. We would also like to thank Dr. Nakajima for useful discussions on seismic hazard analysis. We would also like to thank Dr. Morikawa who provided us with information on GMPE and instructions on how to use it. Finally, I would like to thank Editage for their helpful comments and English proofreading.
Disclosure statement
No potential conflict of interest was reported by the authors.
References
- Defence in Depth in Nuclear Safety. International Atomic Energy Agency; 1996, ( INSAG–10).
- The official report of The Fukushima Nuclear Accident Independent Investigation Commission. Fukushima (Japan): The National Diet of Japan; 2012.
- Five Years after the Fukushima Daiichi Accident. Nuclear energy agency Organization for economic co-operation and development; 2016, ( NEA NO. 7284).
- Implementation of Defense in Depth at Nuclear Power Plants. Nuclear energy agency Organization for economic co-operation and development; 2016, ( NEA NO. 7248).
- Fukushima Nuclear Accident Investigation Report: Tokyo Electric Power Company; 2012. Japanese.
- Takada T. Importance of risk theory for ensuring nuclear safety after the Fukushima accident. J Atom Energy Soc Jpn. 2014;56(4): 34–39. Japanese.
- Ohtori Y, Muta H, Nakajima M, et al. Evaluation of seismic diversity of SSC system in PRA. In: Annual Meeting of Atomic Energy Society of Japan; p.1L11. Mar; Mito:Japan. Japanese; 2019.
- Katayama Y, Ohtori Y, Sakai T, et al. A Framework of RI-PB Design Application for Seismic Events/Part 3: evaluation of seismic diversity of SSCs focusing on response spectrum characteristics of ground motion. In: Annual Meeting of Atomic Energy Society of Japan; p.2K12 Mar; Fukushima:Japan. Japanese; 2020
- Katayama Y, Ohtori Y, Sakai T, et al. A Framework of RI-PB Design Application for Seismic Events/Part 5: evaluation of Seismic Diversity and Robustness for Nuclear Power Plants. In: Annual Meeting of Atomic Energy Society of Japan; p.1L03. Japanese:Sep; Online-meeting; 2020.
- Katayama Y, Ohtori Y, Sakai T, et al. A Framework of RI-PB Seismic Design/Part 2: evaluation of seismic diversity of SSCs focusing on response spectrum characteristics of ground motion. ESREL2020 PSAM15. Nov; Venice: Italy; 2020.
- Baker JW, Cornell CA. Spectral shape, epsilon and record selection. Earthquake Eng Struct Dyn. 2006;35(9):1077–1095.
- Baker JW. Conditional mean spectrum: tool for ground-motion selection. J Struct Eng. 2011;137(3):322–331.
- Mousavi M. Ghafory-Ashtiany M and Azarbakht A. A new indicator of elastic spectral shape for the reliable selection of ground motion records. Earthquake Eng Struct Dyn. 2011;40(12):1403–1416.
- Lin T. Haselton CB and Baker JW. Conditional spectrum-based ground motion selection. Part I: hazard consistency for risk-based assessments. Earthquake Eng Struct Dyn. 2013;(42):1847–1865.
- Lin T. Haselton CB and Baker JW. Conditional spectrum-based ground motion selection. Part II: intensity-based assessments and evaluation of alternative target spectra. Earthquake Eng Struct Dyn. 2013;(42):1867–1884.
- Azarbakht A, Ghodrati AR. The dependence of conditional spectra on the choice of target periods. Scientia Iranica A. 2018;25(1):1–10.
- Ebrahimian H, Azarbakht A, Tabandeh A, et al. The exact and approximate conditional spectra in the multi-seismic-sources regions. Soil Dyn Earthquake Eng. 2012;39:61–77.
- Park J-H, Jeon S-H, Park W, et al. Seismic fragility based on conditional mean spectra for multiple earthquake scenarios. 25th Conf Struct Mech Reactor Technol Transactions SMiRT-25. Aug; Charlotte: NC, USA; 2019.
- Bohn MP, Lambright JA Procedures for the external event core damage frequency analyses for NUREG-1150. Nuclear Regulatory Commission; 1990, ( NUREG/CR-4840 SAND88–3102).
- Seismic Safety Margins Research Program; Systems Analysis (Project VIII). Nuclear Regulatory Commission; 1983, (NUREG/CR-2015, Vol. 8).
- Seismic Probabilistic Risk Assessment Implementation Guide. EPRI; 2013, ( 3002000709).
- Preckshot GG. Method for performing diversity and defense-in-depth analyses of reactor protection systems. Nuclear Regulatory Commission; 1994 ( NUREG/CR–6303).
- Ishikawa M New common sense of nuclear power learned from the nuclear accident part 9 Applying diversity to respond to the threat of natural disasters: denki shinbun web site; 2018 Sep 20. Available from: https://www.denkishimbun.com/sp/32632Japanese
- Kansai Electric Power Co., Inc. Nuclear library. [cited 2020 Feb Jun5]. Available from: https://www.kepco.co.jp/energy_supply/energy/nuclear_power/library/9994350_13857.htmlJapanese
- All about nuclear power: Wisdom coexisting with the earth: Atomic Energy Commission; 2003 [Sep]: 1880. [cited 2020 Feb Jun 5]. Available from: http://www.aec.go.jp/jicst/NC/sonota/study/aecall/index.htmlJapanese
- Basic concepts of nuclear safety: Concept of implementing defense in depth: AESJ-SC-TR005 (ANX2); 2015 [Dec]: 27 Japanese
- Halbaoui K, Boukhetala D, Boudjema F. Introduction to robust control techniques; 2011: 3.
- Mens MJ, Klijn F, De Bruijn KM, et al. The meaning of system robustness for flood risk management. Environ Sci Policy. 2011;14(8):121–131.
- Structural robustness handbook: Australian Building Codes Board; 2016; 8.
- Kranz S, Messingschlager M Evaluation of seismic robustness using plant HCLPF capacity. SMiRT-24; 2017 Aug 20–25; Busan, Korea; 1
- Brett C, Lu Y. Assessment of robustness of structures: current state of research. Front Struct Civ Eng. 2013;7(4):356–368.
- Baker JW. Schubert M and Faber MH. On the assessment of robustness. Struct Saf. 2008;30(3):253–267.
- Stochino F, Bedon C, Sagaseta J, et al. Robustness and resilience of structures under extreme loads. Adv Civ Eng. 2019;4291703:1.
- Göhler SM, Ebro M, Howard TJ. Mechanisms and coherences of robust design methodology: a robust design process proposal. Total Qual Manag Bus Excel. 2018;29(3–4):239–259.
- Morikawa N, Fujiwara H. A new ground motion prediction equation for Japan applicable up to M9 mega-earthquake. J Disaster Res. 2013;8(5):878–888.
- Morikawa N, Fujiwara H Re-examination of site amplification correction term for ground motion prediction equation. The Seismological Society of Japan; 2014 Nov 24–26; Niigata, Japan; 2014.
- Morikawa N, Fujiwara H An additional correction term of ground-motion prediction equation for intra-plate earthquakes. Japan Geoscience Union Meeting; 2015 May 24–28; Chiba, Japan; 2015.
- Baker JW, Jayaram N. Correlation of spectral acceleration values from NGA ground motion models. Earthq Spectra. 2008;24(1):299–317.
- The review meeting on conformity to the new regulatory requirements for nuclear power plants: NRA Japan; [cited 2020 Aug 3]. Available from: https://www.nsr.go.jp/disclosure/committee/yuushikisya/tekigousei.html
- J-SHIS [Internet]. Japan: National Research Institute for Earth Science and Disaster Prevention; [ 2018 Jul 2] [cited 2019 Dec 27]. Available from: http://www.j-shis.bosai.go.jp/map/JSHIS2/download.html?lang=jp
- Kosugi S, Imaoka T, Kanazawa K, et al. Ultimate properties of large-scale lead rubber bearing using full-sale break test. J Struct Constr Eng. 2017;82(732):203–213. Japanese.
- Consideration of application of seismic isolation technology to nuclear power generation facilities. The Institute of applied energy. 2018. Japanese.
- Hoshina H, Chou T, Niwa K An vibrating response analysis of the isolated LWR building considering the shock by failure of multi-layer rubber isolator. 10-th symposium on impact problems of structures of JSCE; 2010. Japanese.