
 ?Mathematical formulae have been encoded as MathML and are displayed in this HTML version using MathJax in order to improve their display. Uncheck the box to turn MathJax off. This feature requires Javascript. Click on a formula to zoom.
ABSTRACT
Pool scrubbing is one of the promising means for mitigating radioactive aerosol release into the environment in nuclear severe accident scenarios. The influence of operational conditions on its performance is therefore of much interest. This paper focuses on the influence of particle number density found in our experiments. The experiments, conducted for insoluble monodispersed (0.5 µm) particles, indicated a sharp decrease in the decontamination factor (DF) for inlet number densities higher than ~1 × 10¹¹ m−3. A model is proposed based on a hypothesis that particle removal becomes inefficient at high number densities because particle condensational growth is limited by the depletion of vapor supersaturation in rising bubbles. The model calculates the magnitude of supersaturation from the bubble mass and energy balances considering the condensational vapor consumption and heat addition by all particles in the bubble, where the rate of condensation on each particle is dependent on supersaturation. The particle size, condensationally growing with time, is then used in the calculation of centrifugal particle removal. It is shown that the model reproduces qualitatively the experimental dependence of DF on particle number density, providing further proof that such dependence is a physical reality deserving attention in the evaluation of pool scrubbing performance.
1. Introduction
Aerosol removal by a pool scrubbing is one of the promising means for limiting the environmental release of radioactive materials in severe nuclear accident scenarios. The efficiency of a pool scrubbing process for removing particulate material depends on the particle properties including the size distribution. The decontamination factor (DF) as a function of particle diameter has been found to exhibit a minimum in the barely submicron (0.1 to 1 µm) regime [Citation1]. This result is important from the nuclear safety point of view because the decontamination in this regime would be relatively inefficient also in other portions of the pass way to the environment. Particles in this size range are, in general, too large for Brownian diffusion to be effective, and too small for inertial impaction or gravitational sedimentation to be effective for removal.
Particle growth due to, e.g. water vapor condensation onto particles, therefore can have a significant influence on DF for such particles. Condensational particle growth, resulting from vapor supersaturation in the gas phase, is considered in computer codes BUSCA and SPARC [Citation2] for prediction of pool scrubbing performance.
The present study is concerned with pool scrubbing data obtained by Sun et al. [Citation3] for monodispersed 0.5 µm insoluble particles injected into low temperature ( 284 K) water. Experimentally observed degradation in pool scrubbing performance (DF) at high particle number densities beyond ~1 ×10¹¹ m−3 is focused on. Such dependence of DF on particle number density has scarcely been reported in literatures. Only a few results can be found for pool scrubbing [Citation4,Citation5] or wet scrubbing in non-pool geometry [Citation6].
In this study, the experimental results [Citation3] are modeled by hypothesizing that the degradation is caused by limited particle condensational growth due to depletion of vapor supersaturation in the bubbles, as the results of vapor consumption and latent heat release by the condensation, both increasing with the particle number density. The depletion of vapor supersaturation has been suggested in the previous paper [Citation3] as one of the possible explanations for the experimental results. Also, it is known to be one of the mechanisms limiting the maximum measurable particle number density for condensation particle counters (CPCs) based on condensational particle growth [Citation7].
2. Experimental description
2.1. Pool scrubbing experiments
A schematic diagram of the experimental apparatus is shown in . Dry air laden with solid test particles is injected upwardly through a 1.0 ×10⁻² m diameter nozzle at the bottom of a 0.2 m inner diameter test section. The particle number densities and diameter distributions in the airflow entering and leaving the test section are measured by aerosol spectrometers (WELAS, PALAS Co.) to derive DF as their ratio. The particle sampling line including the spectrometer at the test section outlet is heated up to 393 K to avoid miscounting caused by water droplets entrained by the air flow. As a result of this heating, however, the condensate water on the solid test particles is also lost before reaching the spectrometer, making infeasible the measurement of particle diameter after condensational growth. Measurement detail and uncertainty are described in [Citation3].
Figure 1. Schematic diagram of the experimental apparatus
The experiments analyzed in the present paper [Citation3] were conducted with insoluble, monodispersed spherical SiO2 particles (Nippon Shokubai Co., KE-S50, 0.5 µm in diameter, amorphous silica) without any surface modification. The particle diameter distribution of the SiO2 aerosol was measured by the aerosol spectrometer at the test section inlet and outlet, confirming that the aerosol was monodispersed with a mode diameter of 0.5 µm and a geometric standard deviation of 1.2–1.3 for both locations [Citation3]. The water depth in the test section was varied in five steps (0, 0.3, 0.8, 1.6 and 2.4 m) and the inlet particle number density stepwise between 6 ×10⁹ and 9 ×10¹¹ m−3. The air injection velocity was kept at 17 m s−1, obtaining a superficial air velocity jg in the test section of around 5 ×10⁻² m s−1. A steady state, typically 20 to 40 minutes in length, was maintained for each water depth and each inlet particle number density to ensure the reliability of measurements for derivation of DF. A steady state was judged to have been reached when the inlet and outlet particle numbers had indicated steady values for more than 5 to 15 minutes. For all the experiments, the inlet air temperature was maintained within 4 K from the water temperature that ranged between 277 and 291 K. The small temperature difference allowed air to equilibrate to the water temperature within a small distance from the nozzle exit. The low water temperatures caused the vapor concentration in the bubbles to be low.
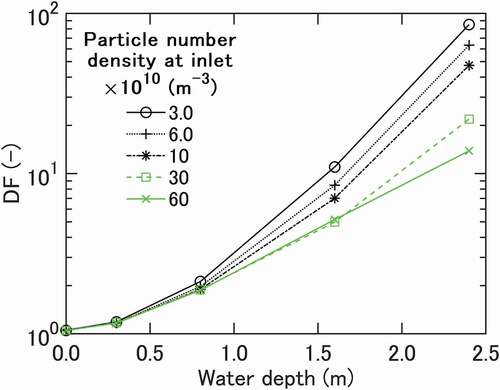
Pool scrubbing data [Citation3] are plotted in in the form of DF curves drawn for different values of, vs. water depth. The curves are derived by interpolating raw data to take account of small discrepancies in
between experimental runs. A basic expectation here is that DF for a given
can be given as a function of the vertical length for which bubbles are scrubbed by water. The curves indicate nearly exponential increases of DF with water depth as expected. Looked at more closely, the curves initially indicate small slope angles that increase but only gradually until a depth of around 1.0 m is reached. The curves then start diverging, resulting in almost an order of magnitude difference in DF at the maximum depth of 2.4 m. Stated differently, DF measured for each depth indicates a decrease with
beyond ~1 ×10¹¹ m−3, and the decrease becomes steeper for larger depths. The dependence on
is relatively weak at depths smaller than around 0.8 m. This is in agreement with experimental observation in [Citation5].
Figure 2. Measured DF plotted against water depth for different initial particle number densities
2.2. Bubble behavior measurements
The model analysis in the present study requires the values of several key parameters to be determined beforehand. Data from bubble swarm measurements conducted for essentially the same gas injection condition as in [Citation3] are used for that purpose. shows the radial distribution of void fraction and bubble Sauter mean diameter both measured with a four-sensor optical probe [Citation8] at 1.6 m above the nozzle for a water depth of 1.9 m. The void fraction distribution, (a), indicates that the rising bubbles concentrate toward the test section central region. The cross-sectionally averaged Sauter mean diameter of 5 ×10⁻³ m from this measurement is used as the value of the bubble diameter in the model. The bubble rise velocity obtained near the center of the test section was around 0.9 m s−1, and was apparently contributed by water circulation driven by the bubble swarm. This value is assigned to the bubble rise velocity
in the model.
Figure 3. Measured (a) void fraction and (b) bubble Sauter mean diameter distributions
The low DF values measured in the initial height <1.0 m are likely to be related to the bubble behavior in this region. High-speed camera (FASTCAM SA-X2) records show that the injected airflow initially forms globules, 8 ×10⁻² to 1.9 ×10⁻¹ m in vertical length, above the nozzle exit. The globules then break up into small bubbles to form a steady bubble swarm within a height of 0.3 to 0.4 m above the nozzle. At 1.6 m above the nozzle, bubbles smaller than 10 mm in diameter prevail the flow and larger bubbles pass intermittently at low frequencies. This observation is consistent with that the flow falls in the transitional regime between bubbly and churn-turbulent flow on the bubble column flow regime map of [Citation9].
3. Modeling
The present study attempts to model the particle removal in the bubble swarm region assuming bubbles rise at a constant velocity. For simplicity, the bubble swarm region is assumed to start at the injection nozzle exit since the measured DFs in the upstream region within 0.3 m from the nozzle exit are less than 1.2 as shown in , suggesting that the bubble configuration in this region has a relatively unimportant influence on particle removal.
The bubble diameter of 5 ×10⁻³ m falls in the ellipsoidal regime [Citation10], where bubbles are known to be oblate spheroidal and exhibit secondary motion, including path instability and shape oscillations. In addition, bubbles in a swarm are subject to coalescence and breakup. While these may well affect bubble internal heat/mass transfer and particle capture, no established way is available for considering such influences in practical calculations. SPARC-90 uses an oblate spheroidal bubble model but assumes a steady, rectilinear bubble rise without secondary motion [Citation2]. A simple, spherical bubble model is employed in the present study. Such model for particle removal, introduced by Fuchs [Citation11], has been adopted in numerous studies as reviewed in [Citation12,Citation13] where the model limitations are also discussed.
3.1. Bubble mass and energy balances
The condensational growth rate of particles depends on the magnitude of vapor supersaturation in the bubble gas phase. The bubble supersaturation, written in terms of vapor concentration, is
where is the vapor concentration and
is the gas temperature in the bubble, both determined by the bubble mass and energy balances. The degree of supersaturation can be defined as
The bubble mass and energy balance equations in the Lagrangian lumped-parameter description are
where is the rate of evaporation on the bubble surface and
the rate of vapor condensation on the particles. The terms in the right-hand side of EquationEquation (4)
(4)
(4) represent rates of the bubble expansion work and the respective heat transfers from water
and from particles
to the bubble. The left hand-side term
can be approximated to be
since always
is held due to the low water temperature and the mass of air
in the bubble can be considered to be constant.
The bubble temperature stays close to the water temperature
during the bubble rise as will be shown later. This leads to that the work term in EquationEquation (4)
(4)
(4) can be approximated by that for an isothermal expansion (
) to obtain
where is the bubble rise velocity (relative to a stationary observer). It is taken to be 0.9 m s−1 based on the above-mentioned experimental observation. Liquid density is used in the hydrostatic pressure term since the cross-sectionally averaged void fraction is less than 0.1 following the experimental results.
3.2. Bubble surface heat and mass transfer
The bubble diameter so defined is applied in determining the value of the bubble-water relative velocity
used in modeling. A correlation of the terminal velocity of a single bubble in quiescent water (EquationEquation (7
(7)
(7) –Equation3
(3)
(3) ) in [Citation10]) based on the form derived from a wave analogy [Citation14] and a correlation on bubble rise velocity used in SPARC-90 (Equation (2.17) in [Citation2]) are used to define
to be 0.24 m s−1.
At the bubble Reynolds number 1.0 ×10³, the liquid-phase resistance for heat transfer can be regarded negligible as compared to the gas-phase resistance. Then, the gas temperature at the bubble inner surface can be approximated to be the water temperature
and the vapor concentration there to be
. This would be valid even when evaporation occurs from the bubble inner surface, as long as the heat required for evaporation per area
is small as in the present study.
The mass and heat transfer rates on the bubble inner surface to the gas phase in the bubble can then be written, using mass and heat transfer coefficients and
, respectively, as
The transfer coefficients are affected by bubble internal circulation that is known to look like Hill’s vortex driven by the liquid flow along the bubble surface. SPARC-90 takes a different approach where the left hand sides of EquationEquations (6)(6)
(6) and (Equation7
(7)
(7) ) are calculated without the use of
or
, but by applying Higbie’s penetration theory. This choice may not be adequate because the theory is based on an assumption that heat (or mass) is transferred into a bulk fluid with uniform temperature (or concentration) [Citation15], while this is not the case for bubbles.
The bubble internal heat (or mass) transfer problem, encompassing the transport over the entire bubble volume, has been solved analytically [Citation10] and numerically [Citation16,Citation17]. These studies are mostly concerned with a transient process toward an asymptotic equilibrium between a bubble and surrounding liquid phase. The asymptotic value at of the Nusselt number
(or the Sherwood number
) has been found to lie between about 6.58 and 18. The lower limit corresponds to pure conduction (or diffusion) situation without internal circulation (
) and the upper limit to
. Here,
is the bubble internal Peclet number (
for heat transfer and
for mass transfer). Both
and
(at
) increase with
but saturate at
200 [Citation16]. The effect of
appears to be small for
1.0 ×10³. For modeling the experiments with
62 for heat transfer and
53 for mass transfer, and
1.0 ×10³,
and
are assumed to be 16 based on the results of [Citation16].
For condensation-free situation , EquationEquations (4)
(4)
(4) and (Equation7
(7)
(7) ) suggest that a steady state (
) can be reached at a certain bubble temperature
, for which the bubble expansion work is balanced out by the water-to-bubble heat transfer
. This is calculated to occur at a temperature difference
of 0.11 K when
is assumed to be 16. The smallness of
justifies the assumption of isothermal bubble expansion used in EquationEquation (5)
(5)
(5) . It also means that the vapor supersaturation available for condensation on particles is small. While
becomes smaller when condensation occurs (
), a quasi-steady energy balance maintains since
controls the rate of condensation.
For the condensation-free situation , the calculated vapor concentration
for
almost equals to
, but decreases with an increase of
. The vapor condensation thus has a two-fold effect to reduce the vapor supersaturation
: it lowers
through vapor consumption at a rate of
and raises
through heat addition at a rate of
, where L is the latent heat of evaporation [Citation7].
3.3. Vapor condensation on particles
Vapor condensation can occur on a solid or liquid surface when it is exposed to a supersaturated environment. For condensation on small particles, the surface tension effect on phase equilibrium on a curved liquid–vapor interface, known as the Kelvin effect, becomes important. Condensation on an insoluble particle of temperature and diameter
can occur only when
shows a conceptual picture of temperature and vapor concentration distributions between the bubble and particle surfaces. A quasi-steady state in the gas phase, involving expansion work and heat and mass transfer, is considered. The present lumped-parameter model represents the bubble temperature and vapor concentration each with a single value, , respectively.
Figure 4. Conceptual picture of temperature and vapor concentration distributions in the bubble
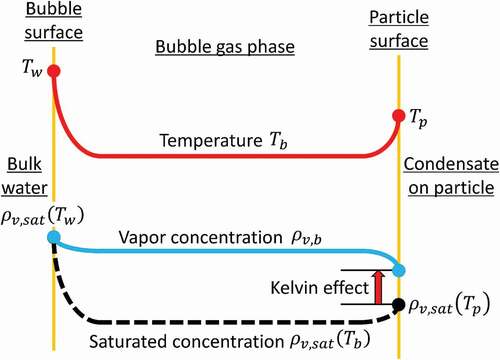
The rate of condensation on particles is determined by the resistance for vapor mass transfer toward the vapor-liquid interface on (wet) particles. Meanwhile, the particle interface temperature
is determined by the resistance for latent heat release to the environment. The rate of condensation is therefore calculated by solving simultaneously the mass and heat transfer equations for the insoluble particles,
where is the total particle surface area
. The creeping flow solution
can be applied to EquationEquations (9)
(9)
(9) and (Equation10
(10)
(10) ) since the particle Reynolds number
is much smaller than unity [Citation10].
The noncontinum effects on mass and heat transfer may become non-negligible for sub- or micrometer-sized particles with Knudsen number not much smaller than unity [Citation18]. The present model does not consider such effects since controversy on the quantitative effects does not seem to have been settled. SPARC-90 neither considers the noncontinum effects [Citation2].
The particle diameter as a function of time is calculated by integrating the growth rate,
3.4. Particle removal
The particles in rising bubbles are subject to Brownian diffusion, centrifugal acceleration and gravity, all causing the particles to be deposited on, captured by, and washed away from the bubble internal surface. The Brownian contribution can be neglected in the present study where 0.5 µm. The centrifugal deposition velocity is modeled by Fuchs [Citation11] to be given by the terminal velocity of the accelerated motion
The right-hand side of EquationEquation (12)(12)
(12) represents the acceleration of a particle which is moving along the curved bubble surface at a local velocity
, times the Stokes relaxation time
where the particle mass is given by
and the Cunnigham slip correction factor
by
[Citation19]. By integrating the particle flux
over the entire bubble surface, Fuchs’s model obtains the rate of particle deposition due to the centrifugal acceleration
which increases approximately as the square of . Here, the particle number density at the bubble surface is represented by the volume averaged density
, and the distribution of bubble surface velocity is taken into account based on the potential flow theory. Likewise, the rate of particle deposition due to the gravitational settling is obtained to be
It is more than one order of magnitude smaller than EquationEquation (14)(14)
(14) for the present case and therefore is ignored. The decontamination factor is given by
3.5. Dilute-aerosol simplifications
The present model includes simplifications applicable to dilute aerosols. The particle concentration in the present work corresponds to the simplifications as follows. First, with the particle number density being <1 ×10¹² m−3, the influence of Brownian coagulation can be ignored. The percentage of particles involved in the coagulation in the bubble traveling time is estimated to be <0.4% by using the Smoluchowski equation [Citation19]. Secondly, with the particle volumetric concentration being <1 ×10⁻⁷ and mass concentration <1 ×10⁻⁴, the fluid dynamic influence of particles on bubble internal circulation can be ignored [Citation20,Citation21]. Thirdly, with the total particle surface area being <0.1% of the bubble surface area, and the SiO2 particles used in the experiments being insoluble and hydrophilic, it seems unlikely that the particle deposition and absorption make persistent influence on the bubble surface mobility. Experimental results in literature show that bubbles larger than about 1 mm in diameters (Re > 100–200) are much less sensitive to surface contamination than smaller ones [Citation22–24].
The present model disregards all these influences. Specifically, the particle growth model (EquationEquation 11(11)
(11) ) ignores coagulation. The particle removal model (EquationEquation 14
(14)
(14) ) assumes that the particle circulation velocity equals to the velocity of fully mobile bubble surface driven by the external flow.
4. Results and discussion
(a) through (c) shows the results of a base case calculation conducted for conditions summarized in . The horizontal axes in these figures indicate the height from the injection nozzle exit. (a) depicts the bubble gas-phase supersaturation defined by EquationEquation (2)
(2)
(2) . The deviation from the baseline supersaturation of around 5.5 ×10⁻³ occurs mainly due to the condensation on particles. The deviation generally becomes greater for higher
, but reflects the change in the condensation rate that is dependent, through EquationEquation (9)
(9)
(9) , on the particle number density
and the particle diameter
.
Table 1. Calculation parameters
Figure 5. Calculation results (base case) of (a) degree of supersaturation , (b) particle diameter and (c) DF
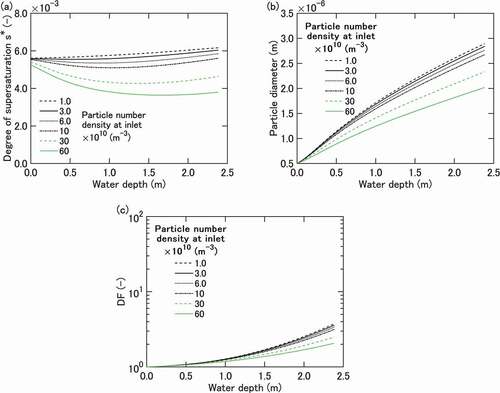
The particle growth shown in (b) generally exhibits a square root dependence on time, characteristic of diffusion/conduction controlled growth [Citation25]. The growth rate is affected by the decrease in ambient supersaturation shown in (a) in particular for
>1 ×10¹¹ m−3.
Finally, DF values shown in (c) reflect the particle growth in (b). Note that EquationEquations 13(13)
(13) through Equation16
(16)
(16) can be rewritten for height
that
. The calculation reproduces qualitatively the experimental dependence of DF on
shown in , but generally underpredicts the DF values. The underprediction is an order of magnitude at the maximum height of 2.4 m. The dependence on
is also underpredicted. A factor of 2 difference in DF at 2.4 m is predicted between the maximum and minimum
cases, vs. a factor of six difference in the experiment.
Underprediction of DF can occur due to (i) underprediction of removal rate for a given
, or (ii) underprediction of growth rate
for a given
, or both. In the present initial value problem for
and
, the two variables are mutually related such that
(EquationEquations 13
(13)
(13) –Equation16
(16)
(16) ) and
(EquationEquations 9
(9)
(9) –Equation11
(11)
(11) ) where
is a decreasing function of
(EquationEquations 2
(2)
(2) –Equation4
(4)
(4) and Equation9
(9)
(9) –Equation11
(11)
(11) ), causing the particle growth to be limited for large
. Integration of the rate equations results in a monotonic decrease of
and a monotonic increase of
with bubble rise time, or height. Due to the characteristics of the problem summarized so far, the influence of a model inaccuracy can be magnified as time proceeds. For instance, if the removal rate is underpredicted for a given
, it would result in a slower growth that tends to reduce the removal rate. Similarly, if the growth rate is underpredicted for a given
, it would result in a slower removal that tends to reduce the growth rate. This, and the fact that only
is measureable, make it difficult to identify the real cause of the model underprediction of DF. Some specific aspects of the present model, likely to be related to the identified problems, are addressed below.
4.1. Particle growth modeling issues
The particle growth is calculated here for small ambient supersaturation comparable to the size-dependent Kelvin effect shown in EquationEquation (8)(8)
(8) . The calculation is therefore sensitive to the assumptions on the initial particle diameter and on bubble mass and energy balances. Two sensitivity calculations were conducted with parameters indicated in .
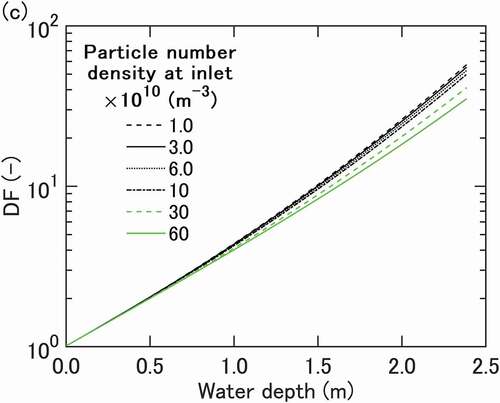
shows that the inclination of each DF vs. water depth curve increases in the initial ~1.0 m region and then apparently stays nearly constant. Comparison of this fact with EquationEquations (14)(14)
(14) and (Equation16
(16)
(16) ) suggests that particle growth is faster in the initial length than in the downstream region where the present assumption of quasi-steady bubble expansion may hold. Therefore, it would be interesting to see what happens if we assume that particle has grown to a certain extent before exposed to the ambient condition predicted by the present model. A sensitivity calculation for
=2.0 µm as case 1 was conducted and the results are shown in . DFs are higher than those in the base case as expected. The sensitivity calculation shows that DF values at 2.4 m comparable in magnitude to the experimental data can be obtained. However, the dependence of DF on initial particle number density is underpredicted for the experimental results and even weaker than that with smaller initial particles as the base case, suggesting that the differential growth of small particles having more important Kelvin effect under small supersaturation is essential for the marked dependence of DF on particle number density.
Figure 6. Sensitivity calculation result of DF for case 1 with larger initial particle diameter of 2.0 µm
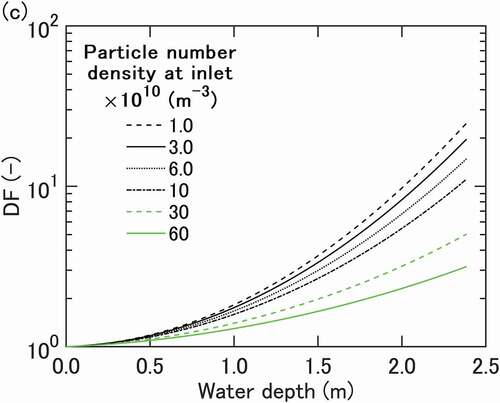
The present lumped-parameter model represents the bubble temperature and vapor concentration each with a single value, and
, respectively. Numerical studies for internal heat transfer at
[Citation17,Citation26], however, show that the local
takes a peak about twice as large as the volume average. Such temperature/concentration nonuniformities may influence the growth of particles recirculating in the bubble: the particle diameter is dependent on the history of ambient supersaturation in a complicated, nonlinear fashion when the Kelvin effect is involved. The present model being unable to consider the temperature/concentration nonuniformities, another sensitivity calculation as case 2 with the parameters in is conducted to see the influence of lager
by lowering bubble mass and heat transfer coefficients. Results for
, half of the value assumed for the base case, are presented in . Higher DFs than the base case are obtained as expected. In addition, the DF values at the maximum height of 2.4 m show around an order of magnitude variation as in the experimental data, i.e. similar dependence of DF on particle number density.
Figure 7. Sensitivity calculation result of DF for case 2 with half bubble heat and mass transfer coefficients of the base case
4.2. Particle removal modeling issues
Fuchs’s model (EquationEquation (14)(14)
(14) ) takes the particle number density near the bubble surface to be the volume average density
. Ghiaassaan and Yao [Citation13,Citation27] and Laker and Ghiaassaan [Citation28] note this approach can underpredict considerably the particle removal rate. A more realistic picture given by these authors is that particles are concentrated near the bubble surface as a result of the centrifugal displacement, developing a nonuniform particle distribution with time after a bubble starts rising. This would result in a larger removal rate than predicted by EquationEquation (14)
(14)
(14) .
The influence of bubble secondary motion has been studied numerically by Akbar and Ghiaasiaan [Citation29] for a single bubble with = 3 ×10⁻³ and 5 ×10⁻³ m presetting an ellipsoidal shape with oscillation and instable zigzag path. The DF for such a wobbling bubble is calculated to be a factor of five or so greater than that for a spherical bubble with similar size but without secondary motion.
These suggested influences on particle removal, together with the limitations in the thermohydraulic model that affect the particle growth, may explain the underprediction of the experimental DF by the present model.
5. Conclusion
An analytical model has been built to understand the causes and implications of experimental findings on degraded pool scrubbing performance at high inlet particle number densities beyond ~1 ×10¹¹ m−3. The model considers condensational growth and centrifugal removal of insoluble solid particles in air bubbles rising in a water pool. The coupling between the particle growth and removal processes, through their dependence and influences on vapor supersaturation in the bubbles, is taken into account on the basis of the bubble mass and energy balances in a lumped-parameter description.
The model predictions reproduce qualitatively the experimentally observed decrease in DF with an increase in inlet particle number densities. The calculated results show that the bubble supersaturation is reduced at high particle number densities, slowing the particle growth and thereby delaying the particle removal from the bubbles. These results provide further proof that the experimentally found behavior of DF for insoluble particles is a real phenomenon to which adequate attention should be paid in the evaluation of pool scrubbing performance at high particle number densities.
For quantitative prediction of the phenomenon, the model clearly needs to be improved. The present model underpredicts considerably the absolute values of DF and their dependence on particle number density. It appears that the tight coupling between the particle growth and removal processes at high number densities, combined with the feedback effects therein, pose difficulties for quantitative prediction of DF. It is also known from model sensitivity calculations and literature that the bubble internal nonuniformities in terms of gas-phase temperature, vapor concentration and particle number density can affect the particle growth and removal rates. These issues will be addressed in our model improvement efforts.
Nomenclature
Table
Acknowledgments
The experimental system was developed under the financial supports of the Nuclear Regulation Authority, Japan (NRA).
Disclosure statement
No potential conflict of interest was reported by the author(s).
Additional information
Funding
References
- Pich J, Schütz W. On the theory of particle deposition in rising gas bubbles: the absorption minimum. J Aerosol Sci. 1991;22:267–272.
- Owczarski PC, Burk KW. SPARC-90: a code for calculating fission product capture in suppression pools, NUREG/CR-5765. USA: Nuclear Regulatory Commission; 1991.
- Sun H, Sibamoto Y, Okagaki Y, et al. Experimental investigation of decontamination factor dependence on aerosol concentration in pool scrubbing. Sci Technol Nucl Install. 2019;1743982:1–15.
- Hashimoto K, Soda K, Uno S, et al. Effect of pool scrubbing of insoluble aerosol in two phase flow in a pipe. Sev Accid Nucl Power Plant. 1988;2:77–86.
- Xu Y, Deng J, Zou Z, et al. Experimental study on aerosol behavior in water pool scrubbing under severe accident conditions. Int J Adv Nucl React Des Technol. 2020;2:111–116.
- Wang Q, Chen X, Guo Z, et al. An experiment investigation of particle collection efficiency in a fixed valve tray washing column. Powder Technol. 2014;256:52–60.
- Lathem TL, Nenes A. Water vapor depletion in the DMT continuous-flow CCN chamber: effects on supersaturation and droplet growth. Aerosol Sci Technol. 2011;45:604–615.
- Shen X, Saito Y, Mishima K, et al. Methodological improvement of an intrusive four-sensor probe for the multi-dimensional two-phase flow measurement. Int J Multiph Flow. 2005;31:593–617.
- Shah YT, Kelkar BG, Godbole SP, et al. Design parameters estimations for bubble column reactors. AIChE J. 1982;28:353–379.
- Clift R, Grace J, Weber M. Bubbles, Drops, and Particles. New York: Dover Publications; 1978.
- Fuchs NA. The Mechanics of Aerosols. Oxford: Pergamon Press; 1964.
- Powers DA. a simplified model of decontamination by bwr steam suppression pools, NUREG/CR-6153 SAND93-2588. USA: Nuclear Regulatory Commission; 1997.
- Ghiaasiaan SM, Yao GF. A theoretical model for deposition of aerosols in rising spherical bubbles due to diffusion, convection, and inertia. Aerosol Sci Technol. 1997;26:141–153.
- Mendelson HD. The prediction of bubble terminal velocities from wave theory. AIChE J. 1967;13:250–253.
- Bird RB, Stewart WE, Lightfoot EN. Transport phenomena. New York: J. Wiley; 2007.
- Colombet D, Legendre D, Cockx A, et al. Mass or heat transfer inside a spherical gas bubble at low to moderate Reynolds number. Int J Heat Mass Transf. 2013;67:1096–1105.
- Juncu G. A numerical study of the unsteady heat/mass transfer inside a circulating sphere. Int J Heat Mass Transf. 2010;53:3006–3012.
- Fukuta N, Walter LA. Kinetics of hydrometeor growth from a vapor spherical model. J Atmos Sci. 1970;27:1160–1172.
- Hinds WC. Aerosol technology: properties, behavior, and measurement of airborne particles. New York: Wiley; 1999.
- Elghobashi S. On predicting particle-laden turbulent flows. Appl Sci Res. 1994;52:309–329.
- Crowe GT. Review-numerical models for dilute gas-particle flows. J Fluids Eng Trans ASME. 1982;104:297–303.
- Bel Fdhila R, Duineveld PC. The effect of surfactant on the rise of a spherical bubble at high Reynolds and peclet numbers. Phys Fluids. 1996;8:310–321.
- Pawliszak P, Ulaganathan V, Bradshaw-Hajek BH, et al. Mobile or immobile? Rise velocity of air bubbles in high-purity water. J Phys Chem C. 2019;123:15131–15138.
- Takagi S, Uda T, Watanabe Y, et al. Behavior of a rising bubble in water with surfactant dissolution (1st report, steady behavior). Trans Japan Soc Mech Eng Ser B. 2003;69:2192–2199.
- Hubmer GF, Titulaer UM. A kinetic model for droplet growth in the transition regime. J Stat Phys. 1991;63:203–219.
- Souccar A, Oliver DL. Transfer from a droplet at high Peclet numbers with heat generation: interior problem. J Heat Transfer. 2007;129:664–668.
- Ghiaasiaan SM, Yao GF. Diffusive and convective deposition of aerosols in rising spherical bubbles with internal circulation. Int J Multiph Flow. 1995;21:907–918.
- Laker TS, Ghiaasiaan SM. Monte-carlo simulation of aerosol transport in rising spherical bubbles with internal circulation. J Aerosol Sci. 2004;35:473–488.
- Akbar MK, Ghiaasiaan SM. Monte Carlo simulation of aerosol transport in rising gas bubbles undergoing shape deformation. J Aerosol Sci. 2006;37:735–749.