
 ?Mathematical formulae have been encoded as MathML and are displayed in this HTML version using MathJax in order to improve their display. Uncheck the box to turn MathJax off. This feature requires Javascript. Click on a formula to zoom.
ABSTRACT
Laboratory experiments and model estimates were carried out to evaluate the effectiveness of sorbent for construction of the Permeable Reactive Barrier (PRB) at downstream of H4 tank area in Fukushima-Daiichi Nuclear Power Station in September 2014. Measurement of cation exchange capacity and X-ray diffraction analyses of crystal structures were carried out for natural zeolites. The Sr adsorption isotherms were measured for these zeolites contacted with water containing Sr or the simulated groundwater containing Na, K, Ma, Ca, and Sr. According to these equilibrium characteristics, Akita-Futastui zeolite was selected as candidate. The zeolite was served for the column tests to obtain Sr breakthrough curves with different conditions such as particle size of zeolite, Darcy Flux, Sr concentration in the simulated groundwater, and mixed bed with gravel. From the breakthrough curves, kinetic properties such as the film mass transfer coefficient and the effective intraparticle diffusivity were derived by fitting with adsorption model. Based on these kinetic properties, Sr breakthrough curves were estimated for the simulated groundwater containing 0.3 ppm Sr passed at 10 cm∙day-1 through 1.5 m thick PRB with zeolite and gravel. The breakthrough points for the PRB with 33 wt.% zeolite was evaluated as more than 70 years.
1. Introduction
Since the accident on March 11th, 2011, highly contaminated water has been generated for cooling the damaged cores, and been treated with decontamination process in the Fukushima Daiichi Nuclear Power Station (Fukushima Daiichi NPS) [Citation1]. The contaminated water was first treated with Cs adsorption apparatus such as KURION and SARRY to remove Cs [Citation2,Citation3]. The treated water was then passed through the reverse osmosis membrane (RO) to be separated into the desalted water and the concentrated water containing other radioactive nuclides. The desalted water was again injected into the damaged core, while the concentrated water was stored in the tanks to wait for next treatment using Advanced Liquid Processing System (ALPS) to remove 62 radioactive nuclides except tritium [Citation4].
On August 19, 2013, leakage of the concentrated water was found in a tank located at H4 (one area of the many tanks keeping disposal water of the contaminated water) north area of Fukushima Daiichi Nuclear Power Station [Citation5,Citation6]. The leaked water was mixed with the rainwater at dike around the tank, and the mixed water of 300 tons estimated at most was spilled on the ground surface [Citation6]. The water in the dike was reported to contain sea salts and radioactive nuclides such as 90Sr (2.8 × 10⁸ Bq∙L−1 in gross), 3H (2.1 × 10⁶ Bq∙L−1), 125Sb (7.1 × 10⁴ Bq∙L−1), 134Cs (4.6 × 10⁴ Bq∙L−1) and 137Cs (1.0 × 10⁵ Bq∙L−1) [Citation6]. As countermeasures to the spread of contamination, the contaminated soil was excavated as much as possible. In addition, groundwater monitoring was continued along with the measures to prevent diffusion of radioactive nuclides via groundwater. Mortar capping to cover the soil surface was constructed for preventing penetration of rainfall into the groundwater. Wellpoints to pump-up the contaminated groundwater were kept operated. As an additional layered measure, improvement of adsorption property of the soil in the downstream of the leaked tank was carried out by replacing the soil with the mixture of gravel and specific adsorbents such as apatite and natural zeolite in September 2014 [Citation7]. No significant increase of gross has been detected for the groundwater sampled at ‘bypass wells’ located at about 140 m downstream from the leaked tank for more than 5 years [Citation8]. This paper describes the basic study carried out for the selection of adsorbent among the natural zeolites for the soil improvement.
The method applied to the soil improvement is so-called, Permeable Reactive Barrier (PRB), defined as an emplacement of reactive media in the subsurface trench designed to intercept a contaminant plume, provide a flow path through the reactive media, and trap the contaminants to attain remediation concentration goals for the groundwater in down-gradient of the barrier as shown in [Citation9,Citation10]. It is a passive, in situ technology having a high potential to treat shallow aquifers at a lower cost than traditional pump-and–treat methods [Citation11]. As for the remediation of radioactively contaminated groundwater, successful deployment of PRBs have been reported for decommissioning of West Valley nuclear fuel reprocessing plant in USA [Citation12–15] and Chalk River National Laboratory in Canada [Citation16]. The several sorbents were tested and then the natural zeolite was decided to use for the PRB at West Valley, because natural zeolite was low cost and adsorption performance of 90Sr [Citation13]. After pilot PRB was constructed at West valley, the natural zeolite by the several production areas were testing to improve the high performance of PRB [Citation15]. In both cases, the natural zeolites were used as adsorbents to trap 90Sr, and long-time durability of the PRBs were confirmed by continued monitoring of the groundwater. Hence, it was applicable to construct the PRB based on two required conditions of the cost and the supply amounts by using the natural zeolites. As known, Japan is a volcanic country with abundant natural zeolites such as clinoptilolite and mordenite. However, there has been little research published on the equilibrium and kinetic datasets for Sr adsorption properties of Japanese natural zeolites. Hence, the authors carried out measurements of both equilibrium and kinetic characteristics of Sr adsorption to select adsorbent for PRB in Fukushima Daiichi NPS among several natural zeolites available in east Japan. With the measured characteristics of the selected zeolite, long time performance to trap 90Sr in the PRB in actual scale was predicted by the model calculation.
Figure 1. Schematic description of Permeable Reactive Barrier
2. Experiments and calculation
2.1 Reagents
Five natural zeolites containing clinoptilolite and/or mordenite were served for this study. They are mined at different Japanese districts such as Futatsui in Akita prefecture (Akita-Futatsui zeolite), Itaya in Yamagata prefecture (Yamagata-Itaya zeolite), Ayashi in Miyagi prefecture (Miyagi-Ayashi zeolite), Shiroishi in Miyagi prefecture (Miyagi-Shiroishi zeolite) and Iizaka in Fukushima prefecture (Fukushima-Iizaka zeolite). The zeolites were heated at 120°C for more than 5 days for drying up, and served for characterization and measurements described in section 2.2. As for the mixed bed experiments, the gravel for construction having the particle size from 1 to 8 mm was used.
For measurement of cation exchange capacity or adsorption property, chemicals such as strontium chloride (SrCl2), calcium chloride dihydrate (CaCl2∙2H2O), magnesium chloride hexahydrate (MgCl2∙6H2O), sodium chloride (NaCl) of >99% purity were purchased from Wako Pure Chemical Industries Co. Ltd., while potassium chloride (KCl) of > 99% purity was purchased from Kojundo Chemical Laboratory Co. Ltd. With using these chemicals, the solutions such as a simulated groundwater and a water containing Sr were synthesized according to the compositions shown in .
Table 1. Composition of the solutions contacted with the natural zeolites
2.2 Experimental procedure
2.2.1 X-ray powder diffraction analysis and cation exchange capacity (CEC) measurement
The natural zeolites were crushed to from powder, and the mineral phases of the zeolites were analyzed with X-ray powder diffractometer (RIGAKU, RINT-2500 V).
The cation exchange capacity (CEC) of natural zeolite was measured with the modified Schollenberger’s method [Citation17] shown in . About 0.1 g of zeolite and 15 cm3 of 1 M ammonium acetate, CH3COONH4, solution were charged together in the tube of Vivaspin® 20 (pore size:0.2 μm, volume:20 cm3). The tube was shaken in 400 rpm at room temperature for 30 minutes, and centrifuged at 5,000 rpm for 10 min. The solution was removed from the tube for analysis, and exchanged with new ammonium acetate solution. After this procedure were carried out 5 times, 15 cm3 of ethanol solution (80 vol.% ethanol) were contacted with zeolite in the tube for rinsing. The tube was shaken at 400 rpm for 30 min, and centrifuged at 5,000 rpm for 10 minutes. The solution was removed, and the zeolite was treated same way two more times. In the next step, 15 cm3 of potassium chloride, KCl, solution (10 wt.% ethanol) was charged into the tube for ammonium desorption. The tube was shaken at 400 rpm for 30 minutes, and centrifuged at 5000 rpm for 10 minutes. This procedure was repeated 5 times.
Figure 2. The procedure of cation exchange capacity measurement
The concentration of sodium, Na, potassium, K, magnesium, Mg, and calcium, Ca in the solution of CH3COONH4 was determined with atomic absorption spectrometer (Thermo Fisher Scientific, S4 or ICE-3500). The ammonium in the extracted solution of KCl was determined by Indophenol blue colorimetry using Ultraviolet-Visible spectrometer (Apel, PD-3500UV).
2.2.2 Equilibrium batch experiments
Five natural zeolites were contacted with the water containing 2 to 2,000 ppm of Sr or with the simulated groundwater containing 50 ppm of Na, 20 ppm of K, 20 ppm of Ca, 20 ppm of Mg and 2 to 2,000 ppm of Sr [Citation7]. Approximately 0.04 g of zeolite and 40 cm3 of the water or the simulated groundwater were charged together in a tube to make ratio of liquid volume/solid weight, V/S, to be 1,000 cm3∙g−1. The tubes were shaken at 120 rpm for more than 150 h. The liquid was filtrated with 0.45 μm filter, and Sr concentration was determined with an atomic absorption spectrometer. The amount of Sr adsorption on zeolite per unit weight, Q, was derived from Equationequation (1)(1)
(1) .
Q (mmol∙g−1): Amounts of Sr adsorption on zeolite per unit weight
C0 (mmol∙cm−3): Initial concentration of Sr
C (mmol∙cm−3): Final concentration of Sr
W (g): Weight of zeolite
V (cm3): Volume of the liquid
According to the adsorption results obtained above, one of five natural zeolites was selected as a candidate adsorbent for PRB, and served for the next experiments.
2.2.3 Dynamic column experiments
The column test equipment shown in consisted of a zeolite column, a plunger pump (Iwaki Pump. EHN-B11VH1R), a tube pump (Tokyo Rikakikai, DC-1500), a pressure gage (Yokokawa Electric, FP-201) and a solenoid valve and the fraction collectors. As for the zeolite column, small acrylic resin vessel of 2 cm inner diameter or large vinyl chloride resin vessel of 4.1 cm inner diameter was used. Approximately 20 or 200 g of the natural zeolite was charged in a small column or a large column with quartz glass wool placed at inlet and outlet of the column as a filter to avoid dispersion of the zeolite. Note the amount of Sr adsorbed in the quartz glass wool was negligible compared with that in the zeolite. The simulated groundwater was supplied from bottom of the column at 0.001–0.1 MPa in gauge pressure. The volume of feed tank was about 600 dm3, while that of recovery tank was about 10 dm3. The temperature of the simulated groundwater was kept at 15°C by circulating the cooling water between a feed tank and a chiller.
Figure 3. The column test equipment
The flow rate of the simulated groundwater was obtained from the rate of weight increase of the recovery tank. The Darcy Flux, v (m∙s−1), was derived from the flow rate, q (m3∙s−1), divided by the cross section of the column, A (m2) according to Equationequation (2)(2)
(2) .
The concentration of Sr in the simulated groundwater in feed tank, C0, and concentrations of Sr in the samples periodically collected from effluent of the column, C, were analyzed with an atomic adsorption spectrometer (Thermo Fisher Scientific, S4 or ICE–3500). In order to derive breakthrough curve, the relative concentration of Sr (C/C0) was to be plotted against the Bed volume which was defined as the volume of discharged groundwater from the column relative to the column volume consisted of the zeolite particles and the void. The column experiments were carried out for the selected natural zeolite with different particle size from 0.15 to 3.0 mm, various Darcy Flux from 3.0 to 15.3 cm∙h−1, and various Sr concentration in the simulated groundwater from 0.18 to 17.5 ppm. Then the mixture of the selected natural zeolite and the gravel in four different mixing ratios were served for the column experiments to simulate the actual constituents of PRB. The obtained breakthrough curves were used for calculation to find suitable kinetic properties such as film mass transfer coefficient, kf, and effective intraparticle diffusivity, Dp, for simulating the performance of PRB in actual scale.
2.3 Calculation model
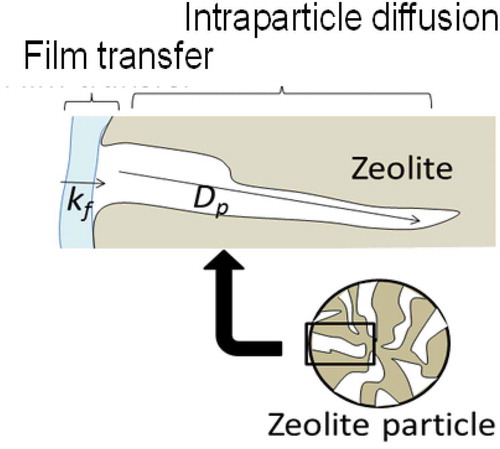
In order to estimate Sr adsorption properties of full scale PRB based on the results of column experiments, the calculational model of the code originally developed for the operation of Cs adsorption apparatus (KURION) in Fukushima Daiichi NPS [Citation2,Citation18] was used. It was a typical column adsorption model based on the film mass transfer and intraparticle diffusion as shown in [Citation19–21]. The model was described by the Equationequations (3)(3)
(3) to (6). The Sr transport within interparticle liquid was given by the Equationequation (3)
(3)
(3) . In the right side of this equation, the first term was the transport by axial dispersion, the second term was the transport by advective flow, and the third term was the transport by adsorption by zeolite.
Figure 4. Model of film mass transfer and intraparticle diffusion
The boundary conditions were described as follows.
As for the transport within intraparticle liquid was given by Equationequation (4)(4)
(4) .
The boundary conditions of Equationequation (5)(5)
(5) were expressed as follows.
As for the axial dispersion coefficient Db, Chung and Wen’s model [Citation21] was used as Equationequation (6)(6)
(6) .
The symbols of the Equationequations (3)(3)
(3) to (6) were defined as follows.
Cb (mol∙m−3): Sr concentration in interparticle liquid
Cp (mol∙m−3): Sr concentration in intraparticle liquid
Db (m2∙s−1): Axial dispersion coefficient
Dp (m2∙s−1): Effective intraparticle diffusivity
kf (m∙s−1): Film mass transfer coefficient
q (mol∙g−1): Amount of adsorbed element per gram of adsorbent
r (m): Radial position within a zeolite particle
R (m): Radius of a zeolite particle
ρ(g∙m−3): Mass density of adsorption medium solid
t (s): Time
U (m∙s−1): Fluid velocity = Darcy Flux/εb
x (m): Axial column position
εb (-): Interparticle void fraction
εp (-): Intraparticle void fraction
ReP(-): Particle Reynolds number
The kinetic properties such as film mass transfer coefficient, kf, and effective intraparticle diffusivity, Dp, were derived by fitting the calculation to the measured breakthrough curves according to the dependency on these factors as shown in . In the former study [Citation3,Citation18], it was demonstrated that the model and the properties obtained in small column experiments were applicable to simulate the adsorption behavior of the actual KURION column of about 1 m diameter and 2 m height. Further details of the models were described in elsewhere [Citation20].
Figure 5. Dependence of breakthrough curves on film mass transfer coefficient (kf) and effective intraparticle diffusivity (Dp)
3. Results and discussion
3.1 Mineral components and cation exchange capacity (CEC)
The X ray powder diffraction patterns of five natural zeolites are shown in . The mineral components of the zeolites were identified with the crystal system of reference [Citation21]. Akita-Futatsui zeolite was found to consists of clinoptilolite, Na6[(AlO2)5(SiO2)30]∙24H2O, while Miyagi-Ayashi zeolite, Miyagi-Shiraishi zeolite and Fukshima-Iizaka zeolite consisted of mordenite, Na8[(AlO2)8(SiO2)40]∙24H2O [Citation22,Citation23]. On the other hand, Yamagata-Itaya zeolite consisted of both clinoptilolite and mordenite.
Figure 6. X-ray powder diffraction pattern of the natural zeolites
shows the exchangeable cations and cation exchange capacity, CEC, of natural zeolites such as Akita-Futatsui, Yamagata-Itaya, Miyagi-Ayashi, Miyagi-Shiroishi, and Fukushima-Iizaka. As for Akita-Futatsui and Fukushima-Iizaka zeolites, reported values [Citation17] are compared in the same table. The exchangeable cations of Akita-Futatsui, Yamagata-Itaya and Miyagi-Shiroishi zeolites were mostly monovalent ions (Na+ and K+), while those of Miyagi-Ayashi and Fukushima-Iizaka zeolites were Na and Ca in comparable amount. As the measured CEC ranged only from 1.1 to 1.4 mmol∙g−1, these natural zeolites have similar ion exchange capacity. The reported CECs for Akita-Futatsui and Fukushima-Iizaka zeolites were larger than the measured ones, suggesting the possibility of composition difference due to different supplier. The natural zeolites have the different exchanged cation of Ca, Mg, K, and Na, and also the performance of Sr adsorption on zeolite is strongly affected by the exchanged cation of Ca, Mg, K, and Na in the zeolite. The performance of Sr adsorption on zeolite cannot be calculated from the composition of Ca, Mg, K, and Na in the zeolite. Consequently, the performance of Sr adsorption on the natural zeolites was necessary to be measured by the equilibrium batch experiments. The performance of the PRB can be calculated to use the adsorption isotherms of the batch experiment by the simulation code.
Table 2. Exchangeable cations and cation exchange capacity (CEC) of natural zeolites
3.2 Equilibrium batch experiments
shows Sr adsorption isotherms for the natural zeolite equilibrated with a water containing Sr2+. The horizontal axis denotes the concentration of Sr in the solution at equilibrium, C (mmol∙cm−3), while the vertical axis denotes the amount of Sr adsorbed per unit weight of zeolite, Q (mmol∙g−1). As seen in this figure, logarithm amount of adsorbed Sr linearly increased with increasing logarithm concentration of Sr in the solution, and became constant at more than 10−5 to 10−3 mmol∙cm−3 of Sr depending on the zeolites. Hence, the adsorption isotherms of Sr in these zeolites were found to follow the Langmuir equation as those of zeolites used for Cs adsorption [Citation2,Citation3]. The broken line in the figure show Langmuir fit for each isotherm. The amounts of Sr adsorption on Akita-Futatsui or Yamagata-Itaya in linear region were about 100 times larger than that on Miyagi-Ayashi. It was suggested that the amounts of Sr adsorption on clinoptilolite zeolites such as Akita-Futatsui and Yamagata-Itaya were larger than those on mordenite zeolites such as Miyagi-Shiroishi, Fukushima-Iizaka and Miyagi-Ayashi. Among the mordenite, the amounts of Sr adsorption on Miyagi-Shiroishi or Fukushima-Iizaka were larger than that on Miyagi-Ayashi. As a conclusion from , the amounts of Sr adsorption for the natural zeolites contacted with water containing Sr were found in the descending order as follows,
Figure 7. Adsorption isotherms of Sr in natural zeolites contacted with a water containing Sr ion
QYamagata-Itaya > QAkita-Futatsui > QMiyagi-Shiroishi = QFukushima-Iizaka > QMiyagi-Ayashi.
As for the natural zeolites equilibrated with the simulated groundwater, Sr adsorption isotherms follow Langmuir equation while the amounts of Sr adsorption were relatively reduced due to the existence of interfering ions such as Ca2+ as seen in . Similar to , the amount of Sr adsorption on clinoptilolite zeolites such as Akita-Futatsui and Yamagata-Itaya were larger than those on mordenite zeolites such as Miyagi-Shiroishi, Fukushima-Iizaka and Miyagi-Ayashi. The amounts of Sr adsorption in the natural zeolites were found in the descending order as follows,
Figure 8. Adsorption isotherms of Sr in natural zeolites contacted with the simulated groundwater
QYamagata-Itaya = QAkita-Futatsui > QMiyagi-Shiroishi = QFukushima-Iizaka > QMiyagi-Ayashi.
The Langmuir adsorption is expressed as the following equation [Citation24].
Q (mmol∙g−1): Amount of Sr adsorbed on zeolite per unit weight
C (mmol∙cm−3): Concentration of Sr in the solution
a (cm∙mmol−1): Langmuir adsorption isotherm constant
b (mmol∙g−1): Maximum monolayer sorbent concentration
This equation has two equilibrium constants; Langmuir adsorption isotherm constant, a, and maximum monolayer sorbent concentration, b, which can be estimated by the least squares fitting of the isotherm. The obtained values of a and b are listed in . As seen in the lines of and , Langmuir adsorption equations using these constants agreed well with the measured values. In the dilute concentration of Sr in less than 10−2 mmol∙cm−3, Langmuir adsorption isotherm constant a dominates the amount of Sr adsorption on the zeolite. According to , clinoptilolite zeolites such as Akita-Futatsui and Yamagata-Itaya have larger a in both solutions than mordenite zeolites such as Miyagi-Ayashi, Miyagi-Shiroishi and Fukushima-Iizaka. Within clinoptilolite zeolites, Yamagata-Itaya zeolite has the largest a among five zeolites in the water, however Akita-Futatsui has the largest a in the simulated groundwater suggesting less influence from other cations such as Na+, K+, Mg2+ and Ca2+.
Table 3. Derived Langmuir constants for the natural zeolites contacted with water or simulated groundwater containing Sr
For comparing with the performance of the zeolite on the other batch test, the distribution coefficient (Kd cm3∙g−1) of Sr on the zeolite are shown in . The distribution coefficient was defined as the Equationequation (8)(8)
(8) . The distribution coefficient on this work was calculated on 0.3 ppm of Sr in the simulated ground water by the Langmuir equation in .
Table 4. Distribution coefficient (Kd) on the several zeolite
The distribution coefficient (Kd) of several zeolites were indicated the distribution between 364 and 5,990 cm3∙g−1 in . Kd of the mordenite (Zeotech Corp) was most high of all–natural zeolite, however the Kd (367-676 cm3∙g−1) of the Japanese mordenite was lower than that of clinoptilolite. On West valley, the clinoptilolite was selected to use the PRB, because the cost of clinoptilolite was cheaper [Citation13]. The Kd on the zeolite (Teague Mineral Products) had the different values from 762 to 2,965 at the several condition batch test. Therefore, the performance of the zeolite was important to be compared by the same batch condition. The Japanese clinoptilolite (Akita and Yamagata) was 1,910 and 1,534 cm3∙g−1, respectively, and have the good performance as considering the comparison of Kd in the zeolites on the difference batch condition.
In the conclusion of this batch equilibrium experiment, Akita-Futatsui’s higher resistance to interference ions can be ascribed to the purity of clinoptilolite observed in X-ray diffraction pattern in . So Akita-Futatsui zeolite was selected for further studies such as column experiments.
3.3 Dynamic column experiments
Column experiments using test equipment shown in were carried out 10 runs for Akita-Futatsui zeolite with different particle size, Darcy Flux and Sr concentration in the simulated groundwater as described in . The composition of other components in the simulated groundwater is shown in .
Table 5. Experimental conditions and results of column experiments for zeolite
From runs C-1 to C-3, dependency of the breakthrough curves on the particle size of zeolite were examined with the zeolites screened by three different sizes of meshes. A large size zeolite ranged from 1.0 to 3.0 mm, while middle size zeolite was between 0.5 and 1.0 mm, and a small size zeolite was between 0.15 and 0.5 mm.
From runs C-3 to C-5, Darcy Flux of the simulated groundwater were varied from 3 to 13 cm∙h−1 by using columns of different inner diameter.
With the runs C-3 and C-6 to C-10, dependency of the breakthrough curves on the initial concentration of Sr in the simulated groundwater were examined. The initial concentration of Sr in groundwater was varied from 0.18 to 17.5 ppm, while that of Na, K, Mg and Ca were unchanged as 50 ppm, 20 ppm, 20 ppm and 20 ppm, respectively.
The relative concentration of Sr (C/C0), calculated from the measured time dependence of Sr concentration in the effluent of the column (C) and the initial concentration (C0), was plotted against the discharged amount of the simulated groundwater divided by the bed volume in order to obtain the breakthrough curves. The results are to be described in the view point of each parameter in the following sections.
3.3.1 Effect of particle size
The measured breakthrough curves for Sr adsorption in Akita-Futatsui zeolite with different particle size are shown in . The particle size distribution of the zeolite were (A) small size (0.15 mm < dP< 0.5 mm), (B) middle size (0.5 mm< dP< 1.0 mm) and (C) large size (1.0 mm< dP< 3.0 mm). As for measured data for small size zeolites, increase of C/C0 was found at around 900 bed volumes suggesting the restructuring of the zeolite bed occurred to form small channels. The kinetic parameters such as film mass transfer coefficient, kf, and effective intraparticle diffusivity, Dp, were derived as by fitting the calculation to the measured breakthrough curves. The results of calculation using these kinetic parameters were plotted as the broken lines in , showing in good agreement with the measured breakthrough curves. Note the behaviors of measured C/C0 at less than 100 bed volumes can be ascribed to the time necessary to form constant plug flow in the column. The derived kinetic properties in shows film mass transfer coefficient, kf, became between 1.5 × 10⁻⁶ and 5 × 10⁻⁶ m∙s−1 and intraparticle diffusivity, Dp, became between 1 × 10⁻⁹ and 8 × 10⁻⁸ m∙s−2, respectively.
Table 6. Derived film mass transfer coefficient (kf) and intraparticle diffusivity (Dp) for Akita-Futatsui zeolite of various particle size
Figure 9. Breakthrough curves for Sr adsorption in Akita-Futatsui zeolite with different particle size; (a) 0.15 mm < dP< 0.5 mm, (b) 0.5 mm< dP< 1.0 mm, and (c) 1.0 mm< dP< 3.0 mm. The broken lines were least square fitting with the model
The water permeability is a key of the important factor to construction of PRB. The permeability of the actual PRB cannot evaluated from the column test, because the height (8 cm) of zeolite in the column was shorter than height (1.5 m) of the actual PRB. The small particle size of zeolite had high decontaminated performance, however, to consider the water permeability in actual PRB of West Valley [Citation14] and Chalk River [Citation9], the zeolite was used the particle size of 14 × 50 mesh (0.3– 1.41 mm). Also, the actual PRB would be included in the small particle size of zeolite, because the distribution of small particle size of zeolite is generated when the PRB was constructed by the large size particle. Hence, it was recommended to use Akita-Futatsui zeolite of large or middle particle size among the tested materials.
3.3.2 Effect of darcy flux
The measured breakthrough curves for Sr adsorption in Akita-Futatsui zeolite with different Darcy Flux are shown in . Three values of Darcy flux, 3.0, 5.2 and 13.0 cm∙h−1, were obtained by using the column of different internal diameters, 2.0, 3.0 and 4.1 cm, respectively. Typical breakthrough curves were obtained for Darcy Flux of 5.2 and 13.0 cm∙h−1, while strange curve was measured for that of 3.0 cm∙h−1. As discussed in the latter of this section, peculiar adsorption behavior for more than 300 bed volumes in ) was due to the interference from other cations. Therefore, the kinetic properties such as kf, and Dp, were derived by fitting the calculation to whole breakthrough curves of ) and ), or to the breakthrough curve of ) from 100 to 300 bed volumes. The results of calculation using these kinetic properties were plotted as the broken lines in , showing good agreement between measured data and broken lines. Note the behaviors of measured C/C0 at less than 100 bed volumes can be ascribed to the time necessary to form constant plug flow in the column. The derived kinetic properties in shows intraparticle diffusivity, Dp, was not changed in same order of 10−10 m∙s−2 with increasing the value of Darcy Flux. The values of kf increased from 2.0 × 10⁻⁷ to 3.2 × 10⁻⁶ m∙s−1 with increasing the value of Darcy Flux, while those of Dp were almost the same, 1.5 × 10⁻¹⁰ to 2.0 × 10⁻¹⁰ m∙s−2. The results suggested that the kinetic characteristic (film mass transfer coefficient, kf) of Sr adsorption was a function of Darcy Flux as expected.
Table 7. Derived film mass transfer coefficient (kf) and intraparticle diffusivity (Dp) for various Darcy Flux
Figure 10. Breakthrough curves for different values of Darcy Flux; (a) 3.0 cm/h, (b) 5.2 cm/h, and(c) 13 cm/h. The broken lines were least square fitting of calculation
In order to clarify the peculiar behavior of Sr adsorption in ), breakthrough curves of the other cations such as Na+, K+, Mg2+ and Ca2+ were compared with that of Sr2+ as shown in . At about 300 bed volumes indicated by the vertical lines in (A) and (B), relative concentration of Sr became constant while relative concentrations of competitive ions such as Ca, K and Na became unity. It shows desorption of Na and adsorption of Ca, K and Sr took place simultaneously until 300 bed volumes. On the other hand, adsorption of only Sr progressed from 300 to 1,000 bed volumes, suggesting the adsorption of Ca, K and Na were saturated at 300 bed volumes. Thinking about the lowest Darcy Flux of this test, the peculiar adsorption behaviour of Sr can be explained by the chemical equilibrium among Sr and other elements. When adsorptions of Ca, K and Na on zeolite were saturated at 300–1,000 bed volumes, these competitive cations did not deposit anymore. Therefore Sr2+ continued depositing with less influence from the competitive cations after the saturation. At around 1,000 bed volumes, adsorption of Sr became saturation at some portion of zeolite, and adsorption of Sr continued until breakthrough point where Sr was saturated in the whole zeolite.
Figure 11. Breakthrough curves of various cation at 3.0 cm∙h-1 of Darcy Flux. (a) The relative concentration of Sr, (b) The relative concentration of cations (Na+, K+, Mg2+ and Ca2+). The broken line is a fitted calculation
And then, the breakthrough curves of the cations such as Na+, K+, Mg2+ Ca2+ and Sr2+ in zeolite with the Darcy Flux at 3.0, 5.2, and 13 cm∙h−1 are shown in (A), (B), and (C), respectively. The adsorbed amount of the cation such as Na+, K+, Mg2+ Ca2+ and Sr2+ in zeolite with the Darcy Flux at 3.0, 5.2, and 13 cm∙h−1 are shown in (D), (E), and (F), respectively. The adsorbed amount of the cation in zeolite was calculated by summation of the amount of exchanged cation by CEC test and the cumulative change of the cation by column test at the bed volume. Total adsorbed amount of the cation in the zeolite was the sum of the adsorbed amount of Sr2+, Ca2+, Mg2+, K+, and Na+. The total adsorbed amount was almost constant (approximately 1.4 mmol∙g−1) at all column test of 3 velocities. Hence, it was considered that the cation ratio in the zeolite was changed by the column test. The relative concentration of Cation firstly became one at Mg2+, and became one at almost same time ofCa2+ and K+, as shown in (A), (B), and (C). Hence, it was suggested that the adsorption of Sr2+ was strongly competed with that ofCa2+, because Sr2+ and Ca2+ were same divalent ion. In the case of 3.0 cm∙h−1, at about 300 bed volumes indicated by the vertical lines in (A), relative concentration of Sr became constant while relative concentrations of competitive ions such as Ca, K and Na became unity. The adsorbed amount of Ca in (D) became constant approximately 7.0 × 10⁻² mol∙g−1 at more than 300 bed volume. In the case of 5.2 cm∙h−1, at about 380 bed volumes indicated by the vertical lines in (B), The relative concentrations of competitive ions such as Ca, K and Na became unity. The adsorbed amount of Ca in (F) became constant approximately 1.2 × 10⁻¹ mol∙g−1 at more than 380 bed volume. In the case of 13 cm∙h−1, at about 370 bed volumes indicated by the vertical lines in (C), the relative concentrations of competitive ions such as Ca, K and Na became unity. The adsorbed amount of Ca in (F) became constant approximately 1.4 × 10⁻¹ mol∙g−1 at more than 360 bed volume. The adsorbed amount of Ca in zeolite at 3.0 cm∙h−1 was smaller than that of Ca in zeolite at 5.2 and 13 cm∙h−1, so the adsorbed amount of Sr at at 3.0 cm∙h−1 was possible to be adsorbed larger than that of Sr at 5.2 and 13 cm∙h−1. Consequently, it was considered that the peculiar behaviour of Sr adsorption was shown in ).
Figure 12. Breakthrough curves of various cation at 3.0 (a), 5.2 (b), and 13 cm∙h−1 (c) of Darcy Flux. Change of the accumulated amount of cation on zeolite at 3.0 (d), 5.2 (e), and 13 cm∙h−1 (f) of Darcy Flux
For verification of this behaviour, further test was carried out to simulate the effect of saturation of Ca, Mg and K on adsorption of Sr in the column experiment. Equilibrium batch experiments to measure the amount of adsorbed Sr on Akita-Futatsui zeolite was repeated 11 times with contacting new simulated groundwater containing Na, K, Mg, Ca and Sr in each time. shows the concentration of adsorbed Sr in the zeolite and the concentrations of cations in the exchanged solution relative to initial concentration plotted against the equilibrium concentration of Sr in the solution. As shown in ), Mg was first saturated at 4 × 10⁻⁷ mmol∙cm−3, then K was saturated at 8 × 10⁻⁷ mmol-Sr∙cm−3, and finally Ca was saturated at around 1 × 10⁻⁶ mmol-Sr∙cm−3. As for Sr behaviour in ), concentration of Sr in zeolite increased linearly until saturation of Ca, then deviated positively from the linear broken line. It is suggested that the saturation limit of equilibrium concentration of Sr in zeolite was increased after the saturation of other cations.
Figure 13. Sr adsorption isothermal of Akita-Futatsui contacted with the simulated groundwater and the breakthrough curves of cations in the equilibrium batch experiment repeated 11 times; (a) adsorption of Sr in zeolite, (b) relative concentrations of cations. The broken line is a least square fit of Langmuir equation
Consequently, the behavior that relative concentration of Sr in the solution kept constant after saturation of other competitive cations can be ascribed to the chemical equilibrium among these elements. As the chemical equilibrium worked to reduce the relative concentration of Sr in the effluent of the column, the derived breakthrough curve of Sr adsorption was considered as conservative estimate of the actual adsorption.
3.3.3 Effect of Sr concentration
shows the breakthrough curves for Akita-Futatsui zeolite contacting to the simulated groundwater with different Sr concentration. The initial concentrations of Sr (C0) were (A) 0.2 ppm, (B) 0.3 ppm, (C) 0.5 ppm, (D) 0.7 ppm, (E) 2.1 ppm, (F) 17.5 ppm, respectively. Similar breakthrough curves were obtained for the concentration of Sr between 0.2 and 2.1 ppm, while steeper breakthrough curve was obtained for Sr concentration of 17.5 ppm. The steep breakthrough curve of (F) and steep rise seen in (E) may be ascribed to the saturation plateau of Langmuir isotherm for Akita-Futatsui began at around few ppm of Sr as shown in . The kinetic properties such as film mass transfer coefficient, kf, and effective intraparticle diffusivity, Dp, were derived as by fitting the model described in section 2.3 to the measured breakthrough curves. The results of calculation using these kinetic properties were plotted as the broken lines in , showing in good agreement with the measured breakthrough curves except ).
Table 8. Derived film mass transfer coefficient (kf) and intraparticle diffusivity (Dp) for various Sr concentration in simulated groundwater
Figure 14. Breakthrough curves for Akita-Futatsui zeolite contacting to the simulated groundwater with different Sr concentration. The initial concentrations of Sr (C0) were (a) 0.2 ppm, (b) 0.3 ppm, (c) 0.5 ppm, (d) 0.7 ppm, (e) 2.1 ppm, (f) 17.5 ppm. The broken lines were fitted calculation
In order to clarify the adsorption behaviors for the breakthrough curve of (B), the breakthrough curve for Sr adsorption was compared with relative concentrations (C/C0) of other cations (Na, K, Mg and Ca) as shown in . The curvature of breakthrough curve decreased at around 300 bed volumes where adsorption of Mg and K and desorption of Na reached saturation, suggesting the chemical equilibrium among Sr and other competitive cations controlled the relative concentration as discussed for ).
Figure 15. Breakthrough curve of various cations for Akita-Futatsui zeolite contacted with simulated groundwater containing 0.3 ppm of Sr; (a) relative concentration of Sr, (b) relative concentration of other cations (Ca, Mg, K, and Na). The broken line was a fitted calculation
3.4 Column experiment for mixture of zeolite and gravel
For simulating the adsorption behavior of actual constitute for PRB in Fukushima Daiichi NPS, mixtures of natural zeolite and the gravel in different mixing ratios were served for the column experiments shown in . As the natural zeolite, Akita-Futatsui zeolite having the particle size of 0.5 to 1.0 mm was used according to the results described in the former sections. On the other hand, ordinal gravel of 1 to 8 mm in diameter was used. It was demonstrated beforehand that the amount of Sr adsorbed on the gravel was negligible compared with that on Akita-Futatsui zeolite.
The experiments were carried out with the mixture of natural zeolite and the gravel in different mixing ratio such as 10.3 wt.%, 20.3 wt.%, 33.6 wt.%, 65.9 wt.% of Akita-Futatsui zeolite and gravel in balance. The simulated groundwater containing about 2 ppm of Sr was supplied to the column of 2 cm internal diameter with Darcy Flux of 10 to 14 cm∙h−1. Other experimental conditions for the column experiments with zeolite and gravel mixture are listed in with those for the test with 100% zeolite as comparison. shows the breakthrough curves of Sr adsorption for the mixtures of zeolite and gravel in different mixing ratio. With increasing the fraction of zeolite, the slope of breakthrough became gentle and the breakthrough points delayed. The point where relative concentration of Sr become 0.1 was increased from approximately 90 to 340 bed volumes with increasing the fraction of zeolite from 20 to 66 wt% of the mixture with gravel.
Table 9. Experimental conditions and results of column experiments for mixture of Akita-Futatsui zeolite and gravel
Figure 16. Breakthrough curves of Sr adsorption for the mixtures of zeolite and gravel contacted with the simulated groundwater. The content of zeolite was (a) 10%, (b) 20%, (c) 33%, (d) 66%, and (e) 100%, respectively. The broken lines are fitted calculation
In order to model the column of zeolite and gravel mixture, effective volume of zeolite bed was assumed. As schematically shown in , the mixed bed (left) can be replaced by a hypothetical zeolite bed (right) having same bulk density as the portion of zeolite in the mixed bed because the gravel works as neither adsorbent nor permeable material. Hence the Interparticle void fraction of zeolite was the assumption of the same value between zeolite only column and the mixed column with the zeolite and the gravel. The height, H2, of hypothetical zeolite bed was calculated by the equation,
Figure 17. Model for the mixture of zeolite and gravel
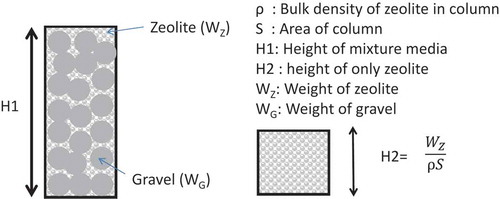
where is bulk density of zeolite in the mixture, Wz is weight of zeolite charged in the mixed bed and S is cross section of the column, respectively. The kinetic properties such as film mass transfer coefficient, kf, and effective intraparticle diffusivity, Dp, were derived as by fitting the model described in section 2.3 with hypothetical zeolite bed to experimental breakthrough curves. As shown by the broken lines in , calculated breakthrough curves for 10 and 20 wt.% zeolite agreed well with the experimental breakthrough curves, while those for 33 and 66 wt.% zeolite exhibited lower relative Sr concentration in the latter half of experimental breakthrough curves than that of calculated curves. As shown in , increase of breakthrough curve was suppressed at around 130 bed volumes where adsorption of Mg and Ca and desorption of Na reached saturation, suggesting the chemical equilibrium among Sr and other competitive cations controlled the relative concentration as discussed in former sections. Although the influence of chemical equilibrium among Sr and competitive cations was not incorporated into the model, calculation of breakthrough curve using hypothetical zeolite bed was thought to be applicable to simulate the actual constitute of PRB because the contents of these minor elements in the natural zeolite tend to change and the chemical equilibrium worked to suppress the relative concentration of Sr lower than the calculation.
Table 10. Film mass transfer coefficient (kf) and intraparticle diffusivity (Dp) for mixture of zeolite and gravel
Figure 18. Breakthrough curve of various cation for 33 wt.% zeolite and gravel mixture bed; (a) relative concentration of Sr, (b) relative concentration of cation (Ca, Mg, K, and Na). The break line was a simulation curve. The broken line was a fitted calculation
3.5 Calculation to simulate Sr adsorption behavior of full-scale PRB
Full scale PRB was assumed to be constructed with the mixed bed of Akita-Futastui zeolite and gravel. The thickness of PRB was thought to be 1.5 m, and the flow rate of the groundwater at construction area was 10 cm∙day−1 (0.42 cm∙h−1) of Darcy Flux. Under these constraints, breakthrough curve for the full scale PRB was estimated by the model described in the section 2.3 using the kinetic properties such as film mass transfer coefficient (kf) and effective intraparticle diffusivity (Dp) obtained by the column experiments. As for the groundwater, concentration of Sr was assumed to be 0.3 ppm while those of K, Mg, Ca and Na were 20 ppm, 20 ppm, 20 ppm and 50 ppm, respectively. The kinetic properties were assumed to be 1 × 10⁻⁶ m∙s−1 for kf, 1 × 10⁻¹⁰ m∙s−2 for Dp, because Darcy Flux was lower than the experimental condition. shows the breakthrough curves calculated for the full scale PRB made of zeolite and gravel in the mixing ratio of 33 wt.%, 66 wt.% and 100 wt.% of zeolite. In this study, the life of PRB was defined as the breakthrough point (C/C0 = 1) of natural Sr, because the contaminated period or the concentration of 90Sr in the ground water cannot decide in Fukushima Daichi nuclear power station. From the calculated breakthrough curves, breakthrough point (C/C0 = 1) for the full scale PRB were evaluated as 70 years for PRB made of 33 wt.% of zeolite, 120 years for PRB made of 66% zeolite, and about 150 years for PRB made of 100% zeolite.
Figure 19. Estimated breakthrough curves for 1.5 m thick PRB made of 33%, 66% and 100% of zeolite operated for the groundwater of 10 cm/day (Darcy Flux) based on the kinetic properties obtained with column experiments
In order to confirm the validity of these breakthrough points, sensitivity of breakthrough curve to the assumed kinetic properties were calculated. ) shows breakthrough curve changed very little against the change of kf from one tenth to ten times of the assumed value, 1 × 10⁻⁷ to 1 × 10⁻⁵ m∙s−1. On the other hand, breakthrough curve varied a little with the change of Dp to one tenth of the assumed value, 1 × 10⁻¹¹ m∙s−2 as shown in ). Even for the change of Dp from 1 × 10⁻¹¹ to 1 × 10⁻⁹ m∙s−1, which is far beyond the values obtained in the column experiments, the breakthrough point changed only from 80 years to 70 years. Hence the breakthrough point of the full scale PRB with containing 33 wt.% of zeolite in the mixture with gravel was expected at least 70 years.
Figure 20. Breakthrough curves for full scale PRB made of 33 wt.% zeolite calculated with different kinetic properties
4. Conclusion
Laboratory experiments and model estimates were carried out to evaluate the effectiveness of adsorbent material for construction of PRB at downstream of H4 tank area in Fukushima Daiichi Nuclear Power Station in September 2014. Obtained results of this study were concluded as follows.
(1) Mineral components and CEC of natural zeolites
According to X-ray diffraction analyses, mineral components of natural zeolites were identified for Akita-Futatsui zeolite, Miyagi-Ayashi zeolite, Miyagi-Shiraishi zeolite, Fukshima-Iizaka, and Yamagata-Itaya zeolite. The measured values of CEC ranged only from 1.1 to 1.4 mmol∙g−1, suggesting these natural zeolites have similar ion exchange capacities. On the other hand, amounts of Sr adsorption to the natural zeolites from the simulated groundwater were in the descending order as follows, QYamagata-Itaya = QAkita-Futatsui > QMiyagi-Shiroishi = QFukushima-Iizaka > QMiyagi-Ayashi . In addition, amount of Sr adsorption to Akita-Futatsui zeolite was found to be less sensitive to co-existing cations such as Na+, K+, Mg2+ and Ca2+ than that to other natural zeolites. According to these equilibrium characteristics, Akita-Futastui clinoptilolite zeolite was selected for the candidate adsorbent of PRB.
(2) Breakthrough curves and kinetic properties of Akita-Futatsui zeolite
Breakthrough curves for Sr adsorption on Akita–Futatsui zeolite were measured with different particle size of zeolite, Darcy Flux and Sr concentration in the simulated groundwater. The derived kinetic properties such as kf and Dp mainly depends on Darcy Flux and particle size of the zeolite. With increasing the range of particle size from 0.15–0.50 mm to 1.00-3.00 mm, the value of Dp increased from 8.0 × 10⁻¹¹ to 1.9 × 10⁻⁹ m∙s−2 while the value of kf changes little. On the other hand, the value of kf increased from 2.0 × 10⁻⁷ to 3.2 × 10⁻⁶ m∙s−1 while the value of Dp changes little with increasing Darcy Flux from 3.2 to 13.2 cm∙h−1. Though discrepancy was found in the breakthrough curve for small Darcy Flux due to chemical equilibrium among Sr and competitive cations, the obtained breakthrough curve was considered as conservative estimate of the actual adsorption.
(3) Breakthrough curves and kinetic properties for Akita-Futatsui zeolite and gravel mixture
With increasing the fraction of zeolite, the slope of breakthrough became gentle and the breakthrough points delayed. The point where relative concentration of Sr become 0.1 was increased from approximately 90 to 340 bed volumes with increasing the fraction of zeolite from 20 to 66 wt.% of the mixture with gravel. By assuming the hypothetical zeolite bed which had same density of zeolite as that of mixture bed except the volume of gravel, calculated breakthrough curves agreed well with measured breakthrough curves between 30 and 150 bed volumes. The derived kinetic properties were approximately 10−5 m∙s−1 for kf and 10−11 m∙s−2 for Dp regardless to the fraction of zeolite in the mixed bed.
(4) Calculation to simulate Sr adsorption behavior of full-scale PRB
Breakthrough curves of Sr adsorption were estimated for 1.5 m thick PRB consisted of Akita-Futatsui zeolite and gravel contacted with the simulated groundwater containing 0.3 ppm Sr at 10 cm∙day−1 of Darcy Flux by assuming 1 × 10⁻⁶ m∙s−1 of kf and 1 × 10⁻¹¹ m∙s−2 of Dp . The breakthrough point (C/C0 = 1) for the full scale PRB with containing 33 wt.% of zeolite in the mixture with gravel was expected at least 70 years.
After the PRB in Fukushima Daiichi nuclear power station was constructed on September 2014, the performance of PRB has been maintaining cause 90Sr in by-pass groundwater was not detected until October 2020. As such, if the PRB will be constructed, the approach of this study would be applicable to design effectively of the performance of the PRB.
Acknowledgments
The authors would like to acknowledge Dr. K. Inagaki for the meaningful discussion about simulation model. Also, the authors express their thanks to Mr. N. Tanaka, Mr. K. Kurahashi, and Ms. M. Tsushima for chemical analytical support.
Disclosure statement
No potential conflict of interest was reported by the author(s).
References
- Tokyo Electric Power Company Inc. Fukushima daiichi; status of contaminated WATER Measures. [ cited 2020 Jun 8]. Available from: https://www.tepco.co.jp/en/hd/decommission/progress/watermanagement/index-e.html
- Koyama T, Tsukada T, Uozumi K, et al. Early construction and operation of highly contaminated water treatment system in fukushima daiichi nuclear power station. Proceedings of GLOBAL2011; 2011 Dec 11; Makuhari, Chiba Japan; 2011.
- Hijikata T, Tsukada T, Koyama T, et al. Early construction and operation of the highly contaminated water treatment system in fukushima daiichi nuclear power station (II) – dynamic characteristics of KURION media for Cs removal in simulated contaminated water. J Nucl Sci Technol. 2013;51(7–8):894–905.
- Tokyo Electric Power Company Inc. Multi-nuclide removal equipment. Japanese. Available in 2012 Mar 28. http://www.tepco.co.jp/en/nu/fukushima-np/radmap/images/m120328_01-e.pdf.
- Tokyo Electric Power Company Inc. Leak out from H4 tank area. Japanese. [cited 2020 June 8]. Available in http://www.tepco.co.jp/nu/fukushima-np/handouts/2013/images/handouts_130821_12-j.pdf.
- Tokyo Electric Power Compony Inc. Fukushima Daiichi Nuclear Power Station Leakage from the Contaminated Water Storage Facility RO Concentrated Water Reservoir (Final Report), Available from: Oct 2014. https://www.tepco.co.jp/en/press/corp-com/release/betu14_e/images/141031e0501.pdf.
- Aikyo Y, Shimura S, Mizunashi Y, et al. Collection of strontium from the soil in fukushima daiichi nuclear power station, 30th Summer Seminar, NUCE-AESJ. Japanese. 2014. 2014, Aug. Available from: http://nuce.aesj.or.jp/_media/ss:ss30:poster-08.pdf
- Tokyo Electric Power Company Inc. Concentration change of groundwater in bypass well, from September 2013 to June 2020 Japanese. [cited 2020 June 8]. Available from: https://www.meti.go.jp/earthquake/nuclear/decommissioning/committee/osensuitaisakuteam/2020/05/3-1-6.pdf.
- US-EPA (National network of environment studies fellow. Kate Bronstein): permeable reactive barrier for inorganic and radionuclide contamination. Aug 2005. Available from; http://large.stanford.edu/courses/2015/ph241/khalaf2/docs/bronstein.pdf.
- Naftz DL, Morrison SJ, Davis JA, et al. Handbook of Groundwater Remediation Using Permeable Reactive Barriers: applications to Radionuclides, Trace Metals. and Nutrients. New York (NY): Academic Press; 2002.
- Lee DR, Smyth DJA, Shikaze SG, et al. Wall-and-curtain for passive collection/treatment of contaminant plumes, in: designing and applying treatment technologies: remediation of Chlorinated and Recalcitrant Compounds. Proceedings of the First International Conference, Monterey, California. Battelle Press; 1998 May 18, Columbus, OH, USA77–84; 1998.
- Chamberlain JJ, Michalczak L, Seneca S. Design and installation of a permeable treatment wall at the West Valley Demonstration Project to mitigate expansion of Strontium-90 contaminated groundwater, Waste management Symposium; February 27 - March 3; Phoenix, AZ, USA; 2011.
- Furhmann M, Aloysius D, Zhou H, et al. Permeable, subsurface sorbent barrier for 90Sr: laboratory studies of natural and synthetic materials. Waste Manage. 1995;15(7):485–493.
- Rabideau AJ, Benschoten JV, Patel A, et al. Performance assessment of a zeolite treatment wall for removing Sr-90 from groundwater. J Contam Hydrol. 2005;79(1–2):1–24.
- Rabideau AJ, Seneca SE, Bronner CE, ROSS E. Laboratory Testing of Zeolitic Materials Submitted by Department of Civil, Structural and Environmental Engineering University at Buffalo, 2009 WVDP-506, West Valley Demonstration Project, West Valley Environmental Services LLC.
- Lee DR, Hartwig DS. Interception of a groundwater plume containing strontium-90, in: waste Management, Decommissioning and Environmental Restoration of Canada’s Nuclear Activities. Toronto, Ontario, Canada:Canadian Nuclear Society;2012 Sept 11–14.
- Wajima T, Ikegami Y. Synthesis of zeolitic materials from waste porcelain at low temperature via a two-step alkali conversion. Ceram Int. 2007;33(7):1269–1274.
- Inagaki K, Hijikata T, Tsukada T, et al. Early construction and operation of the highly contaminated water treatment system in fukushima daiichi nuclear power station (III) –a unique simulation code to evaluate time-dependent Cs adsorption/desorption behavior in column system. J Nucl Sci Technol. 2013;51(7–8):906–915.
- Berninger JA, Whitley RD, Zhang X, et al. A versatile model for simulation of reaction and nonequilibrium dynamics in multicomponent fixed-bed adsorption processes. Comput Chem Eng. 1991;15(11):749–768.
- Ruthven DM. Principles of adsorption and adsorption process. New York (NY): Jon Wiley & Sons Inc.; 1984.
- Chung SF, Wen CY. Longitudinal dispersion of liquid flowing through fixed and fluidized beds. AIChE J. 1968;14(6):857–866.
- Berck DW. Zeolite molecular sieves. New York (NY): Jon Willey & Sons Inc; 1974.
- Wajima T. Ion exchange properties of Japanese natural zeolites in Seawater. Anal Sci. 2013;29(1):139–141.
- Keii T. Adsorption. Japanese: Kyoritsu-zensyo; 1965.