
ABSTRACT
To validate the accuracy of the general-purpose Monte Carlo Particle and Heavy-Ion Transport code System (PHITS), a benchmark study of the recent version (version 3.24) of PHITS has been conducted using neutron-shielding experiments listed in the Shielding Integral Benchmark Archive and Database (SINBAD). Five neutron sources were selected, which are generated from (1) 43- and 68-MeV proton-induced reaction on a thin lithium target, (2) 52-MeV proton-induced reaction on a thick graphite target, (3) 590-MeV proton-induced reaction on a thick lead target, (4) 500-MeV proton-induced reaction on a thick tungsten target, and (5) 800-MeV proton-induced reaction on a thick tantalum target. For all these cases, overall agreements between the experimental and calculated results were satisfactory to simulate neutron- and proton-induced reactions up to 200 MeV when using the Japanese evaluated nuclear data library JENDL-4.0/HE; however, using default settings in the code system made discrepancies between the results in neutron production and scatterings in shielding materials with energies lower than 100 MeV. The present study revealed that it is preferable to use JENDL-4.0/HE in the PHITS calculation.
1. Introduction
Radiation shielding design at accelerator facilities has been performed with Monte Carlo (MC) codes; therefore, a general-purpose MC particle and heavy-ion transport code system (PHITS) [Citation1] has been widely used. PHITS uses various nuclear reaction models and cross-section data libraries to simulate radiation transport for most species of particles in wide energy region (10−5 eV–1 TeV). The reliability of the PHITS simulations was validated by performing comprehensive benchmark calculations for PHITS (version 2.88) for 58 cases [Citation2] using nuclear reaction models. As default settings, JENDL-4.0 [Citation3] was used for neutron-induced reactions below 20 MeV, and the Liege intranuclear cascade model INCL-4.6 [Citation4] was used above 20 MeV. For neutron production and transport calculations, overall agreements were sufficiently satisfactory; however, there were discrepancies between experimental data and calculated results with INCL4.6 in the energy range below 100 MeV [Citation2]. On the other hand, JENDL-4.0/HE, which is the extended version of JENDL-4.0 up to 200 MeV for 130 nuclei, can reproduce experimental data for the neutron production in the energy range below 200 MeV [Citation5,Citation6]. Note that a comparative study between experimental data and simulation results using JENDL-4.0/HE is yet to be conducted for neutron-shielding designs at accelerator facilities.
To validate the accuracy of the calculations, it is conceivable to use the shielding integral benchmark archive and database (SINBAD) containing compilations for reactor, fusion, and accelerator-shielding experiments [Citation7–9]. SINBAD is the shielding experiment database jointly compiled by the Radiation Safety Information Computational Center [Citation8] and Nuclear Energy Agency (NEA) data bank [Citation9] and is maintained as a basis for MC code, physics model and nuclear data. Currently, SINBAD contains the experimental data for 46 fission reactor shielding, 31 fusion shielding, and 23 accelerator shielding experiments [Citation9]. It also contains information necessary for MC simulation such as computational models and shielding material composition corresponding to each experiment. Therefore, the usage of the SINBAD database is meaningful for benchmark calculations of neutron shielding with MC codes.
In this study, we conducted a benchmark study using the JENDL-4.0/HE and the recommended settings for shielding calculations using the recent PHITS version (version 3.24). We selected experimental data related to accelerator-shielding from SINBAD for proton beams with energies greater than 20 MeV.
This paper is organized as follows. Section 2 shows calculation conditions and geometry models of five accelerator-shielding experiments chosen, which are generated from (1) 43- and 68-MeV proton-induced reaction on a thin lithium target [Citation10,Citation11], (2) 52-MeV proton-induced reaction on a thick graphite target [Citation12,Citation13], (3) 590-MeV proton-induced reaction on a thick lead target [Citation14], (4) 500-MeV proton-induced reaction on a thick tungsten target [Citation15,Citation16], and (5) 800-MeV proton-induced reaction on a thick tantalum target [Citation17,Citation18]. Section 3 shows the benchmarking results and discussions for all cases, and the summary is presented in Section 4.
2. Calculation procedure
2.1. Overview of the physics models and the nuclear data library used in the benchmark study
For the PHITS default settings, INCL4.6 [Citation4] simulates nuclear reactions induced by nucleons in energy range of 20 MeV–3 GeV. The generalized evaporation and fission model (GEM) [Citation19] simulates a de-excitation process of a compound nucleus from a nuclear reaction. JENDL-4.0 [Citation3] with neutron-induced reactions in the A Compact Evaluated nuclear data file (ACE) format, similar to that adopted by the Monte Carlo N-Particle (MCNP) code [Citation20], was used in the energy region of 10−5 eV–20 MeV.
Alternatively, JENDL-4.0/HE can also be adopted for simulating neutron- and proton-induced reactions up to 200 MeV. Note that JENDL-4.0/HE and JENDL-4.0 contain the same in the cross-section data in the neutron energy range below 20 MeV. Here, the agreement between the measurements and calculated results within a factor of 2 is regarded as satisfactory [Citation2].
2.2. Calculation conditions
lists the SINBAD data set [Citation9] selected as the PHITS calculation. lists the atomic compositions and densities of the shielding blocks placed behind the target materials hit by protons. For all cases, except for the abstract number NEA-1552/15, neutron energy spectra behind the shielding material and reaction rates were measured in each sublayer of shielding materials. For the abstract number NEA-1552/15, the neutron energy spectrum was measured without the presence of shielding material. The experimental data are critical to validate the PHITS performance for simulating spallation-sourced neutrons produced by proton-induced reactions.
Table 1. SINBAD data set [Citation9] used as the benchmark calculation of PHITS
Table 2. Properties of shielding materials used in the simulations and shielding experiments
Two patterns for calculation conditions exist for the neutron shielding calculations. For pattern (A), denoted as JENDL-4.0/HE, the evaluated neutron and proton cross-sections in JENDL-4.0/HE up to 200 MeV were used for neutron production and transport calculations. In the energy region above 200 MeV, INCL4.6 was used for calculations. For pattern (B), denoted as the PHITS default setting, the INCL4.6 model in the energy region above 20 MeV and JENDL-4.0 below 20 MeV was used. For the SINBAD abstract numbers NEA-1552/03 and NEA-1552/34, the source neutron with energy distributions listed in the SINBAD data was also used as the neutron source in both (A) and (B) pattern calculations.
In the PHITS simulation for the SINBAD abstract numbers, NEA-1552/23 and NEA-1552/38, the calculations were divided in two steps to reduce the shielding computational time. First, neutrons with their energies, unit vectors of momentum, and positions were dumped at the collimator’s entrance using the t-cross tally feature of PHITS. Second, the dumped neutrons were used as a neutron transport calculation source in the concrete shield. The reason for using the two-step calculation in the two cases is that the shielding material had to be changed in a larger calculation geometry than in the other cases. In this study, the two-step calculation was not applied in the other cases because the computational time in the normal calculation was reasonable. Note that when the computer is performing poorly, the two-step calculation will be advantageous in all cases.
2.3. Shielding calculation geometry
This subsection describes the shielding calculation geometries for all cases listed in . All calculation geometries and sources were obtained from the input files of other MC codes, such as MCNP [Citation20] and MARS [Citation21] codes, implemented in the SINBAD database [Citation9], except for the detailed calculation geometry of NEA-1552/03 obtained from [Citation22]. MARS is a Monte Carlo code for simulation of three-dimensional hadronic and electromagnetic cascades including neutron transport in materials in the energy range up to 100 TeV. For the calculation with the detailed calculation geometry of NEA-1552/03, a proton beam was used as a source.
2.3.1. Neutron energy spectra behind iron and concrete shields using a quasimonoenergetic neutron source (NEA-1552/03)
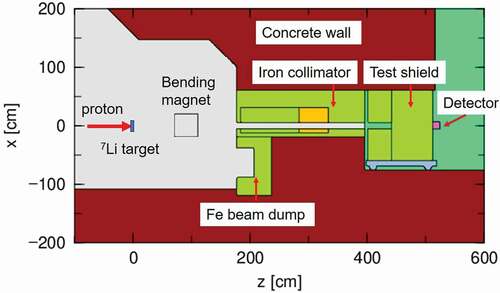
shows the simplified geometry of the PHITS simulation for the Takasaki Ion Accelerator for Advanced Radiation Application (TIARA) shielding experiment [Citation10,Citation11], which is listed in the report using MCNP simulation [Citation23]. Neutron spectra behind shielding materials were measured for 43- and 68-MeV p-7Li neutrons at the azimuthally varying field cyclotron facility at the TIARA facility [Citation10,Citation11]. Quasimonoenergetic neutrons at the forward angle were generated by 43- and 68-MeV proton induced reaction on 3.6-mm and 5.2-mm thick lithium targets, respectively. A 10–100-cm thick iron test shield was assembled [Citation11] with 120 × 120 × 10 cm3 rectangular iron slabs. Instead of an iron shield, a 25–200 cm thick concrete shield was also assembled [Citation10]. In this simplified geometry, the measured source neutrons provided in the SINBAD [Citation9] are emitted in a cone of 5.9 × 10⁻⁴ sr, 401 cm from the target position.
Figure 1. Shielding calculation geometry for the TIARA experiment with a 40-cm-thick iron [Citation10,Citation11]. The shielding material is either iron or concrete. The source is a quasimonoenergetic neutron with energy distributions provided in the SINBAD database [Citation9].
![Figure 1. Shielding calculation geometry for the TIARA experiment with a 40-cm-thick iron [Citation10,Citation11]. The shielding material is either iron or concrete. The source is a quasimonoenergetic neutron with energy distributions provided in the SINBAD database [Citation9].](/cms/asset/9692abeb-268f-417e-8900-ad459384acd0/tnst_a_1993372_f0001_oc.jpg)
The transmitted neutron spectra were also calculated behind the shielding materials with a proton beam using the detailed geometry [Citation22] (). In this calculation, source protons were bent to the beam dump, and neutrons produced by a lithium target moved through a collimator. Neutrons produced by the iron beam dump in have a negligible contribution to the detector. The p-7Li neutron production reaction was calculated using the lithium proton data library for JENDL-4.0/HE or the INCL4.6 model in the PHITS default settings.
Figure 2. Detailed calculation geometry for the TIARA experiment. The test shield is either iron or concrete.
2.3.2. Transmission through shielding materials of neutrons and photons generated via 52-MeV protons (NEA-1552/34)
Measuring the attenuation of secondary neutrons through graphite, water, iron, and concrete shields was performed using the frequency-modulated (FM)-cyclotron from the Institute of Nuclear Study (INS) at the University of Tokyo [Citation12,Citation13]. shows the geometry of the PHITS simulation for reproducing the experiments. The 52-MeV protons were stopped on a 2.14-cm-thick graphite target (1.70 g/cm3 density) in front of shielding blocks, whereas neutrons produced at the target transmitted throughout the shielding blocks. The measured neutron energy spectrum was obtained using the neutron spectrum unfolding method [Citation12,Citation13] with a liquid scintillator (NE213), which was at the other side of the shielding block.
Figure 3. Shielding calculation geometry for the INS experiment [Citation12,Citation13]. Source neutrons are generated by 52-MeV protons bombarding 2.14-cm-thick graphite targets. The tested shielding block materials are graphite, water, iron, and concrete.
![Figure 3. Shielding calculation geometry for the INS experiment [Citation12,Citation13]. Source neutrons are generated by 52-MeV protons bombarding 2.14-cm-thick graphite targets. The tested shielding block materials are graphite, water, iron, and concrete.](/cms/asset/493630f0-750c-4841-b7fe-fc71b801d974/tnst_a_1993372_f0003_oc.jpg)
2.3.3. High-energy neutron spectra generated by 590-MeV protons on a thick lead target (NEA-1552/15)
shows the PHITS geometry for calculating the neutron spectrum of the Swiss Institute for Nuclear Research (SIN) experiment [Citation14]. The neutron energy spectra generated by 590-MeV protons on a 60-cm-thick lead was measured with a time-of-flight (TOF) technique. No shields existed between the neutron production target and detector.
Figure 4. The geometry of the neutron spectrum calculation for the SIN experiment [Citation14]. Neutrons are generated by 590-MeV protons bombarding a thick lead target.
![Figure 4. The geometry of the neutron spectrum calculation for the SIN experiment [Citation14]. Neutrons are generated by 590-MeV protons bombarding a thick lead target.](/cms/asset/3e1d5be6-ac17-4b4c-9445-1e867d306206/tnst_a_1993372_f0004_oc.jpg)
2.3.4. High energy accelerator research organization (KEK) Neutron Science Laboratory (KENS) shielding experiment (NEA-1552/23)
shows the PHITS calculation geometry for calculating the neutron spectrum of the KENS shielding experiment [Citation15,Citation16]. High-energy neutrons generated by 500-MeV protons bombarding on a thick tungsten went to the neutron irradiation room. For every 40–80 cm thickness, seven slots in the concrete shield were installed on the beam axis. The slot eight is at the end of the concrete shield. For this experiment, activation detectors with indium, aluminum, and bismuth foils were put into slots in the concrete shield. The reaction rates of the activation foils were measured. In the PHITS simulation, the neutron reaction rate in each slot was obtained by the integral of the neutron spectrum and the activation cross-section.
Figure 5. Shielding calculation geometry for the KENS experiment [Citation15,Citation16]. Source neutrons are generated by 500-MeV protons bombarding a thick tungsten target. The shielding block is concrete.
![Figure 5. Shielding calculation geometry for the KENS experiment [Citation15,Citation16]. Source neutrons are generated by 500-MeV protons bombarding a thick tungsten target. The shielding block is concrete.](/cms/asset/af9647d2-402c-420a-a7ba-323955a714f3/tnst_a_1993372_f0005_oc.jpg)
2.3.5. Intense Spallation Neutron Source (ISIS) benchmark experiment of deep-penetrating neutrons through concrete and iron shields (NEA-1552/38)
shows the shielding calculation geometry for the ISIS experiment [Citation17,Citation18]. This experiment measured the deep-penetrating neutrons through thick shielding materials at an ISIS facility of the Rutherford Appleton Laboratory [Citation17,Citation18]. The source neutrons were generated by 800-MeV proton-induced reactions on a thick tantalum. The neutrons were transmitted through shields. The neutron fluence attenuation through shields was obtained from gamma-ray measurements using activation detectors with carbon foils. In this simulation, the two-stage calculation method was also applied, as in previous sections.
Figure 6. Shielding calculation geometry for the ISIS experiment [Citation17,Citation18]. Neutrons are generated by 800-MeV protons bombarding a thick tantalum target at 90° to the proton beam direction. Concrete, iron, and air were used as additional shields.
![Figure 6. Shielding calculation geometry for the ISIS experiment [Citation17,Citation18]. Neutrons are generated by 800-MeV protons bombarding a thick tantalum target at 90° to the proton beam direction. Concrete, iron, and air were used as additional shields.](/cms/asset/61d01e67-a9ce-47cb-ad5f-793c773d25a9/tnst_a_1993372_f0006_oc.jpg)
3. Results and discussions
3.1. Neutron energy spectra behind iron and concrete shields using a quasimonoenergetic neutron source (NEA-1552/03)
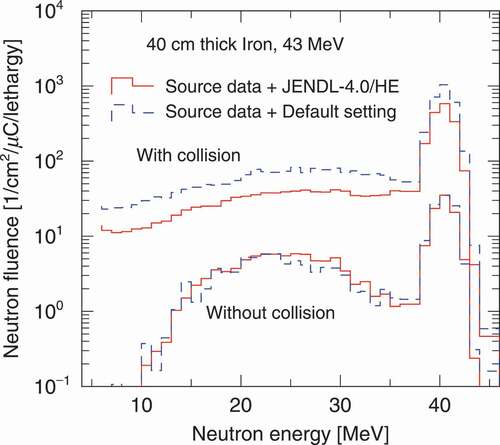
shows neutron energy spectra through shields with the experimental 43- and 68-MeV p-Li source neutron energy spectrum and the calculation geometry shown in . For all cases with an experimental neutron source and JENDL-4.0/HE agreed well with the experimental data at each depth, whereas those calculated using an experimental neutron source and PHITS default settings (source data + PHITS default settings) overestimated the data with increasing depth. To understand this difference, we separately calculated the spectra of neutrons with and without collisions during penetration through the shields using the [counter] section in PHITS. shows neutron energy spectra through a 40-cm-thick iron shield with and without collision with shielding materials using source data + JENDL-4.0/HE and source data + PHITS default settings, respectively. The energy spectrum of neutrons without collisions calculated using JENDL-4.0/HE is similar to that calculated using PHITS default settings. However, the spectrum of neutrons with collisions using the PHITS default settings is larger than that of JENDL-4.0/HE by approximately a factor of 2. This trend indicates that INCL4.6 cannot precisely simulate the secondary neutron scattering in shielding materials compared with JENDL-4.0/HE, although the total cross-section in the PHITS default setting is the same as that of JENDL-4.0/HE. This trend was also found in all cases of iron and concrete shields.
Figure 7. Neutron energy spectra through shields with the experimental 43- and 68-MeV p-Li source neutron energy spectrum and the calculation geometry (). Solid and dashed lines show the results of source data + JENDL-4.0/HE and source data + PHITS default settings, respectively.
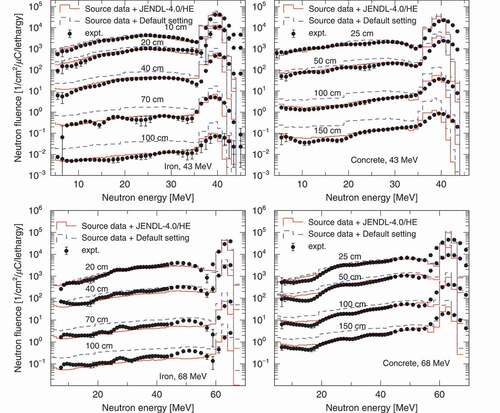
Figure 8. Neutron energy spectra through a 40-cm-thick iron shield for colliding and penetrating neutrons using a 43-MeV monoenergetic neutron source ().
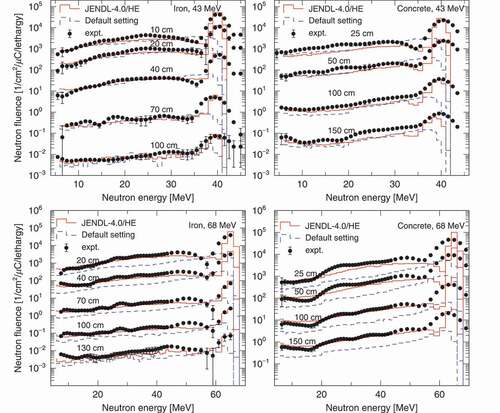
shows neutron energy spectra behind the shielding materials with the detailed geometry and proton beam (). Two calculation patterns (JENDL-4.0/HE and PHITS default settings) were selected. From these figures, INCL4.6 in PHITS default settings could not reproduce the neutron peak corresponding to the discrete levels of the excited nucleus produced by the p-7Li nuclear reaction [Citation2]. Because the proton data library of lithium in JENDL-4.0/HE can simulate this reaction, the neutron energy spectra in shields at each depth agree well with the experimental data. The results of PHITS default settings for 43-MeV protons agree with the experimental data in the neutron energy range below 35 MeV because of the compensation between the underestimation of the peak neutron spectrum [Citation2] and the overestimation of the neutron spectrum in shielding materials (). Therefore, the proton data library of JENDL-4.0/HE is necessary to reproduce source neutrons for the p-Li reaction.
Figure 9. Neutron energy spectra through shields for the 43- and 68-MeV proton-induced reaction on Li with the proton beam and the detailed geometry (). The solid and dashed lines show the results of JENDL-4.0/HE and PHITS default settings, respectively.
3.2. Transmission through shielding materials of neutrons and photons generated via 52-MeV protons (NEA-1552/34)
shows the neutron energy spectra produced by 52-MeV proton bombarding on a thick graphite at different detector locations using a simplified geometry model, consisting of only target material and detectors. Overall, results calculated using JENDL-4.0/HE agree with the experimental data, except for that in the energy range above 25 MeV at 0°. Neutrons with energies around 32 MeV are produced via the resonance of the 12C(p, n)12N reaction, which is considered in JENDL-4.0/HE [Citation24] and is not explicitly considered in INCL4.6. Although results calculated using PHITS default settings agree with the experimental data above 25 MeV at 0°, we assumed that calculations performed using JENDL-4.0/HE are better than those performed using INCL4.6 in the 12C(p, n)12N reaction.
Figure 10. Neutron yield spectra produced by a 52-MeV proton incidence on a thick graphite target (). The solid lines show the calculation results using JENDL-4.0/HE, the dashed lines show the calculation results using PHITS default settings, and the solid circles represent the experimental data. No information exists regarding the experimental data error in the paper [Citation12,Citation13].
![Figure 10. Neutron yield spectra produced by a 52-MeV proton incidence on a thick graphite target (Figure 3). The solid lines show the calculation results using JENDL-4.0/HE, the dashed lines show the calculation results using PHITS default settings, and the solid circles represent the experimental data. No information exists regarding the experimental data error in the paper [Citation12,Citation13].](/cms/asset/035481a1-9ae0-4c4a-8bf4-73b97f042d2a/tnst_a_1993372_f0010_oc.jpg)
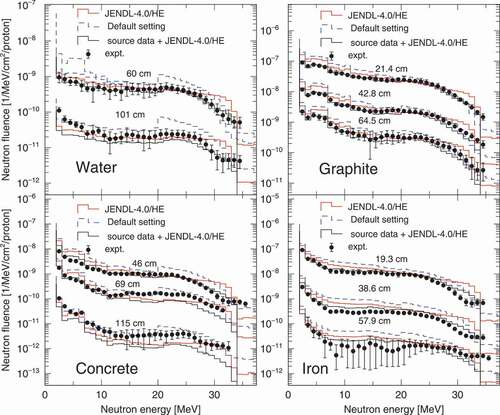
shows neutron energy spectra through water (top left), graphite (top right), concrete (bottom left), and iron (bottom right) shields with neutrons produced via the 52-MeV proton-induced reaction on a thick graphite target. The results calculated with source data + JENDL-4.0/HE agree well with the experimental data. This trend is also observed for neutron spectra through shielding materials using the experimental p-Li source neutron spectrum () and JENDL-4.0/HE (). The fluence profiles obtained using PHITS default settings for iron and concrete shields have a distinct turning point at 20 MeV, where JENDL-4.0 is used below and INCL4.6 is used above it. This turning point is less obvious for water and graphite shields when using PHITS default settings.
Figure 11. A comparison of the measured and calculated neutron energy spectra behind the water (top left), graphite (top right), concrete (bottom left), and iron (bottom right) shields with a 52-MeV proton beam hitting a thick graphite target (). The solid red and dashed lines show the calculation results of JENDL-4.0/HE and PHITS default settings, respectively. The solid black line shows the calculation results of the source data.
3.3. High-energy neutron spectra generated via 590-MeV protons on a thick lead target (NEA-1552/15)
shows the calculated results of the neutron energy spectrum and experimental data [Citation14]. The solid angle of the detector, 1.186 × 10⁻³ sr, and the average target area (12.5 cm2) normalized the neutron energy spectrum’s unit. A negligible difference exists between the calculation results obtained using JENDL-4.0/HE and PHITS default settings because the INCL4.6 model was used for the 590-MeV proton-induced nuclear reaction on a thick lead for using JENDL-4.0/HE and PHITS default settings. The results calculated by JENDL-4.0/HE and PHITS default settings agree well with the data in the energy range between 10 and 200 MeV. However, calculated results are higher than the data below 10 MeV because the number of evaporating neutrons generated from the GEM model increases due to the high excitation energy of the residuals from the INCL4.6 model [Citation25]. Improving the physics model in PHITS will be necessary for the proton-lead nuclear reaction in the high-energy region.
Figure 12. Calculation results obtained using PHITS with JENDL-4.0/HE, the PHITS default setting, and experimental data [Citation14] for a 590-MeV proton incidence on a thick lead target at 90° ().
![Figure 12. Calculation results obtained using PHITS with JENDL-4.0/HE, the PHITS default setting, and experimental data [Citation14] for a 590-MeV proton incidence on a thick lead target at 90° (Figure 4).](/cms/asset/4b8996c8-f3fe-404d-822c-84afc7a44d0f/tnst_a_1993372_f0012_oc.jpg)
3.4. KENS shielding experiment (NEA-1552/23)
In the experiment, gamma-ray measurements using the activation detectors obtained reaction rates. In the PHITS simulation, the integral of the neutron spectrum and the activation cross-section obtained reaction rates at each slot. shows neutron spectra calculated by PHITS in the concrete shield at each depth with the neutron data libraries for JENDL-4.0/HE and PHITS default settings. The calculated results are similar. The neutron energy spectrum was multiplied with activation cross-sections of 209Bi(n, xn)210-xBi(x = 4–8), 115In(n, n’)115 mIn, and 27Al(n, α)24Na (), to calculate the reaction rate (). All data were obtained from the International Reactor Dosimetry and Fusion File (IRDFF-II) via the website of the Evaluated Nuclear Data File database [Citation26,Citation27], except for 209Bi(n, xn)210-xBi (x = 7 and 8) that was taken from KEK Report 2001–24 (Feb. 2002) [Citation17].
Figure 13. Calculated neutron energy spectra in the concrete shield at each depth for the KENS experiment ().
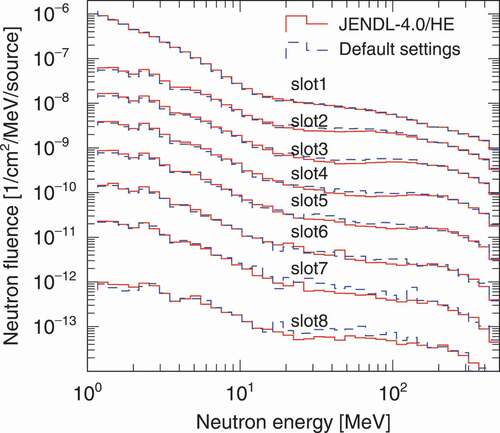
Figure 14. Activation cross-sections of 209Bi(n, xn)210-xBi (x = 4–6), 115In(n, n’)115 mIn, and 27Al(n, α)24Na taken from IRDFF-II [Citation26,Citation27]. Activation cross-sections for 209Bi(n, xn)210-xBi (x = 7 and 8) were taken from the KEK Report 2001–24 [Citation17].
![Figure 14. Activation cross-sections of 209Bi(n, xn)210-xBi (x = 4–6), 115In(n, n’)115 mIn, and 27Al(n, α)24Na taken from IRDFF-II [Citation26,Citation27]. Activation cross-sections for 209Bi(n, xn)210-xBi (x = 7 and 8) were taken from the KEK Report 2001–24 [Citation17].](/cms/asset/2e0939b6-8bf0-47d2-86bf-d5905393a3a1/tnst_a_1993372_f0014_oc.jpg)
Figure 15. Reaction rate at each depth in concrete shields of the KENS experiment (). The solid and dashed lines show the calculation results of JENDL-4.0/HE and PHITS default settings, respectively.
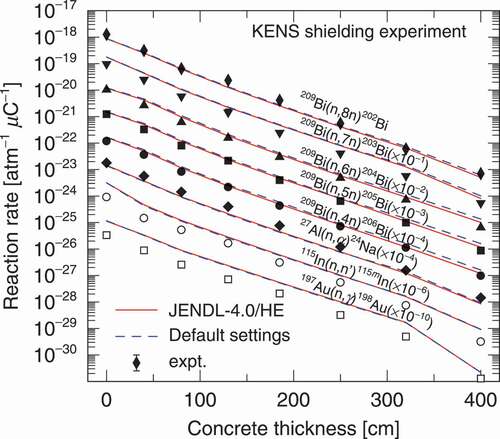
shows the reaction rate distribution in a concrete shield at each depth. The results calculated using JENDL-4.0/HE and PHITS default settings correlate well with the experimental data for 209Bi(n, xn)210-xBi (x = 4–6) and 27Al(n, α)24Na, covering neutron spectra with an energy region above 10 MeV. However, the calculated results are larger than the experimental results by a factor of around two for 115In(n, n’)115 mIn, covering the neutron energy region below 10 MeV. This result is attributed to neutrons produced via evaporation ().
3.5. ISIS benchmark experiment of deep-penetrating neutrons through concrete and iron shields (NEA-1552/38)
Experimental neutron reaction rates were obtained by gamma-ray measurements using the activation detectors, and neutron reaction rates calculated by PHITS were obtained by the integral of the neutron spectrum and the activation cross-section. shows the neutron spectrum with the JENDL-4.0/HE at the entrance of additional shields and the activation cross-section of 12C (n, 2 n) taken from the KEK Report 2001–24 (Feb. 2002) [Citation17]. The neutron energy spectrum was tallied at each slot in additional shields and multiplied with the activation cross-section of 12C (n, 2 n).
Figure 16. Neutron energy spectrum with the JENDL-4.0/HE at the entrance of additional shields (left) and activation cross-sections of the 12C(n, 2 n)11C reaction taken from the KEK Report 2001–24 [Citation17] (right).
![Figure 16. Neutron energy spectrum with the JENDL-4.0/HE at the entrance of additional shields (left) and activation cross-sections of the 12C(n, 2 n)11C reaction taken from the KEK Report 2001–24 [Citation17] (right).](/cms/asset/1c5780a8-7757-4cf3-bfd7-819d9dc78da8/tnst_a_1993372_f0016_b.gif)
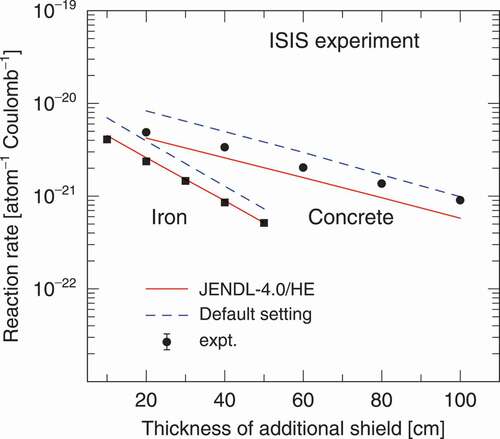
shows the 12C(n, 2 n) reaction rate in additional shields of iron and concrete behind thick bulk shields (). The results calculated using JENDL-4.0/HE are smaller than those calculated using PHITS default settings. This trend is observed because of the difference in the scattering effects of neutrons in shielding materials between both cases () for the TIARA experiment. Comparing the iron shield’s reaction rates between the calculated results and experimental data show that the calculated results using JENDL-4.0/HE agree well with the experimental data. For concrete, both results of JENDL-4.0/HE and PHITS default settings agree with the experimental data within a factor of 2.
Figure 17. Reaction rates at each depth in additional shields of iron and concrete behind thick bulk shields (). The solid and dashed lines show calculation results using JENDL-4.0/HE and PHITS default settings, respectively.
4. Summary
A benchmark study of various neutron-shielding experiments provided in SINBAD was conducted using the recent PHITS version (version 3.24) with neutrons produced by (1) a 43- and 68-MeV proton-induced reaction on a lithium target, (2) 52-MeV proton-induced reaction on a thick graphite target, (3) 590-MeV proton-induced reaction on a thick lead target, (4) 500-MeV proton-induced reaction on a thick tungsten target, and (5) 800-MeV proton-induced reaction on a thick tantalum target. A combination of the physics model INCL4.6/GEM (>20 MeV) and JENDL-4.0 (<20 MeV) was used as the PHITS default settings in the calculations. The evaluated nuclear data library JENDL-4.0/HE with energies below 200 MeV was incorporated as a benchmark study.
For case (1), the calculated neutron energy spectra using JENDL-4.0/HE reproduced the experimental data at various depths in shielding materials. However, PHITS default settings failed to reproduce the energy spectra with increasing depth because of overestimating the multiple collisions in shielding materials. It also failed to reproduce the peak energy spectrum because of the lack of the model for the discrete levels of the excitation nucleus in the proton-lithium nuclear reaction. For case (2), the calculated neutron energy spectra using JENDL-4.0/HE overall reproduced the experimental data well, compared to the results obtained using PHITS default settings. For case (3), the results calculated using JENDL-4.0/HE and PHITS default settings were similar because the INCL4.6 model was used for both calculations above 200 MeV. Both calculated results agreed well with the neutron energy region data above 10 MeV and were smaller than the data below 10 MeV because of the high excited energy of the residuals produced by INCL4.6. For case (4), the reaction rates at various depths in the concrete shield calculated using JENDL-4.0/HE and PHITS default settings correlated well with the experimental data for 209Bi(n, xn)210-xBi (x = 4–8) and 27Al(n, α)24Na, covering the neutron energy spectra with an energy region above 10 MeV. In case (5), the neutron reaction rate of 12C(n, 2 n)13C in iron and concrete calculated using JENDL-4.0/HE and PHITS default settings also agreed well with the data within a factor of 2.
Overall, agreements were sufficiently satisfied with the Japanese evaluated nuclear data library JENDL-4.0/HE. However, several discrepancies were observed with PHITS default settings, particularly in neutron production and multiple scatterings in shielding materials with energies below 100 MeV. To produce an accurate neutron-shielding design for accelerator facilities, incorporating JENDL-4.0/HE in the PHITS calculation is favorable.
Acknowledgments
We wish to thank Dr Hiroki Iwamoto, Dr Daiki Satoh, Dr Fujio Maekawa, and Dr Chikara Konno of JAEA for their valuable comments on shielding calculations and nuclear data libraries.
Disclosure statement
No potential conflict of interest was reported by the author(s).
References
- Sato T, Iwamoto Y, Hashimoto S, et al. Features of Particle and Heavy Ion Transport Code System (PHITS) version 3.02. J Nucl Sci Technol. 2018;55(6):684–690.
- Iwamoto Y, Sato T, Hashimoto S, et al. Benchmark study of the recent version of the PHITS code. J Nucl Sci Technol. 2017;54(5):617–635.
- Shibata K, Iwamoto O, Nakagawa T, et al. JENDL-4.0: a new library for nuclear science and engineering. J Nucl Sci Technol. 2011;48:1–30.
- Boudard A, Cugnon J, David J, et al. New potentialities of the Liege intranuclear cascade model for reactions induced by nucleons and light charged particles. Phys Rev C. 2013 Jan;87:014606.
- Kunieda S, Iwamoto O, Iwamoto N, et al. Overview of JENDL-4.0/HE and benchmark calculation. JAEA-Conf. 2016;4:41–46.
- Matsuda N, Kunieda S, Okamoto T, et al. ACE library of JENDL-4.0/HE. Prog Nucl Sci Technol. 2019;6:225–229. [ cited 2021 May 26]. Available from: https://rpg.jaea.go.jp/main/en/ACE-J40HE/
- Kodeli I, Sartori E, Kirk B SINBAD - Shielding Benchmark Experiments - status and planned activities. In: Proceedings of the ANS 14th Biennial Topical Meeting of Radiation Protection and Shielding Division; 2006 April 3–6; Carlsbad, New Mexico. [ cited 2021 May 13]. Available from: https://www.oecd-nea.org/science/wprs/shielding/sinbad/RPSD2006-sinbad.pdf
- RSICC website. Oak Ridge, TN, USA: ORNL. cited 2021 May 13. Available from: https://www.ornl.gov/onramp/rsicc
- SINBAD website. Boulogne-Billancourt. France: OECD/NEA. [ cited 2021 May 13]. Available from: https://www.oecd-nea.org/jcms/pl_32139/shielding-integral-benchmark-archive-and-database-sinbad
- Nakao N, Nakashima H, Nakamura T, et al. Transmission through shields of quasi-monoenergetic neutrons generated by 43- and 68-MeV protons. Part-I: concrete shielding experiment and calculation for practical application. Nucl Sci Eng. 1996;124:228–242.
- Nakashima H, Nakao N, Tanaka S, et al. Transmission through shields of quasi-monoenergetic neutrons generated by 43- and 68-MeV protons. Part-II: iron shielding experiment and analysis for investigating calculation methods and cross section data. Nucl Sci Eng. 1996;124:243–257.
- Shin K, Uwamino Y, Yoshida M, et al. Penetration of secondary neutrons and photons from a graphite assembly exposed to 52-MeV protons. Nucl Sci Eng. 1979;71:294–300.
- Uwamino Y, Nakamura T, Shin K. Penetration through shielding materials of secondary neutrons and photons generated by 52-MeV protons. Nucl Sci Eng. 1982;80:360–369.
- Cierjacks S, Raupp F, Howe SD, et al. High energy particle spectra from spallation targets. Proceedings of the 5th Meeting of the International Collaboration on Advanced Neutron Sources, Jülich, June 22-26, 1981.
- Nakao N, Yashima H, Kawai M, et al. KENS shielding experiment (1) - measurement of neutron attenuation through 4 m concrete shield using a high energy neutron irradiation room. J Nucl Sci Technol Suppl. 2004;4:22–25.
- Oishi K, Nakao N, Kosako K, et al. Measurement and analysis of induced activities in concrete irradiated using high-energy neutrons at kens neutron spallation source facility. Radiat Prot Dosim. 2005;115:623–629.
- Nunomiya T, Nakao N, Wright P, et al. Experimental data of deep-penetration neutrons through a concrete and iron shield at the ISIS spallation neutron source facility using an 800-MeV proton beam. KEK Report. 2002. p. 2001–2024.
- Nunomiya T, Nakao N, Wright P, et al. Measurement of deep penetration of neutrons produced by 800-MeV proton beam through concrete and iron at ISIS. Nucl Instr Meth B. 2001;179:89–102.
- Furihata S. Statistical analysis of light fragment production from medium energy proton-induced reactions. Nucl Instrum Meth B. 2000;171:251–258.
- X-5 Monte Carlo Team. MCNP - a general N-particle transport code, version 5, volume I: overview and theory, LA-UR-03-1987. USA: Los Alamos National Laboratory; 2003.
- Mokhov NV, James CC The Mars code system user’s guide, version 15 (2016), Fermilab-FN-1058-APC. 2017.
- Kos B, Kodeli IA. MCNP modelling of the TIARA SINBAD shielding benchmark, INDC(NDS)-0785. Austria: IAEA; 2019.
- Hertel NE, Evans TM. Benchmarking the LAHET Elastic Scattering Model for APT Design Applications. ERDA Final Report, Prepared for the Westinghouse Savannah River Company under ERDA Task Order 96-081, JEFDOC-715. 1997.
- Satoh D, Iwamoto Y, Ogawa T. Measurement of neutron-production double-differential cross sections of natC, 27Al, natFe, and natPb by 20, 34, 48, 63, and 78 MeV protons in the most-forward direction. Nucl Instr Meth A. 2019;920:22–36.
- Iwamoto H, Meigo S. Unified description of the fission probability for highly excited nuclei. J Nucl Sci Technol. 2019;56:160–171.
- Trkov A, Griffin PJ, Simakov SP, et al. IRDFF-II: a new neutron metrology library. Special Issue Nucl Data Sheets. 2020;163:1–108.
- [ cited 2021 May 26]. Available from: https://www-nds.iaea.org/exfor/endf.htm