
ABSTRACT
Geopolymers are a class of material that could potentially be used for sealing and repair of damaged concrete structures. This application is important for both decommissioning activities and standard industrial applications. The purpose of this article is to investigate the interface between ordinary Portland cement and geopolymer. The surface microstructure of the cement is investigated by SEM, EDX, and micro-Raman after embedding in geopolymer or immersion in the activation solution of a geopolymer for various durations. It is found that immersion in the solution induces a dendritic carbonation profile into the cement structure following the CSH gel. On the contrary, embedding in the geopolymer creates a dense, impermeable interface with a thickness of a few micrometers. This interface is found to be dense and brittle and it decreases the permeability of the surface, preventing the penetration of silicates into the cement structure. However, this brittle interface is sensitive to dehydration and can rupture under intense drying. This phenomenon can be utilized to separate the geopolymer and cement but is concerning if the integrity of the material must be guaranteed under extreme conditions.
Graphical abstract
1. Introduction
Since 2011, water is injected in the cores of the reactors of Fukushima Daiichi nuclear power plan as a coolant to avoid a potential re-melting of the fuel remnants and debris. This water is contaminated by contact with the debris [Citation1] and flows through pipes, the suppression chambers, and damages in the structure of reactor and reaches other parts of the facilities and the groundwater. This water is then pumped into the corresponding turbine building and underground, decontaminated and partially reused as a coolant. Efforts have been made to isolate the groundwater under the reactors from the environment and limit the additional water coming from rain and underground flows naturally running from the mountain side to the ocean. As of 2021, impermeable walls, ice walls, ground surface paving, ground water by-pass, and subdrains are isolating the reactors and reduce the excess amount of contaminated water generated [Citation2].
However, the flow of water from the primary containment vessel (PCV) to the rest of the facility and the isolated groundwater remains. This flow would be an issue during the fuel debris removal and PCV dismantling. When cutting the debris and PCV structure, dust will be generated, eventually captured by water spray and/or aerosols. In these conditions, airborne contamination would be contained, but a water flow would spread high levels of contamination to the rest of the structure and the ground around the reactors. To prevent this typeof contamination flow, several approaches have been proposed such as the sealing of the bottom of the suppression chamber and/or the pipes connecting the PCV to the suppression chamber [Citation3].
The material used to perform this sealing remains a question with very little information. Also, the possibility of sealing other possible leakages such as the damages of the reactor concrete structure, pedestal and the sand cushion supporting the PCV are still open to discussion.
Geopolymers have been used or studied for related applications such as the coating of cement to enhance properties [Citation4–6], repair of cracks in concrete [Citation7] or the recycling of concrete as aggregates [Citation8,Citation9]. Geopolymers are an inorganic framework of silicates and aluminates. Compared to standard cement and other hydraulic binders, they have interesting properties such as acid resistance and the possibility to be partially dehydrated. For the containment of radionuclides, they also have good cesium immobilization properties due to their structure [Citation10]. For an application such as the sealing of damaged concrete structures, an interface between cement and geopolymer is created and will define some of the performance of the material. Some technical studies already showed the interesting properties of the interface between cement and geopolymer with high strength and low permeability. These two factors would be advantageous in the eventuality of the usage of geopolymer as a sealant during decommissioning operations. However, the performance measurement without characterization and knowledge of the physicochemical properties of the interface are not acceptable in an application such as decommissioning where failures or surprises are not an option.
Geopolymers are formed by the dissolution of metakaolin in an alkaline silicate solution and condensation of aluminate and silicate species. If this process occurs in contact with cement, both of the alkaline solution and silicate and aluminates are susceptible to react and modify the structure of the cement at the interface. On the one hand, surface reactions can increase the bonding strength between the geopolymer and the cementitious substrate. On the other hand, alkali-silicate reactions are known to be expansive and could decrease the permeability or damage the structure of the substrate cement [Citation11].
The present study proposes the investigation of the chemical modification at the cement–geopolymer interface when geopolymer is formed on cement. To achieve this goal, a local characterization is necessary. Moreover, the structure of the cement already contains the elements composing the geopolymer and is microscopically inhomogeneous. Scanning electron microscopy–energy–dispersive X-ray spectroscopy (SEM–EDX) and micro-Raman are an effective combination to overcome the challenge of characterizing this interface. Raman spectroscopy was successfully used several times in the literature to characterize individual phases found in cement and its alteration products [Citation11–21]. It is nowadays possible to characterize the complex multi-component structure of cement concrete using Raman spectroscopy.
Elemental analysis by SEM–EDX allows the measurement of the thickness of the interfacial transition zone between geopolymer and cement. Also, it allows one to estimate the extent of the exchange of material between the two binders.
The approach of this investigation is intended to separate the effects on the interface of the alkaline attack of the activating solution and of the formation of the geopolymer. A geopolymer paste is an activating solution in which an aluminosilicate undergoes dissolution to provide aluminates and silicates that will be used to build the new geopolymer network. During the geopolymerization reaction, the alkaline solution may also react with the surface of the cement. The time during which this reaction may take place depends on the reactivity of the aluminosilicate. Other materials, such as activated slags, use the same type of alkaline solution and it is interesting to know if the properties achieved at the interface with concrete are specific to geopolymers. To this end, cement was either dipped in alkaline silicate solution for various durations or embedded in geopolymer before the characterization of the surface or interface by micro-Raman and SEM–EDX.
2. Materials & methods
2.1. Materials
Cement samples were prepared using standard Portland cement provided by the Japan Cement Association with a water to cement ratio of 0.4. For the synthesis of geopolymer and the activation solutions, sodium hydroxide (>97%) was obtained from Wako Pure Chemical Industries, Ltd (Japan). Metakaolin was purchased under the brand name Argical M1000 from Imerys (France). The composition of the cement and metakaolin measured by X-ray fluorescence (XRF) are presented in . For the silica source, waterglass (sodium silicate solution (No. 1)) was obtained from Kishida Chemical Co. Ltd. (Japan).
Table 1. Composition of cement and metakaolin used in this study
The geopolymer formulation used was the same as in the previous studies [Citation22,Citation23] and similar to the ones used for nuclear waste immobilization: 1 Al2O3 3.8 SiO2 1 Na2O 13 H2O. Considering the metakaolin, the activating solution (AS) had the following composition: 1.67 SiO2 1 Na2O 13 H2O. This composition was obtained by dilution of the waterglass and addition of the appropriate amount of sodium hydroxide. The AS was then stirred for 24 hours in a closed container with a magnetic stirrer before being used to dip cement samples or make geopolymer.
2.2. Sample preparation
After mixing the cement paste, the samples were molded in plastic cylinders with a diameter of 20 mm and placed in a sealed bag with a humid sponge to prevent early drying. The samples were left to cure at ambient temperature under high humidity for 50 days.
A fraction of the cylinders’ surface was removed using sand paper to avoid specific surface properties coming from the mold contact. Three samples were dipped into the activating solution of a geopolymer for 2, 4, or 24 hours. These samples were subsequently rinsed with pure water 3 times. One sample was embedded in the paste of geopolymer. As controls, one cement sample was dipped in pure water for 24 h and one left untouched. All cement samples were dipped or embedded at ambient temperature sealed in bags to avoid water evaporation. Dipping and embedding were carried out in a plastic cylinder with a diameter of 26 mm and with a liquid to solid ratio of 1. Thus, a layer of about 3 mm of geopolymer was formed around the cement sample embedded. A list of samples is compiled in .
Table 2. Sample list for micro-Raman spectroscopy and SEM–EDX characterizations
Seven days later, for each type of samples two disks with a thickness of 5 mm were cut. In prevision of the SEM measurement, one disk of each sample was dried in a weak vacuum for a day. Others were sealed in plastic bags once again to prevent drying before Raman measurements. Sample characterization by both Raman and SEM was carried out with 75-day-old samples, 25 days after the immersion either in water or in activating solution or embedding in geopolymer.
2.3. Sample characterizations
Raman investigation was performed on a DXR2xi Raman imaging microscope using a 10x objective and a 25 μm Raman beam entrance slit. The mappings were performed using a 532-nm laser with a power of 5.5 mW for 200 scans of 10 ms. The pixel size was set at 5 × 5 μm for all samples. The depth investigated in the sample varied from 400 to 800 μm. SEM observation and EDX measurements were done using a JEOL JSM-7610 F in high vacuum mode at 15.0 kV and a working distance of 10.0 mm.
3. Results
3.1. X-ray diffraction (XRD)
Standard cement was characterized as received and 28 days after hydration by XRD (). Before hydration, the cement is composed mainly of alite (C3S) and belite (C2S). Gypsum and calcium aluminoferrite (C4AF) are also present in small quantities.
Figure 1. X-ray diffractogram of ordinary Portland clinker and of the cement after 28 days of hydration.
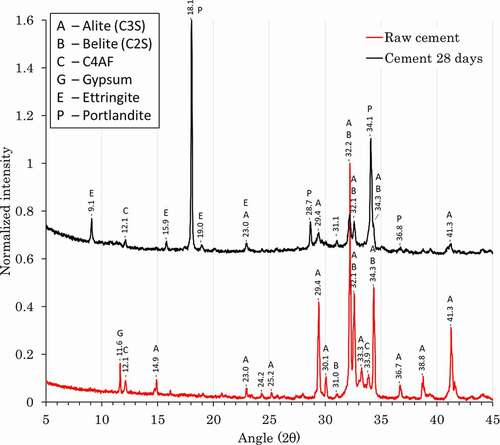
After hydration, the main phases visible by XRD are portlandite and ettringite. Also, small quantities of unreacted C4AF, belite, and alite can be observed. This is expected with a short hydration time due to the lower reactivity of belite and C4AF.
3.2. Raman spectroscopy
When using Raman spectroscopy, all samples were characterized close to the polished surface in contact with air, the activating solution, and/or the geopolymer 75 days after the cement preparation (). Two types of spectra are presented. Spectra labeled ‘Average’ were obtained by averaging the spectra of all the surface of the measured region corresponding to either the cement or the geopolymer. When some points in the investigated region presented different features compared to the average spectra, the spectra corresponding to these zones were also collected and labeled either by the main phase identified or by ‘Point spectra’ when several phases could be identified. is used for the identification of the phases visible on Raman spectra.
Table 3. Wavenumber of the Raman bands and assignment
Figure 2. Raman spectra in the range 100–1500 cm−1 of samples cem_standard (a), cem_24 h_H2O (b), cem_24 h_SA (c and d), and cem_geopolymer (e and f).
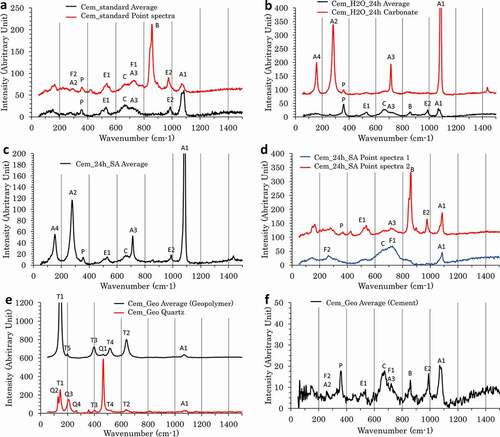
The average Raman spectra over the first few hundred micrometers from the surface of Cem-standard were first measured as a reference ()). This average spectrum shows bands that can be attributed to calcium carbonate, portlandite, and calcium silicate hydrate (CSH). Also, products usually called AFm and AFt, respectively, for Al2O3–Fe2O3-mono and -tri phases are among the standard hydration products of ordinary Portland cement binders. Bands attributable to either ettringite (an AFt) or AFm are also visible but no difference between the compounds allows one to clearly distinguish between them.
A contribution of C4AF as observed by XRD is not impossible on this average spectrum, but the main band at 736 cm−1 is too close to the calcium carbonate bending band at 714 cm−1 to be clearly identified.
However, this average spectrum correlates correctly only with a fraction of the observed surface and some zones show spectra with different features. As expected from the XRD result, although the samples were younger, remains of belite (C2S) were found in the sample. In the zones where unreacted belite is present a sharp band around 855 cm−1 is visible. This contribution is being localized; this band is visible only when focusing on the belite grains. Close to these grains, the contribution of C4AF is more visible as the one of carbonates is smaller.
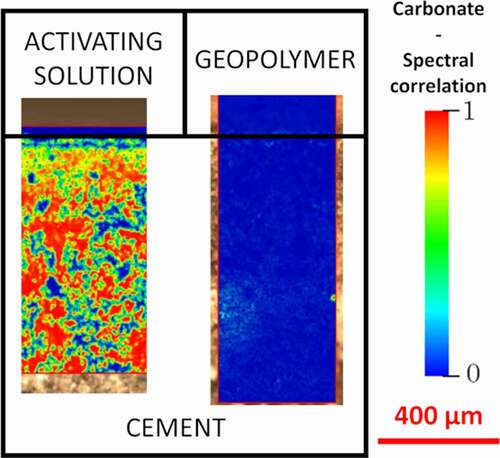
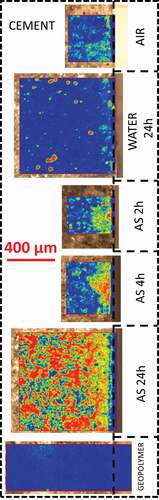
The Cem_24 h_H2O, used as a positive control in this study, shows the same features as those of the Cem_standard sample on most of the surface characterized ()). The average spectra show ettringite/AFm, CSH, and calcium carbonate. However, the Raman spectra of some disks of the sample are dominated by calcium carbonate. The strong intensity of the carbonate signal allows one to identify the polymorph present as calcite, with a characteristic lattice band at 280 cm−1 that is usually weak for aragonite and absent for vaterite [Citation24]. The localized carbonation phenomenon is clearly visible in a correlation mapping using the carbonate spectrum as a reference (). The correlation mapping shows the 2D distribution of the correlation coefficient between the carbonate spectrum and the spectrum measured at each specific coordinate of the sample. It is equal to 1 (red) when the point spectrum is identical to the spectrum of the carbonate and equal to 0 (blue) when the two spectra show no identical features.
Figure 3. Correlation coefficient mapping using the carbonate spectra as reference for all samples. From no correlation (blue) to perfect correlation (red). The same scale is used for all samples.
After the longest contact with the activating solution, on the sample Cem-AS-24 h, three different spectra can be observed. The average spectra ()), covering most of the studied area, are dominated with calcium carbonate (). Alongside carbonates, the spectrum shows small contribution of portlandite, ettringite/AFm, and CSH. The parts of the sample that do not correlate with the carbonate spectrum show either belite, like in the reference samples, or C4AF hydration products such as hydrogarnet and an ill-defined oxide hydroxide phase withbands, respectively, visible around 530 and 650 cm−1 ()). These attributions are also supported by the shift of the ν2 (Al,Fe)-O band from 258 to 264 cm−1.
Samples immersed for shorter periods of time in the activating solution show similar spectral features to the Cem-AS-24 h close to surface and closer to the Cem_standard further in the sample. Calcium carbonate-dominated zones follow a root-like pattern starting from the surface more important for longer immersion times in the activating solution ()). Although the spectra are similar, this pattern is different from the calcium carbonate observed after immersion in water.
The geopolymer Raman signatureis dominated by anatase [Citation25], present as an impurity in the metakaolin used for its synthesis ()). A contribution from carbonates is also visible around 1080 cm−1. Some particles of quartz impurities, coming from the metakaolin, are also present in the zone scanned with a characteristic vibration around 465 cm−1. Finally, we could expect to observe shallow contribution of the Si–O–Si, bendings between 400 and 720 cm−1, and stretchings between 850 and 1100 cm−1. The first range is partially covered by the anatase signal and the second one by carbonate. The contribution is visible but extremely weak and an evaluation of the degree of polymerization would be hazardous.
The cement in contact with geopolymer shows similar features to those of the reference cement. The same phases were identified. Interestingly, the only observable difference is that carbonates are less predominant than in all other cement samples. Efforts were made to identify specific phases at or close to the interface between the cement and geopolymer, but only convolution of the cement and anatase could be obtained.
3.3. Scanning electron microscopy/energy-dispersive X-ray spectroscopy (SEM–EDX)
The interface between geopolymer and cement was characterized further by SEM–EDX to obtain information about its thickness and composition ().
Figure 4. Top: SEM observation and EDX overlay of the geopolymer and cement interface. Down: Evolution of the elemental composition along the axis highlighted in the mapping. Left: large view of the cracked interface. Right zoom on a crack-less part of the interface.
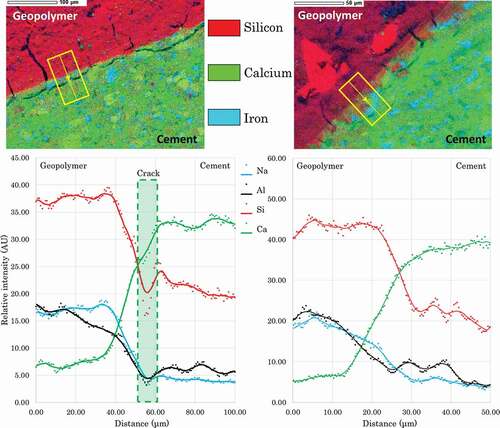
With desiccation, microcracks appeared in the sample. These cracks mainly follow the interface on the cement side a few micrometers after the apparent interface between the two matrices in the calcium rich zone.
The repartition of Ca, Si, Na, and Al was measured twice along an axis perpendicular to the interface between the two matrices: once in a region where the crack was parallel to the interface ( left) and once in a small region without crack ( right). In both cases, the transition between the composition of the geopolymer and the cement is continuous and spans over about 30 μm. However, all element transition spans are not identical. From the composition of geopolymer, the quantity of aluminum starts decreasing before calcium increases and silicon decreases to reach the cement composition.
The microcrack was situated just after the aluminum decrease to the cement average value. This is coherent with the observation of the global mapping. Although it is not possible to ascertain that the transition zone was not formerly a part of the cement, cracks tend to appear at the junction between this zone and the unaltered cement.
4. Discussion
XRD and micro-Raman spectroscopy are both efficient to characterize standard hydrated Portland cement. Although only the latter allowed to focus on the surface, both technics are complementary. As intended, the mineral composition of the cement was standard. Portlandite and CSH were clearly identifiable. Calcium aluminosulfate compounds were also visible. However, the similarities between ettringite (an AFt) and monosulfoaluminate (AFm) did not allow one to distinguish them with certainty. The XRD data would suggest ettringite, but the conversion of this phase to AFm cannot be excluded. Also carbonation close to the surface is clearly observable using Raman spectroscopy. Unreacted belite grains are also clearly identifiable. Finally, minor compounds such as C4AF and hydrogarnet can sometimes be identified. However, their contribution being modest, they are only identifiable in this study on some spectra where contribution of carbonates is minimal.
This possibility to observe and localize carbonate is very important to observe the impact of pure water or geopolymer activating solution immersion on the cement surface chemistry. In both cases carbonation was observed, albeit a different way. After 24 hours in pure water, calcium carbonate-dominated zones are grain-like scattered in the first hundred micrometers from the surface. This observation is coherent with the non-sharp carbonation front observed in other studies [Citation26]. In standard Portland cement both CSH and portlandite are subject to carbonation [Citation27], but portlandite carbonation is initially more rapid. Moreover, this phase is the most sensitive to dissolution as highlighted in studies about calcium leaching from cements or concrete [Citation26]. The localized carbonation we observe by Raman spectroscopy after immersion in pure water can thus be explained by the formation of microcrystals at the surface of Ca(OH)2 crystals after or during their partial dissolution.
After immersion in the activation solution of geopolymers for various durations, carbonation was also observed. However, the carbonates are not scattered as clearly segregated grains, but present in root-like shape progressing from the surface inward following what appears to be the main phase of the cement matrix. The surface of the sample immersed for 24 h in the alkaline solution is dominated by the carbonate, avoiding unreacted belite and C4AF as well as secondary phases such as hydrogarnet. The carbonate-dominated zones still have in their Raman spectra contributions of portlandite, CSH and sulphoaluminate. Thus, the calcium of the newly formed carbonate can originate from any combination of these compounds. These results are coherent with the literature about the effect of waterglass treatment on the cement permeability [Citation28,Citation29]. Indeed, the formation of carbonates in the silica-rich regions decreases the pore size distribution, densifies locally the material, affects the composition of the CSH gel, and decreases the permeability of the material. This phenomenon would not seal large cracks in the cementitious material but could be used to decrease its permeability and seal microcracks.
The cement covered by geopolymer, on the contrary, showed less carbonation that any other sample. This surprising result can be explained in two different ways. On the one hand, the geopolymer possibly acted as a protecting layer and reduced the access of CO2 to the surface. However, this explanation is valid only for the seven days between the coating and the slicing of the sample.
On the other hand, the geopolymer paste is an activation solution with metakaolin undergoing dissolution and aggregates of the new geopolymer structure being formed by condensation reactions. With a porous structure such as the one geopolymer, it would be surprising to form an impermeable structure over the cement surface. However, reactive aluminates and aluminosilicate nanoaggregates present in solution are potentially able to seal the porosity of the cement surface. The latter explanation is coherent both with the Raman and the EDX results. The aluminum decrease being on the geopolymer side compared to the silicate one is an indication that aluminum intruded the cement to a lesser extent. The aluminate species dissolved from the metakaolin are very reactive and rapidly form nanoaggregates [Citation30,Citation31]. The mobility of these aggregates is lower and their reactivity is higher than the silicate oligomers. Thus, it is conceivable that these aggregates react in the first micrometers of the interface and then react preferentially with silicates, sealing the porosity. It is thus possible to explain both the low impact of the geopolymer on the cement internal structure and the low permeation properties provided by the geopolymer coatings [Citation5,Citation6].
However, as seen during the SEM observation and EDX measurements, under extreme drying, the geopolymer and cement present cracks after this aluminum rich part of the interface. This result is expected with pure pastes in a high vacuum as shrinkage behavior is maximized and different for both matrices [Citation32]. It is especially expected with geopolymer as they experience intensive shrinkage after a critic drying degree [Citation33].
Nonetheless, it is probable that the permeability properties provided by the geopolymer and cement interface would be lost after extensive drying. This observation is coherent with the literature on the bonding strength between the geopolymer and cement [Citation34]. An optimum of strength was found under sealed curing conditions, in which both matrices swelling or shrinkage are minimized. Altogether, these results imply that the interface is dense and brittle, lacking the elasticity necessary to relax the stress arising for the different shrinkage coefficients of geopolymer and cement. To suppress this cracking behavior while keeping the low permeability property of the interface, a straightforward solution would be to refine the geopolymer formulation and unreactive charge loading to match the shrinkage coefficient of the cement substrate. Although most methods are only feasible for concrete recycling, it would also be possible to alter the surface of the cement substrate to tailor the properties of the interface [Citation35].
During decommissioning operations under water such as the one of the reactors of Fukushima daiichi, such a strong drying is not expected. Indeed, most of the decommissioning should be performed under water or water sprinkling. It is also interesting to note that this behavior could be used advantageously to segregate the wastes before waste treatment. The application of high temperature or strong vacuum would allow to separate the geopolymer, concrete, and metallic parts to treat them conveniently.
5. Conclusions
Geopolymers were investigated as a candidate for sealing and repair of damaged concrete structures. This application is important not only for decommissioning activities but also for standard industrial purposes. Changes in the microstructure of cement were investigated after immersion in the activating solution of a geopolymer or after embedding in a geopolymer matrix. Analysis of the results led to the following conclusions:
The immersion in activating solution induces a localized carbonation at the surface of the cement similar to what is observed with waterglass treatment of ordinary Portland cements. Contrary to standard carbonation, it does not start around portlandite. The carbonation progresses in a dendritic pattern inward, following the CSH gel into the cement.
When embedded in geopolymer, a 30-μm-thick transition zone is formed at the interface with cement. The elemental evolution throughout the transition zone indicates that surface porosity of the cement is plugged by nanoaggregates of aluminosilicate. This phenomenon can explain both that the carbonation does not occur during the geopolymerization and the low permeability observed for geopolymer-coated cements in other studies.
Under extreme drying, the shrinkage of the geopolymer induces cracks after the aluminum-rich part of the transition zone. Thus, strong bonding and low permeability properties may be lost in some dire conditions.
Availability of data
The data that support the findings of this study is available from the corresponding author, VC, upon reasonable request.
Acknowledgments
The authors would like to thank S. Takaki for his experimental support for XRD measurements.
Disclosure statement
No potential conflict of interest was reported by the author(s).
Related Research Data
References
- Shibata A, Koma Y, Ohi T. Estimation of the inventory of the radioactive wastes in Fukushima Daiichi NPS with a radionuclide transport model in the contaminated water. J Nucl Sci Technol. 2016;53:1933–1942.
- Status of Contaminated Water Measures [Internet]. [ cited 2021 Aug 24]. Available from: https://www.tepco.co.jp/en/hd/decommission/progress/watermanagement/index-e.html
- IRID Annual Research Report 2017 Pamphlet [Internet]. 2018 [cited 2021 Aug 27]. p. 12–15. Available from: https://irid.or.jp/_pdf/pamphleth29_eng.pdf
- Rong X, Wang Z, Xing X, et al. Review on the adhesion of geopolymer coatings. Acs Omega. 2021;6:5108–5112.
- Zhang Z, Yao X, Wang H. Potential application of geopolymers as protection coatings for marine concrete III. Field experiment. Appl Clay Sci. 2012;67–68:57–60.
- Aguirre-Guerrero AM, Robayo-Salazar RA, de Gutiérrez RM. A novel geopolymer application: coatings to protect reinforced concrete against corrosion. Appl Clay Sci. 2017;135:437–446.
- Ding Y-C, Cheng T-W, Dai Y-S. Application of geopolymer paste for concrete repair. Struct Concr. 2017;18:561–570.
- Xu Z, Huang Z, Liu C, et al. Research progress on mechanical properties of geopolymer recycled aggregate concrete. Rev Adv Mater Sci. 2021;60:158–172.
- Ren X, Zhang L. Experimental study of geopolymer concrete produced from waste concrete. J Mater Civ Eng. 2019;31:04019114.
- Fernandez-Jimenez A, Macphee DE, Lachowski EE, et al. Immobilization of cesium in alkaline activated fly ash matrix. J Nucl Mater. 2005;346:185–193.
- Leemann A. Raman microscopy of alkali-silica reaction (ASR) products formed in concrete. Cem Concr Res. 2017;102:41–47.
- Bensted J. Uses of Raman spectroscopy in cement chemistry. J Am Ceram Soc. 1976;59:140–143.
- Kirkpatrick RJ, Yarger JL, McMillan PF, et al. Raman spectroscopy of C-S-H, tobermorite, and jennite. Adv Cem Based Mater. 1997;5:93–99.
- Sekiya T, Ohta S, Kamei S, et al. Raman spectroscopy and phase transition of anatase TiO2 under high pressure. J Phys Chem Solids. 2001;62:717–721.
- Black L, Breen C, Yarwood J, et al. In situ Raman analysis of hydrating C3A and C4AF pastes in presence and absence of sulphate. Adv Appl Ceram. 2006;105:209–216.
- Black L, Breen C, Yarwood J, et al. Structural features of CSH(I) and its carbonation in air: a Raman spectroscopic study. Part II: carbonated phases. J Am Ceram Soc. 2007;90:908–917.
- Renaudin G, Segni R, Mentel D, et al. A Raman study of the sulfated cement hydrates: ettringite and monosulfoaluminate. J Adv Concr Technol. 2007;5:299–312.
- Garbev K, Stemmermann P, Black L, et al. Structural features of CSH(I) and its carbonation in air: a Raman spectroscopic study. Part i: fresh phases. J Am Ceram Soc. 2007;90:900–907.
- Ibáñez J, Artús L, Cuscó R, et al. Hydration and carbonation of monoclinic C2S and C3S studied by Raman spectroscopy. J Raman Spectrosc. 2007;38:61–67.
- Torréns-Martín D, Fernández-Carrasco L, Martínez-Ramírez S, et al. Raman spectroscopy of anhydrous and hydrated calcium aluminates and sulfoaluminates. Jennings H, editor. J Am Ceram Soc. 2013;96:3589–3595.
- Ortaboy S, Li J, Geng G, et al. Effects of CO2 and temperature on the structure and chemistry of C–(A–)S–H investigated by Raman spectroscopy. RSC Adv. 2017;7:48925–48933.
- Cantarel V, Arisaka M, Yamagishi I. On the hydrogen production of geopolymer wasteforms under irradiation. J Am Ceram Soc. 2019;102:7553–7563.
- Cantarel V, Lambertin D, Labed V, et al. Online measurement of the atmosphere around geopolymers under gamma irradiation. J Nucl Sci Technol. 2021;58:62–71.
- Carteret C, Dandeu A, Moussaoui S, et al. Polymorphism studied by lattice phonon Raman spectroscopy and statistical mixture analysis method. Application to calcium carbonate polymorphs during batch crystallization. Cryst Growth Des. 2009;9:807–812.
- Scepanovic M, Grujic-Brojcin M, Dohcevic-Mitrovic ZD, et al. Characterization of anatase TiO2 nanopowder by variable-temperature Raman spectroscopy. Sc Sinter. 2009;41:67–73.
- Thiery M, Villain G, Dangla P, et al. Investigation of the carbonation front shape on cementitious materials: effects of the chemical kinetics. Cem Concr Res. 2007;37:1047–1058.
- Morandeau A, Thiéry M, Dangla P. Investigation of the carbonation mechanism of CH and C-S-H in terms of kinetics, microstructure changes and moisture properties. Cem Concr Res. 2014;56:153–170.
- Jia L, Shi C, Pan X, et al. Effects of inorganic surface treatment on water permeability of cement-based materials. Cem Concr Compos. 2016;67:85–92.
- Pan X, Shi Z, Shi C, et al. Interactions between inorganic surface treatment agents and matrix of Portland cement-based materials. CONSTR BUILD MATER. 2016;113:721–731.
- Steins P, Poulesquen A, Diat O, et al. Structural evolution during geopolymerization from an early age to consolidated material. LANGMUIR. 2012;28:8502–8510.
- Benavent V, Steins P, Sobrados I, et al. Impact of aluminum on the structure of geopolymers from the early stages to consolidated material. Cem Concr Res. 2016;90:27–35.
- Panchmatia P, Olvera R, Genedy M, et al. Shrinkage behavior of Portland and geopolymer cements at elevated temperature and pressure. J Pet Sci Eng. 2020;195:107884.
- Kuenzel C, Vandeperre LJ, Donatello S, et al. Ambient temperature drying shrinkage and cracking in metakaolin-based geopolymers. J Am Ceram Soc. 2012;95:3270–3277.
- Zhu H, Zhang Z, Deng F, et al. The effects of phase changes on the bonding property of geopolymer to hydrated cement. CONSTR BUILD MATER. 2013;48:124–130.
- Shi C, Li Y, Zhang J, et al. Performance enhancement of recycled concrete aggregate – a review. J Clean Prod. 2016;112:466–472.