
ABSTRACT
Raman spectroscopy is a powerful technique for studying nuclear materials. However, it has been scarcely utilized for nuclear fuel debris. Here, we present a Raman study of several types of simulated nuclear debris synthesized from uranium, stainless steel, and zirconium to identify and characterize chemical components included in the simulated debris. Raman spectroscopy sensitively identified many kinds of chemical components: cubic UO2, U3O8, (Fe,Cr)UO4 (iron–chromium uranate), spinel oxides, monoclinic ZrO2, tetragonal ZrO2, and Zr3O. Some details concerning the chemical states of each component included in the simulated debris were obtained (e.g. spinel oxides were suggested to consist of Fe, Cr, Ni, Zr, and U). The results obtained here will be helpful in the Raman analysis of actual nuclear debris, such that in the Fukushima Daiichi nuclear power plants.
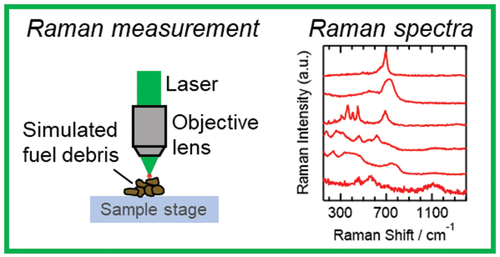
Graphical Abstract
KEYWORDS:
1. Introduction
In the decommissioning of the Fukushima Daiichi nuclear power plants, the retrieval of the nuclear fuel debris from the reactors and their storage, processing, and disposal are central missions. The nuclear fuel debris is considered to be complicated, heterogeneous, rugged, and solid mixtures consisting of various chemical components because they were generated through melting and cooling of nuclear fuels, zircaloy cladding, control rods, and structural materials in a wide range of temperatures and atmospheric conditions [Citation1]. So far, the isotopic and physicochemical properties of the fuel debris have been characterized through particulates released into the environment (e.g. [Citation2–5]) and some particles sampled from the reactors [Citation6]. However, the nuclear fuel debris is mostly veiled because the amount of the actual sample is little, and the analytical methods applied to the nuclear fuel debris are very limited. Further analyses are desired to uncover what nuclear fuel debris is, and it will be helpful for future storage, processing, and disposal of the debris.
Studying simulated nuclear fuel debris is an effective approach to understanding the chemical properties of actual nuclear debris. This is because simulated debris systematically synthesized in controlled experimental conditions is considered to be model materials of a part of the actual complicated debris, and experimental data obtained from simulated debris are helpful in interpreting the data of the actual debris. Because the chemical stability of the debris is one of the most important properties to understand for the future treatments of the actual debris, a number of leaching and dissolution studies have been conducted using simulated debris [Citation7–17]. In these studies and other characterization researches on simulated debris [Citation18–24], the chemical states of simulated debris have been mostly analyzed using X-ray diffraction (XRD) and electron microscope techniques, which revealed crystal phases and microscopic morphologies with spatial elemental distributions. Indeed, studying simulated debris using other analytical methods will advance understanding of the physicochemical features of debris.
Raman spectroscopy is a powerful analytical technique to reveal micro-scale structures and detailed chemical states and is widely applied to various materials, including nuclear materials (e.g. [Citation25–51]). However, the Raman analyses of actual [Citation27,Citation39,Citation42,Citation47] and simulated [Citation14,Citation16,Citation17] nuclear debris are scarce, and very limited aspects of nuclear fuel debris have been studied so far. In our recent studies [Citation16,Citation17], several types of simulated debris were synthesized from uranium, stainless steel (SUS), and zirconium (i.e. U-SUS and U-SUS-Zr simulated debris) to understand the debris of the Fukushima Daiichi nuclear power plants, and Raman spectroscopy was utilized only to discuss the chemical alteration of the simulated debris through reactions with H2O2 in an aqueous solution [Citation17] and whether Fe is dissolved in cubic UO2 matrix solid solutions [Citation16]. Herein, we identified and characterized various chemical components included in the U-SUS and U-SUS-Zr simulated debris using Raman spectroscopy.
2. Experimental
2.1. Synthesis of simulated nuclear fuel debris
The simulated debris analyzed in this study was same as that used in our previous studies [Citation16,Citation17]. The synthesis conditions are summarized in . Briefly, the starting materials were a mixture of UO2, stainless steel (SUS304, <100 mesh powder, Niraco, Japan), Zr metal (>95%, FUJIFILM Wako Pure Chemical Ltd., Japan), and ZrO2 (>98%, FUJIFILM Wako Pure Chemical). The elemental composition of the SUS304 alloy (in wt%) included Fe: 68.77, Cr: 18.71, Ni: 11.09, Si: 0.86, Mn: 0.18, C: 0.15, and others: 0.24. The mixture of the samples was well ground using an agate mortar and heated on an alumina dish in the central part of a reaction tube made of alumina surrounded by an electric furnace at 1200°C or 1600°C with a gas flow of ultrapure Ar (Grade 1) or 98 vol.% Ar + 2 vol.% O2 for 1, 8, or 12 h. For samples containing Zr synthesized by heating at 1600°C in a 2% O2 atmosphere, the heat treatments were conducted on a platinum foil placed on an alumina dish to ease the collection of the samples. The products were pulverized using an agate mortar.
Table 1. Synthesis conditions of the U-SUS and U-SUS-Zr simulated debris and the chemical components identified by XRD and Raman spectroscopy.
2.2. Raman spectroscopy
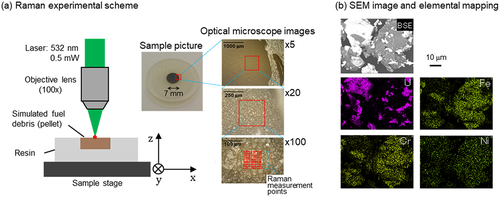
For convenient Raman measurements, most of the simulated debris powders were molded into 7-mm diameter disks by hydraulic pressure using a tungsten carbide die and fixed on an acrylic resin holder using an epoxy adhesive (). A confocal Raman microscope setup (NRS-4500, JASCO) was used to obtain the Raman spectra of the simulated debris. A 532-nm laser with 0.5-mW power was introduced to a sample surface on a sample stage through a ×100 objective lens. By moving the motor stages, Raman spectra at many different positions were collected. In the optical microscope ×100 image in , the measurement points are represented by red-marked points. Some XY scans were conducted in several different regions optionally selected for each sample. The total measurement points for each sample were ~100–1000. The spatial measurement region at each single measurement position was about 1 μm3. The wavenumbers (cm−1) in the Raman spectra were calibrated by measuring the Si Raman band at 520.5 cm−1.
Figure 1. (a) Schematic illustrations of the Raman microscopy measurement and a picture of a molded sample and its optical microscope images with different magnifications. The red-marked points on the optical microscope ×100 image are sample measurement points. (b) Backscattered electron (BSE) SEM image of the 4 U-SUS simulated debris sample and elemental mapping data obtained using EDX spectroscopy.
In this study, averaged and nonaveraged Raman spectra were presented to show representative main features of each sample and heterogeneous features of each sample depending on spatial positions, respectively. The averaged Raman spectra were the ones obtained by arithmetic average of all Raman spectra measured for a simulated debris sample, whereas the nonaveraged Raman spectra were the ones measured at a single measurement position.
2.3. XRD and SEM-EDX spectroscopy
The XRD patterns of some samples made from stainless steel and Zr with no uranium were measured to validate the assignments of Raman signals for this study using a Rigaku MiniFlex 600 diffractometer equipped with a D/teX Ultra2 detector with Cu-Kα radiation at 40 kV and 15 mA. Diffraction data were collected from 20° to 140° in 2θ with a step interval of 0.02° at a scan rate of 20°/min. The XRD patterns of the uranium-containing simulated debris investigated in this work were already reported in our previous studies [Citation16,Citation17] but are presented in Figure S1. Scanning electron microscopy coupled with energy-dispersive X-ray spectroscopy (SEM-EDX; JCM-7000, JEOL) was conducted to demonstrate elemental heterogeneity for one of the simulated debris ().
3. Results and discussion
3.1. U-SUS simulated debris
shows a SEM image of a U-SUS simulated debris sample with U, Fe, Cr, and Ni elemental mapping. These images indicate the spatial heterogeneity of the elements in the prepared samples. Because of the spatial heterogeneity of the samples, the Raman spectral features varied depending on the measurement positions on the surface of each simulated debris. Hence, in the present study, ~100–1000 Raman spectra were measured at different positions optionally selected on the surface of each sample, and arithmetic average was performed. The averaged Raman spectra are shown in as representatives of each sample, reflecting the main features of the simulated debris. Each averaged spectrum shows a spectral pattern different from those of other spectra. This indicates that each simulated debris is in a different chemical state, which is formed depending on the synthesis conditions. As discussed in the following, all Raman signals in can be assigned to four components: cubic UO2(s.s.), U3O8, (Fe,Cr)UO4 (iron–chromium uranate), and spinel oxides(s.s.), where (s.s.) stands for a solid solution with some metal ions.
Figure 2. (a) Averaged Raman spectra of the U-SUS simulated debris (1–4). (b) A typical Raman spectrum of cubic UO2.
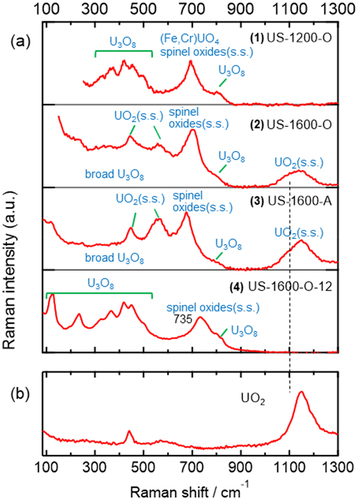
3.1.1. Cubic UO2
The fluorite crystal form of UO2 is in a cubic arrangement and typically shows three Raman bands at ~445, ~560, and ~1150 cm−1, as shown in . The corresponding three bands due to the UO2 component were observed in the 2 and 3 simulated debris samples. The ~1150-cm−1 bands observed in 2 and 3 are broader, and their intensities are weaker than that of pure UO2 (). This indicates that the chemical states of the UO2 components in 2 and 3 are somewhat different from that of the pure UO2. The greater intensity of the ~560-cm−1 bands in 2 and 3 relative to that of pure UO2 is also indicative of the difference in the UO2 components included in these simulated debris. Figure S2 presents that the wavenumber position and broadness of the nonaveraged (single-point) Raman bands depend on the measurement positions, and hence, the chemical states of the UO2 components included in 2 and 3 are not homogeneous.
The UO2 components observed in 2 and 3 are probably in hyperstoichiometric states (UO2+x) because UO2+x also shows spectral patterns similar to those of UO2 but with a smaller intensity at ~1150 cm−1 and a larger intensity at ~560 cm−1 [Citation38]. Because another Raman band at ~630 cm−1 was observed for UO2+x with x values of more than ~0.1 [Citation38] and not clearly observed in 2 and 3, the x value of UO2+x in 2 and 3 can be estimated to be less than ~0.1. On another note, the spectral features regarding the shoulder signals around 1100 cm−1 of 2 and 3 (the dashed line in shows the shoulder signals) were not observed in UO2+x [Citation26,Citation29,Citation38]. Therefore, it was suggested that the UO2 components included in 2 and 3 form UO2(s.s.), which are UO2 solid solutions mainly with Fe deriving from the SUS starting material, as already pointed out in our previous papers [Citation16,Citation17].
The UO2 component was not observed in 1 and 4, although UO2(s.s.) and UO2 were identified using XRD as a main component in 1–4 ( and Figure S1). The UO2(s.s.) components of 1 and 4 are considered dissolve a higher degree of Fe because their lattice parameters of UO2(s.s.) are lower than those of 2 and 3 [Citation16,Citation17]. Accordingly, this suggests that a higher degree of Fe dissolution in UO2 would make its Raman signals inactive, probably because its UO2(s.s.) crystal structure becomes far from that of pure UO2 by Fe dissolution. The missing of the UO2 Raman bands in 1 and 4 cannot be explained by UO2+x [Citation29,Citation38], supporting that Fe is dissolved in UO2.
3.1.2. U3O8
In the Raman spectra of the U-SUS simulated debris (), the signals at ~800 cm−1 and in the region of less than ~500 cm−1 were attributed to U3O8. This assignment was confirmed by comparing the nonaveraged (single-point) Raman spectra of the U3O8 component observed in the simulated debris (Figure S3) with the Raman spectra in the literature [Citation25,Citation26,Citation28,Citation30,Citation31,Citation34,Citation36,Citation44] and of a U3O8 sample we prepared (Figure S4). These spectral patterns are clearly different from those of other uranium oxides whose oxidation state is close to U3O8, such as U3O7 [Citation25] or U4O9 [Citation32]. Because U3O8 and U3O8−x show similar Raman spectra [Citation44], the slight difference in the oxidation states of the U3O8 components is difficult to discuss. Similarly, discussing the formation of U3O8 solid solutions like UO2 in detail is difficult because the standard spectra of the U3O8 sample are heterogeneous (Figure S4), and the spectral signature induced by the solid solution formation is obscure.
The spectral feature of the U3O8 components observed in 2 and 3 was different from those observed in 1 and 4: the sharp bands in the region less than ~500 cm−1 were not observed in 2 and 3 (). This feature can be clearly seen in the nonaveraged spectra in Figure S3, and all Raman spectra of the U3O8 components observed in 2 and 3 were broad and structureless. Because U3O8 was not detected by XRD in 2 and 3 (, Figure S1), the broad Raman signal of the U3O8 component is due to a U3O8 component undetected by XRD. Such U3O8 components have not been reported so far, to the best of our knowledge. Although the broad U3O8 component is also observed in 1 and 4 (Figure S3), XRD identified U3O8 in 1 and 4 likely because the U3O8 components showing sharp Raman bands can be sensitively detected by XRD. The broadening of vibrational Raman bands could result from the existence of multiple vibrational modes with slightly different frequencies that are induced by some structural heterogeneity of materials on a microscopic scale [Citation41].
3.1.3. (Fe,Cr)UO4
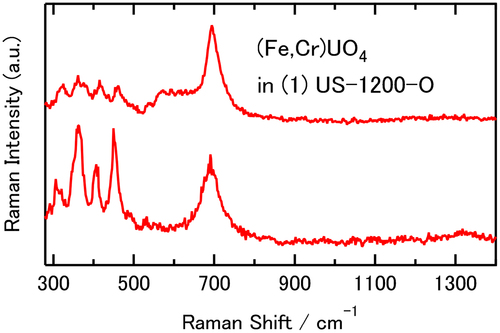
In the Raman spectra of , the (Fe,Cr)UO4 uranate component was identified by referring to the Raman spectra of (Fe,Cr)UO4 synthesized from starting materials with different Fe/(Fe+Cr) ratios, as reported in our recent study [Citation52]. The synthesized (Fe,Cr)UO4 showed a single main band around 700 cm−1 regardless of the Fe/(Fe+Cr) ratio, while spectral patterns consisting of several bands in the region less than 500 cm−1 were strongly dependent on the Fe/(Fe+Cr) ratio. shows the nonaveraged spectra identified as the (Fe,Cr)UO4 components in 1. The Fe/(Fe+Cr) ratio of the (Fe,Cr)UO4 components was estimated to be between 0.75 and 1 by comparing with the spectral features of the synthesized (Fe,Cr)UO4 [Citation52]. The high Fe/(Fe+Cr) ratio of the (Fe,Cr)UO4 components observed in the simulated debris corresponds to the Fe-rich elemental composition (68.77 wt%) of the SUS starting material. The spectral patterns due to the (Fe,Cr)UO4 components as shown in were only observed in 1 but not in 2–4, consistent with the XRD result (, Figure S1). The reason why the bands around 700 cm−1 were also observed in 2–4 () is that other chemical components also show bands at ~700 cm−1, which is discussed in the following section.
Figure 3. Nonaveraged (single-point) Raman spectra of the (Fe,Cr)UO4 uranate components observed in the 1 U-SUS debris.
3.1.4. Spinel oxides
shows representative examples of nonaveraged Raman spectra of chemical components showing a band around 700 cm−1 but not assignable to (Fe,Cr)UO4. These spectra did not show signals characteristic of (Fe,Cr)UO4: several bands in the region less than 500 cm−1 were observed in the higher Fe/(Fe+Cr) ratio () and a single band around 425 cm−1 was observed in the lower Fe/(Fe+Cr) ratio [Citation52]. Therefore, the components of are not due to (Fe,Cr)UO4. In the spectra of , the wavenumber positions of the ~700-cm−1 bands and their bandwidths are slightly different from each other, suggesting that these components are highly heterogeneous and can form various chemical states that are very similar to each other. In the averaged Raman spectra of , all ~700-cm−1 bands consist of these components, and the ~700-cm−1 band of 1 has some contributions of (Fe,Cr)UO4.
Figure 4. Representative some examples of the nonaveraged (single-point) Raman spectra of chemical components assignable to spinel oxides, observed in the 1–4 U-SUS simulated debris.
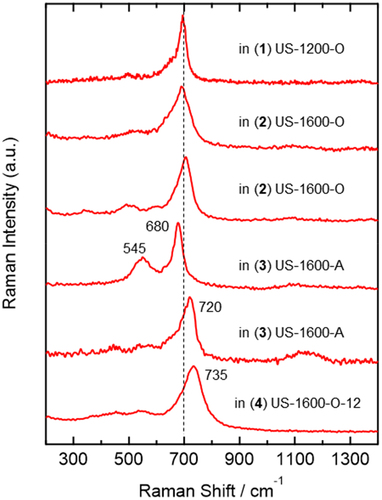
It has been reported that spinel oxides, denoted generally as M3O4, form various kinds of solid solutions. Among them, ferrite and chromate spinel oxides commonly show a single main Raman band at ~700 cm−1, and the wavenumber positions of the ~700-cm−1 bands are sensitively shifted depending on the kind and ratio of metal elements M dissolved in the spinel oxides [Citation53,Citation54]. In particular, the Raman spectra of NiFexCr2−xO4 (0 < x < 2) spinel oxides are very similar to those in : single main bands of the spinel oxides appear in the 686–702 cm−1 region depending on the x value [Citation53]. The spinel oxides Fe3O4, NiFe2O4 (x = 2), and NiCr2O4 (x = 0) were readily excluded as candidates for the components of because Fe3O4 shows a single main band at ~670 cm−1 (rather lower than the ~700-cm−1 bands observed in ) and NiFe2O4 (x = 2) and NiCr2O4 (x = 0) show strong sidebands at ~500 cm−1 [Citation53]. Therefore, the components of are assignable to components close to NiFexCr2−xO4 (0 < x < 2) spinel oxides. The Raman spectrum of 3 showing bands at ~545 and ~680 cm−1 is close to that of FeCr2O4 [Citation53]. Some iron oxides, such as Fe2O3, FeO, and FeOOH, were excluded as the components of because of their different Raman spectral features [Citation55].
The influence of the existence of uranium on the formation of spinel oxides can be discussed by comparing the Raman spectrum of 4 (the bottom one of ) and that of a heated SUS sample () because both samples were prepared at the same heating condition (1600°C, 2% O2, and 12 h), and the only difference between the two samples is the presence or absence of uranium. The heated SUS sample was identified as spinel oxides dissolving Fe, Cr, and Ni because the XRD pattern () is the closest to the standard XRD data of (Fe0.8Cr0.2)(NiFe0.2Cr0.8)O4 among some spinel oxides available in the Inorganic Crystal Structure Database (ICSD) [Citation56]. The Raman spectrum of the heated SUS sample () shows a single band at ~700 cm−1, and its spectrum feature is very similar to those observed in the simulated debris (), supporting that the components of are spinel oxides dissolving Fe, Cr, and Ni elements. Importantly, the Raman bands due to the spinel oxides observed in 4 exhibit a single main band at ~735 cm−1 (), higher than that of the heated SUS (), and the high wavenumber position cannot be explained by any spinel oxides formed from Fe, Cr, and Ni elements in the literature. Therefore, the high wavenumber band of 4 at ~735 cm−1 strongly suggests the dissolution of U in the spinel oxides generated in the U-SUS simulated debris and the formation of (Fe,Cr,Ni,U)3O4. Although clear evidence was not observed, some degree of U dissolution is also expected in 1–3. It is generally recognized that uranium elements are incorporated in Fe3O4 (magnetite) by X-ray absorption spectroscopy [Citation57–59] and theoretical studies [Citation60–62]. To the best of our knowledge, the present study provides the first evidence suggesting that U can be dissolved even in composite spinel oxides. Furthermore, the present study demonstrated that Raman spectroscopy is a sensitive probe for such composite spinel oxides relative to XRD (, Figure S1) partly because the crystallinity of composite spinel oxides formed from several different elements would be low.
Figure 5. (a) Averaged Raman spectrum of a heated SUS sample. (b) XRD pattern of the heated SUS and some standard XRD data of spinel oxides available in the ICSD [Citation56].
![Figure 5. (a) Averaged Raman spectrum of a heated SUS sample. (b) XRD pattern of the heated SUS and some standard XRD data of spinel oxides available in the ICSD [Citation56].](/cms/asset/7c628824-3f4a-402f-a3a0-9ff5f3a6303f/tnst_a_2128460_f0005_oc.jpg)
3.2. U-SUS-Zr simulated debris
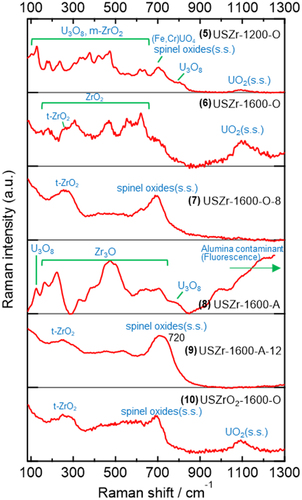
shows the averaged Raman spectra of the U-SUS-Zr simulated debris. Similar to the U-SUS simulated debris, ~100–1000 numbers of Raman spectra were measured at different positions of each sample because of the spatial heterogeneity of the samples. The spectral features varied depending on the synthesis conditions, suggesting that various chemical components were observed in the U-SUS-Zr simulated debris. The spectral features are also different from those of the U-SUS simulated debris (), indicating that some chemical components originating from Zr were generated in the U-SUS-Zr simulated debris. On the other hand, Raman signals due to the four components identified in the U-SUS simulated debris (UO2(s.s.), U3O8, (Fe,Cr)UO4, and spinel oxides(s.s.)) were also observed. These four components are discussed in the next section. Figure S5 presents some representative examples of the nonaveraged Raman spectra of the four components.
Figure 6. Averaged Raman spectra of the U-SUS-Zr simulated debris (5–10).
3.2.1. UO2(s.s.), U3O8, (Fe,Cr)UO4, and spinel oxides(s.s.)
Because the band at ~1100 cm−1 due to the UO2 component was observed in 5, 6, 8, and 10 similar to that with the U-SUS simulated debris, the UO2 components in the U-SUS-Zr simulated debris are considered to be UO2(s.s.) with Fe. Zr is also expected to be dissolved in the UO2(s.s.) component because of its much lower lattice parameters [Citation16,Citation17]. Contrary to the XRD result, UO2(s.s.) was not observed in 7 and 9 () probably because of the high degree of Fe dissolution. U3O8 components were identified in 5 and 8, and the U3O8 component in 8 is a U3O8 component undetected by XRD (). The (Fe,Cr)UO4 component with a high Fe/(Fe+Cr) ratio was identified only in 5, and the spectral patterns as shown in were not observed in 6–10, consistent with the XRD result ().
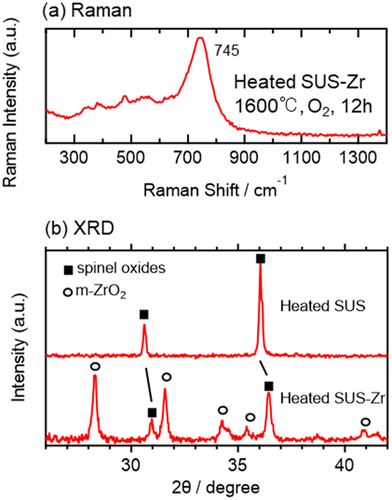
Spinel oxides were identified in 5, 6, 7, 9, and 10, and U is probably dissolved similarly to the U-SUS simulated debris because high wavenumber positions of the ~700-cm−1 band were observed in 9: 720 cm−1 in and 725 cm−1 in Figure S5. Additionally, Zr is also expected to dissolve in the spinel oxides because the Raman spectrum of spinel oxides observed in a heated SUS-Zr sample () also shows a band at ~745 cm−1, which is higher than that of the heated SUS (~700 cm−1 in ). This higher wavenumber is likely due to the dissolution of Zr in the spinel oxides. The difference in the XRD signals of the spinel oxides between the heated SUS and the SUS-Zr samples () supports the possibility of Zr dissolution in the structure of spinel oxides.
Figure 7. (a) Averaged Raman spectrum of a heated SUS-Zr sample. (b) XRD patterns of heated SUS and SUS-Zr samples.
3.2.2. ZrO2
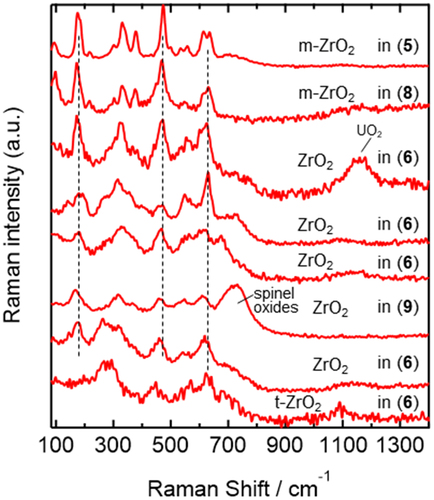
Two crystal forms of zirconia, monoclinic (m-ZrO2) and tetragonal (t-ZrO2), were identified in the U-SUS-Zr simulated debris. The m-ZrO2 components observed in 5 and 8 (the two top spectra in ) show spectral patterns similar to those reported in the literature (sharp bands at ~90, ~180, ~330, ~380, ~475, and ~620 cm−1) [Citation63–66], whereas 6 shows various spectral patterns that are somewhat different from those of m-ZrO2, suggesting that the chemical states of ZrO2 in 6 are close to those of m-ZrO2 but do not have a pure crystal structure and have some structural heterogeneity. Furthermore, 9 showed a Raman spectrum of the ZrO2 component close to that of m-ZrO2. The bottom spectrum of 6 in is assignable to t-ZrO2 because a band characteristic of t-ZrO2 was observed at ~260 cm−1 [Citation63,Citation64,Citation67], and the ~180-cm−1 band characteristic of m-ZrO2 () was absent. The t-ZrO2 signals at ~260 cm−1 were dominantly observed in the averaged spectra of 7, 9, and 10 in , indicating that t-ZrO2 is a dominant species in these simulated debris. Importantly, t-ZrO2 components were not observed in the heated SUS-Zr, which only consists of spinel oxides and m-ZrO2, indicating that U is dissolved in the structure of t-ZrO2 and is necessary for the formation of t-ZrO2 in the present synthesis conditions. The spectral patterns of t-ZrO2 observed in the simulated debris were not exactly identical to those in the literature [Citation63,Citation64,Citation67], supporting some structural distortion of t-ZrO2 by U dissolution.
Figure 8. Representative some examples of nonaveraged (single-point) spectra assignable to ZrO2 components observed in the 5, 6, 8, and 9 U-SUS-Zr debris.
3.2.3. Zr3O and the fluorescent signal
The Zr3O component was the dominant spectral signature observed in 8 (), and this assignment was confirmed by comparing with the Raman spectrum of Zr3O (). The Zr3O sample was prepared by heating Zr at 1600°C in 2% O2 for 1 h and was confirmed to be mainly Zr3O by XRD (). A strong fluorescent signal was observed in 8 in the wavenumber region greater than ~900 cm−1 (). This signal was also observed in alumina dishes used in the synthesis of the simulated debris. Hence, the fluorescent signal is due to the contamination of the alumina to the simulated debris.
Figure 9. (a) Averaged Raman spectrum of the 8 U-SUS-Zr debris (the same as that in ) and Raman spectrum of a Zr sample heated at 1600°C in 2% O2 for 1 h. (b) XRD pattern of the heated Zr (1 h) and the standard XRD data of Zr3O in the ICSD [Citation56].
![Figure 9. (a) Averaged Raman spectrum of the 8 U-SUS-Zr debris (the same as that in Figure 2) and Raman spectrum of a Zr sample heated at 1600°C in 2% O2 for 1 h. (b) XRD pattern of the heated Zr (1 h) and the standard XRD data of Zr3O in the ICSD [Citation56].](/cms/asset/59c011db-ce96-40ad-a8de-762736d6d972/tnst_a_2128460_f0009_oc.jpg)
4. Summary
Various chemical components included in several types of simulated nuclear fuel debris synthesized from uranium, stainless steel, and zirconium were identified and characterized by Raman spectroscopy. UO2 and UO2(s.s.) were identified, but UO2(s.s.) dissolving a large amount of Fe was not. U3O8 was sensitively observed, and a U3O8 component undetected by XRD was identified in some simulated debris. (Fe,Cr)UO4 was identified, and the Fe/(Fe+Cr) ratio in (Fe,Cr)UO4 can be estimated from the Raman spectral patterns. Spinel oxides were sensitively detected for most of the simulated debris, and many types of composite spinel oxides that are slightly different from each other were revealed to be formed in the simulated debris. The Raman signals of the spinel oxides suggest that U and Zr elements are also dissolved in the spinel component. Raman signals somewhat different from pure m-ZrO2 were observed, implying that a structural change occurred in the m-ZrO2 components. The observation of the Raman signal of t-ZrO2 suggested that the formation of t-ZrO2 necessitated the dissolution of U in the t-ZrO2 component in the present experimental condition. The Zr3O signal was sensitively detected by Raman. Overall, Raman spectroscopy can identify chemical components that XRD can do with different sensitivity, and can discuss chemical states, especially concerning elemental dissolution in spinel oxides. The results obtained in this study will be beneficial when actual nuclear debris, such as that in the Fukushima Daiichi nuclear power plants, is analyzed using Raman spectroscopy.
Supplemental Material
Download MS Word (507.5 KB)Acknowledgments
The authors thank T. Yomogida for the SEM measurements. This work was supported by the JAEA Nuclear Energy S&T and Human Resource Development Project through Concentrating Wisdom, Grant Number [JPJA18P18071886].
Disclosure statement
No potential conflict of interest was reported by the author(s).
Supplementary material
Supplemental data for this article can be accessed online at https://doi.org/10.1080/00223131.2022.2128460
Correction Statement
This article has been corrected with minor changes. These changes do not impact the academic content of the article.
References
- Grambow B, Nitta A, Shibata A, et al. Ten years after the NPP accident at Fukushima: review on fuel debris behavior in contact with water. J Nucl Sci Technol. 2022;59(1):1–24.
- Zheng J, Tagami K, Watanabe Y, et al. Isotopic evidence of plutonium release into the environment from the Fukushima DNPP accident. Sci Rep. 2012;2:304.
- Ochiai A, Imoto J, Suetake M, et al. Uranium dioxides and debris fragments released to the environment with cesium-rich microparticles from the Fukushima Daiichi Nuclear Power Plant. Environ Sci Technol. 2018;52(5):2586–2594.
- Martin PG, Louvel M, Cipiccia S, et al. Provenance of uranium particulate contained within Fukushima Daiichi Nuclear Power Plant Unit 1 ejecta material. Nat Commun. 2019;10:2801.
- Kurihara E, Takehara M, Suetake M, et al. Particulate plutonium released from the Fukushima Daiichi meltdowns. Sci Total Environ. 2020;743:140539.
- International Research Institute for Nuclear Decommissioning (IRID). Subsidy project of decommissioning and contaminated water management in the FY2017 Supplementary budgets, development of analysis and estimation technologies for fuel debris characterization, results for FY2019. Sep 2020. Available from: https://irid.or.jp/en/research/20190000-2/
- Kirishima A, Hirano M, Sasaki T, et al. Leaching of actinide elements from simulated fuel debris into seawater. J Nucl Sci Technol. 2015;52(10):1240–1246.
- Sasaki T, Takeno Y, Kirishima A, et al. Leaching test of gamma-emitting Cs, Ru, Zr, and U from neutron-irradiated UO2/ZrO2 solid solutions in non-filtered surface seawater. J Nucl Sci Technol. 2015;52(2):147–151.
- Sasaki T, Takeno Y, Kobayashi T, et al. Leaching behavior of gamma-emitting fission products and Np from neutron-irradiated UO2–ZrO2 solid solutions in non-filtered surface seawater. J Nucl Sci Technol. 2016;53(3):303–311.
- Kumagai Y, Takano M, Watanabe M. Reaction of hydrogen peroxide with uranium zirconium oxide solid solution — zirconium hinders oxidative uranium dissolution. J Nucl Mater. 2017;497:54–59.
- Kirishima A, Hirano M, Akiyama D, et al. Study on the leaching behavior of actinides from nuclear fuel debris. J Nucl Mater. 2018;502:169–176.
- Kirishima A, Nagatomo A, Akiyama D, et al. Study on the chemical structure and actinide leaching of MCCI debris. J Nucl Mater. 2019;527:151795.
- Sasaki T, Sakamoto S, Akiyam D, et al. Leaching behavior of gamma-emitting fission products, calcium, and uranium from simulated MCCI debris in water. J Nucl Sci Technol. 2019;56(12):1092–1102.
- Nakayoshi A, Jegou C, De Windt L, et al. Leaching behavior of prototypical corium samples: a step to understand the interactions between the fuel debris and water at the Fukushima Daiichi reactors. Nucl Eng Des. 2020;360:110522.
- Onishi T, Maeda K, Katsuyama K. Leaching behavior of radionuclides from samples prepared from spent fuel rod comparable to core debris in the 1F NPS. J Nucl Sci Technol. 2021;58(4):383–398.
- Kirishima A, Akiyam D, Kumagai Y, et al. Structure, stability, and actinide leaching of simulated nuclear fuel debris synthesized from UO2, Zr, and stainless-steel. J Nucl Mater. 2022;567:153842.
- Kumagai Y, Kusaka R, Nakada M, et al. Uranium dissolution and uranyl peroxide formation by immersion of simulated fuel debris in aqueous H2O2 solution. J Nucl Sci Technol. 2022;59(8):961–971.
- Bechta SV, Krushinov EV, Almjashev VI, et al. Phase diagram of the UO2–FeO1+x system. J Nucl Mater. 2007;362(1):46–52.
- Almjashev VI, Barrachin M, Bechta SV, et al. Eutectic crystallization in the FeO1.5–UO2+x–ZrO2 system. J Nucl Mater. 2009;389(1):52–56.
- Almjashev VI, Barrachin M, Bechta SV, et al. Phase equilibria in the FeO1+x–UO2–ZrO2 system in the FeO1+x-enriched domain. J Nucl Mater. 2010;400(2):119–126.
- Okamoto Y, Takano M. Chemical state analysis of simulated corium debris by EXAFS. Prog Nucl Sci Technol. 2018;5:200–203.
- Akiyama D, Akiyama H, Uehara A, et al. Phase analysis of uranium oxides after reaction with stainless steel components and ZrO2 at high temperature by XRD, XAFS, and SEM/EDX. J Nucl Mater. 2019;520:27–33.
- Brissonneau L, Ikeuchi H, Piluso P, et al. Material characterization of the VULCANO corium concrete interaction test with concrete representative of Fukushima Daiichi Nuclear Plants. J Nucl Mater. 2020;528:151860.
- Sumita T, Kitagaki T, Takano M, et al. Solidification and re-melting mechanisms of SUS-B4C eutectic mixture. J Nucl Mater. 2021;543:152527.
- Allen GC, Butler IS, Anh Tuan N. Characterization of uranium oxides by micro-Raman spectroscopy. J Nucl Mater. 1987;144(1–2):17–19.
- Manara D, Renker B. Raman spectra of stoichiometric and hyperstoichiometric uranium dioxide. J Nucl Mater. 2003;321(2–3):233–237.
- Geisler T, Burakov BE, Zirlin V, et al. A Raman spectroscopic study of high-uranium zircon from the Chernobyl “lava.” Eur J Mineral. 2005;17(6):883–894.
- Stefaniak EA, Alsecz A, Sajó IE, et al. Recognition of uranium oxides in soil particulate matter by means of μ-Raman spectrometry. J Nucl Mater. 2008;381(3):278–283.
- He H, Shoesmith D. Raman spectroscopic studies of defect structures and phase transition in hyper-stoichiometric UO2+x. Phys Chem Chem Phys. 2010;12(28):8108–8117.
- Jégou C, Caraballo R, Peuget S, et al. Raman spectroscopy characterization of actinide oxides (U1-yPuy)O2: resistance to oxidation by the laser beam and examination of defects. J Nucl Mater. 2010;405(3):235–243.
- Pointurier F, Marie O. Identification of the chemical forms of uranium compounds in micrometer-size particles by means of micro-Raman spectrometry and scanning electron microscope. Spectrochim Acta B. 2010;65(9–10):797–804.
- Desgranges L, Baldinozzi G, Simon P, et al. Raman spectrum of U4O9: a new interpretation of damage lines in UO2. J Raman Spectrosc. 2012;43(3):455–458.
- Pointurier F, Marie O. Use of micro-Raman spectrometry coupled with scanning electron microscopy to determine the chemical form of uranium compounds in micrometer-size particles. J Raman Spectrosc. 2013;44(12):1753–1759.
- Guimbretière G, Desgranges L, Jegou C, et al. Characterization of nuclear materials in extreme conditions: raman spectroscopy approach. IEEE Trans Nucl Sci. 2014;61(4):2045–2051.
- Rao R, Bhagat RK, Salke NP, et al. Raman spectroscopic investigation of thorium dioxide–uranium dioxide (ThO2–UO2) fuel materials. Appl Spectrosc. 2014;68(1):44–48.
- Dml H, Jones AE, Goulermas JY, et al. Raman spectroscopy of uranium compounds and the use of multivariate analysis for visualization and classification. Forensic Sci Int. 2015;251:61–68.
- Lebreton F, Horlait D, Caraballo R, et al. Peculiar behavior of (U,Am)O2-δ compounds for high americium contents evidenced by XRD, XAS, and Raman spectroscopy. Inorg Chem. 2015;54(20):9749–9760.
- Elorrieta JM, Bonales LJ, Rodríguez-Villagra N, et al. A detailed Raman and X-ray study of UO2+x oxides and related structure transitions. Phys Chem Chem Phys. 2016;18(40):28209–28216.
- Colle JY, Naji M, Sierig M, et al. A novel technique for Raman analysis of highly radioactive samples using any standard micro-Raman spectrometer. J Vis Exp. 2017;122:e54889.
- Lee J, Kim J, Youn YS, et al. Raman study on structure of U1-yGdyO2-x (y=0.005, 0.01, 0.03, 0.05 and 0.1) solid solutions. J Nucl Mater. 2017;486:216–221.
- Lu G, Haes AJ, Forbes TZ. Detection and identification of solids, surfaces, and solutions of uranium using vibrational spectroscopy. Coord Chem Rev. 2018;374:314–344.
- Shiryaev AA, Vlasova IE, Yapaskurt VO, et al. Forensic study of early stages of the Chernobyl accident: story of three hot particles. J Nucl Mater. 2018;511:83–90.
- Epifano E, Naji M, Manara D, et al. Extreme multi-valence states in mixed actinide oxides. Commun Chem. 2019;2:59.
- Miskowiec A, Niedziela JL, Spano TL, et al. Additional complexity in the Raman spectra of U3O8. J Nucl Mater. 2019;527:151790.
- Rickert K, Prusnick TA, Kimani MM, et al. Assessing UO2 sample quality with μ-Raman spectroscopy. J Nucl Mater. 2019;514:1–11.
- Medyk L, Manara D, Colle JY, et al. Determination of the plutonium content and O/M ratio of (U,Pu)O2-x using Raman spectroscopy. J Nucl Mater. 2020;541:152439.
- Shiryaev AA, Burakov BE, Vlasova IE, et al. Study of mineral grains extracted from the Chernobyl “lava.” Mineral Petrol. 2020;114:489–499.
- Spano TL, Niedziela JL, Shields AE, et al. Structural, spectroscopic, and kinetic insight into the heating rate dependence of studtite and metastudtite dehydration. J Phys Chem C. 2020;124(49):26699–26713.
- Kusaka R, Kumagai Y, Yomogida T, et al. Distribution of studtite and metastudtite generated on the surface of U3O8: application of Raman imaging technique to uranium compound. J Nucl Sci Technol. 2021;58(6):629–634.
- Lu KT, Zhang Y, Wei T, et al. An investigation of LnUO4 (Ln = Dy and Ho): structures, microstructures, uranium valences and magnetic properties. J Eur Ceram Soc. 2021;41(12):6000–6009.
- Sarrasin L, Miro S, Jégou C, et al. Studtite formation assessed by Raman spectroscopy and 18O isotopic labeling during the oxidative dissolution of a MOX fuel. J Phys Chem C. 2021;125(35):19209–19218.
- Akiyama D, Kusaka R, Kumagai Y, et al. Study on the relation between the crystal structure and thermal stability of FeUO4 and CrUO4. J Nucl Mater. 2022;568:153847.
- Hosterman BD. Raman spectroscopic study of solid solution spinel oxides. UNLV Theses, Dissertations, Professional Papers, and Capstones. 2011; 1087.http://dx.doi.org/10.34917/2476131
- D’Ipolito V, Andreozzi GB, Bersani D, et al. Raman fingerprint of chromate, aluminate and ferrite spinels. J Raman Spectrosc. 2015;46(12):1255–1264.
- de Faria DLA, Silva SV, de Oliveira MT. Raman microspectroscopy of some iron oxides and oxyhydroxides. J Raman Spectrosc. 1997;28(11):873–878.
- Bergerhoff G, Brown ID, Allen FH, et al., Crystallographic Databases, International Union of Crystallography, Chester; 1987.
- Marshall TA, Morris K, Law GTW, et al. Uranium fate during crystallization of magnetite from ferrihydrite in conditions relevant to the disposal of radioactive waste. Mineral Mag. 2015;79(6):1265–1274.
- Pidchenko I, Kvashnina KO, Yokosawa T, et al. Uranium redox transformations after U(VI) coprecipitation with magnetite nanoparticles. Environ Sci Technol. 2017;51(4):2217–2225.
- Roberts HE, Morris K, Law GTW, et al. Uranium(V) incorporation mechanisms and stability in Fe(II)/Fe(III) (oxyhydr)oxides. Environ Sci Technol Lett. 2017;4(10):421–426.
- Kerisit S, Felmy AR, Ilton ES. Atomistic simulations of uranium incorporation into iron (hydr)oxides. Environ Sci Technol. 2011;45(7):2770–2776.
- Bender WM, Becker U. Quantum-mechanical investigation of the structures and energetics of uranium and plutonium incorporated into the magnetite (Fe3O4) lattice. ACS Earth Space Chem. 2019;3(4):637–651.
- Wang Z, Chen Q, Shih K, et al. Uranium(IV) incorporation into inverse spinel magnetite (FeFe2O4): a charge-balanced substitution case analysis. PramanaJ Phys. 2019;93:9.
- Kontoyannis CG, Orkoula M. Quantitative determination of the cubic, tetragonal and monoclinic phases in partially stabilized zirconias by Raman spectroscopy. J Mater Sci. 1994;29:5316–5320.
- Kim BK, Hahn JW, Han KR. Quantitative phase analysis in tetragonal-rich tetragonal/monoclinic two phase zirconia by Raman spectroscopy. J Mater Sci Lett. 1997;16:669–671.
- Kim BK, Hamaguchi H. Mode assignments of the Raman spectrum of monoclinic zirconia by isotopic exchange technique. Phys Stat Solidi B Res. 1997;203(2):557–563.
- Quintard PE, Barbéris P, Mirgorodsky AP, et al. Comparative lattice-dynamical study of the Raman spectra of monoclinic and tetragonal phases of zirconia and hafnia. J Am Ceram Soc. 2002;85(7):1745–1749.
- Kim DJ, Jung HJ, Yang IS. Raman spectroscopy of tetragonal zirconia solid solutions. J Am Ceram Soc. 1993;76(8):2106–2108.