
 ?Mathematical formulae have been encoded as MathML and are displayed in this HTML version using MathJax in order to improve their display. Uncheck the box to turn MathJax off. This feature requires Javascript. Click on a formula to zoom.
ABSTRACT
Direct disposal of spent nuclear fuel in underground repositories in stable geological formations is an alternative option for the reprocessing of spent fuel in Japan. Upon breakdown of the barriers between waste storage containers and the environment in a deep geological repository, release of radioactive nuclei from spent nuclear fuel into the environment will occur via groundwater. The release of radioactive nuclei will be dependent on the dissolution rate at the spent fuel/groundwater interface. The surface of UO2 in the spent fuel will be in the oxidized form UO2+x, and the extent of hyper-stoichiometry has implications for U dissolution. A key component of typical groundwater is bicarbonate which can range in concentration depending on repository location. Therefore, to understand the effect of bicarbonate on the UO2+x surface, UO2 pellets were immersed in bicarbonate solution for 298 days, and the UO2+x oxide surface was analysed by Raman spectroscopy. Detailed peak analysis of the Raman spectra showed increased defects after immersion attributed to the preferential dissolution of UV/VI from UO2+x. Differences in the defect concentration with and without bicarbonate were attributed to a change in U speciation (U(OH)4 to UO2(CO3)34-) as determined by speciation calculations. Raman depth profiles showed a constant value of x through the oxide surface.
1. Introduction
The direct disposal of spent nuclear fuel via storage in deep geological repositories is an alternative option for the reprocessing of spent fuel in Japan. [Citation1] [Citation2] Within the repository, fuel is stored in waste canisters. Yet, in the event of failure of these canisters and other repository barriers protecting the spent fuel from the environment, groundwater will ingress into the repository and contact the spent fuel. This will lead to the release of radionuclides from the spent fuel into the environment via groundwater [Citation3–5].
The main constituent of spent fuel is UO2 [Citation6], therefore the dissolution of U is a key concern. The rate of dissolution will be affected by the redox conditions within the local environment, which will be determined by the radiation fields at the time of canister failure. On a relatively near time-scale (<103 years) the beta and gamma radiation fields from the spent fuel are high and the redox conditions are governed by radiolysis of the groundwater and the generation of oxidants in solution. The release of U then proceeds via an oxidative dissolution mechanism, where the oxidants generated by radiolysis oxidise UIV to UV and UVI leading to dissolution due to the higher solubility of the oxidised forms of U [Citation7–9]. At longer time-scales (103 − 105 years), the beta and gamma fields decrease and alpha-induced radiolysis will control the oxidative dissolution of U. However, after a threshold amount of time (predicted to be 10,000 to 20,000 years for fuel within a burnup range of 120 to 320 MWh/kgU) [Citation10] the effect of radiation will become negligible, and oxidative dissolution of spent fuel will also become negligible. Therefore, non-radiolysis induced dissolution of UO2 will become the dominant mechanism for U release upon canister failure. As dissolution occurs at the interface between spent fuel and groundwater, it will be determined by the nature of the UO2 surface oxide and the groundwater composition.
Crystalline UO2 has a face centred cubic (fcc, Fmm space group) fluorite-type crystal structure where the sublattice contains eight oxygen ions (O2-) at each point of a cube, and each oxygen atom is enclosed by a tetrahedron of four UIV metal ions. Along with the ability of the U atom to reside in multiple oxidation states (UIV, UV and UVI), the fluorite structure also provides a large number of interstitial sites in the UO2 lattice where additional atoms can reside. Upon oxidation of UO2, the formation of hyper-stoichiometric UO2+x occurs, with oxygen atoms residing as interstitials. At the surface of spent fuel in waste containers, the formation of UO2+x is expected due to oxidation by a combination of radiation, residual moisture and increased temperatures due to decay heat [Citation11]. Therefore, if container failure occurs after the threshold amount of time where oxidative dissolution has become negligible, it will be the interaction of the hyper-stoichiometric UO2+x surface with groundwater that will affect the release of U.
A key component of groundwater is bicarbonate (HCO3−) which is found in varying concentrations depending on the geographical location of the repository (10−4 − 10−2 M) [Citation12–15]. Bicarbonate is known to interact with the surface of UO2 to form U-bicarbonate surface complexes (EquationEquation 1(1)
(1) and Equation2
(2)
(2) ), followed by dissolution of UVI species (EquationEquation 3
(3)
(3) ) [Citation16–19]. The formation of such thermodynamically stable UVI-bicarbonate complexes increases the rate of U dissolution from the oxide. The electrons liberated in EquationEquations 1
(1)
(1) and Equation2
(2)
(2) may be accepted by the UV and UVI ions within the surface UO2+x.
The dissolution of U in bicarbonate solution has previously been studied due to its importance for predictive modelling of waste repositories [Citation17,Citation19–23]. One such study by Kumagai et al [Citation24] showed that the value of x in UO2+x can have a significant effect on the dissolution rate of U from UO2+x. However, the effect of bicarbonate on the UO2+x oxide surface has not been determined, even though the surface oxide is pivotal to dissolution behaviour. In recent studies, Raman spectroscopy has been employed to investigate the surface oxide of uranium compounds due to its sensitivity to different forms of uranium oxide (i.e. UO2 [Citation25], U4O9 [Citation26], U3O7 [Citation27], and U3O8 [Citation28]) whose varying fingerprint spectra allow for phase identification. Alterations to the UO2+x crystal lattice structure due to the ingress of oxygen and the formation of defects has also been investigated by detailed peak analysis of Raman spectra [Citation29–31].
In this study we have utilized Raman spectroscopy to find microscopic chemical changes in the surface of the UO2 oxide induced by exposure to bicarbonate solution. Raman analysis was conducted to investigate the oxygen content and structural defect formation in the UO2+x surface oxide and their dependence on bicarbonate concentration was analysed. This will provide a deeper understanding of the mechanisms of U release from spent fuel for predicting radionuclide release into the environment upon waste canister failure.
2. Experimental
2.1. UO2 pellet manufacture
UO2 pellets were prepared from UO2 powder, pressed at 3.73 t/cm2 for 3 minutes followed by heating at 1600°C for 2 hours under a flow of Ar/10% H2. Pellet diameters were 10 mm with a density of 6.6 g/cm3. Four pellets were prepared with geometric surface areas of 2 × 10⁻⁴ m2. Pellets were confirmed to be UO2 by XRD, and the cubic lattice constant, a, was calculated using Braggs law [Citation32] giving a = 5.46 Å which is typical of UO2 [Citation33,Citation34]. The surface of the pellet was confirmed to be hyper-stoichiometric UO2+x by Raman as discussed later.
2.2. Immersion tests
To investigate the effect of bicarbonate on the UO2 surface, immersion tests were conducted where the UO2 pellets were placed in 0, 10 and 50 mM NaHCO3 solutions. The reducing agent Na2S2O4 (5 mM) was added to solution to maintain a potential ~-300 mV vs SHE. The solution volume was 40 ml and the immersion tests were conducted for 298 days under an Ar atmosphere to ensure equilibrium had been reached. After immersion, the pellets were removed from solution and dried under vacuum prior to Raman analysis. One pellet was not immersed in solution for use as a reference sample.
2.3. Characterization techniques
U concentrations in solution were measured using ICP-AES (Spectro Arcos by SPECTRO) and ICP-MS (Element 2 by Thermo Fischer Scientific), and calibration was conducted using appropriate standards of U in 5 wt.% HNO3 solution. Multiple measurements were taken for each sample giving a relative error < 3%. Optical images of the pellet surfaces were taken with a Keyence VHX-5000 optical microscope with a VHX-Z500T objective lens.
Raman analysis was conducted using an NRS-4500 JASCO (Japan) Raman spectrometer with a 532 nm excitation laser. The laser was introduced through a 100× objective lens with a spatial resolution ~1 μm in the xy-plane and z-axis, and a laser power <1 mW to avoid alteration of the sample by the laser. For surface mapping, Raman spectra were obtained in an 11 × 11 grid with 5 μm spacing between each point at a laser power of 0.5 mW. At each point, 3 spectra were collected over 20 seconds each and averaged giving 121 averaged spectra for each grid. This was repeated at 8 grid positions on the surface of the pellet giving a total of 968 averaged spectra to give a representative sample of each pellet. For obtaining depth profiles of the UO2 pellets, spectra were collected at 0.1 μm intervals in the z-direction through the surface. For each z-coordinate, three spectra were obtained over 10 seconds each, and this was conducted at seven locations on the surface of the pellet and averaged.
3. Results and discussion
3.1. Solution analysis
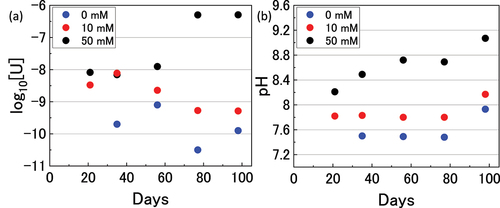
U concentrations over the course of the immersion experiments were analysed and are shown in along with the measured pH values in . The U concentration was significantly higher in 50 mM bicarbonate solution due to favourable complexation as described in EquationEquations 1(1)
(1) -Equation3
(3)
(3) and stabilization of the dissolution products. In 10 mM solution, an initial increase in U was followed by a decrease indicating a degree of reintegration of U into the pellet surface oxide.
Figure 1. (a) the dissolved U concentration and (b) pH during the immersion experiments.
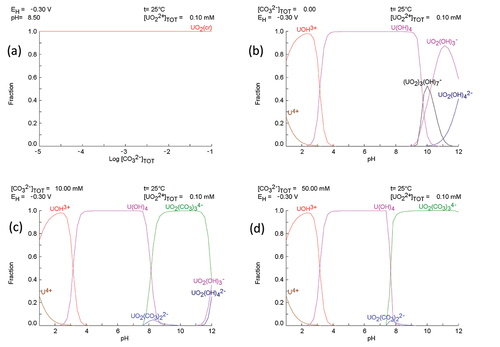
To investigate the form of U during the immersion experiments, speciation calculations were conducted using SPANA software [Citation35], and the reactions included in the calculations are provided in supplementary information. shows that UO2 is the dominant solid phase at all ranges of bicarbonate concentration. show the speciation of U in solution at 0 mM, 10 mM and 50 mM bicarbonate concentrations respectively. In 0 mM (pH 7.5) solution, the dominant U species is the hydroxide form U(OH)4 which explains the low measured concentration of dissolved U as the solubility of UIV is low. In 50 mM (pH 9) U exists as the carbonate species UO2(CO3)34-, whilst at 10 mM (pH 8) there is a mixture of U(OH)4 and UO2(CO3)34-. This may explain the observed dissolved U behaviour in 10 mM solution where initial dissolution occurred due to complexation of UV/VI in the UO2+x oxide with bicarbonate, followed by UO2(CO3)44- reintegration into the UO2 surface oxide via reduction in the reducing conditions.
Figure 2. Speciation calculations for the UVI/bicarbonate system (a) considering solid phases, and considering aqueous speciation in (b) 0 mM, (c) 10 mM, and (d) 50 mM bicarbonate solution.
3.2. UO2 pellet surface analysis
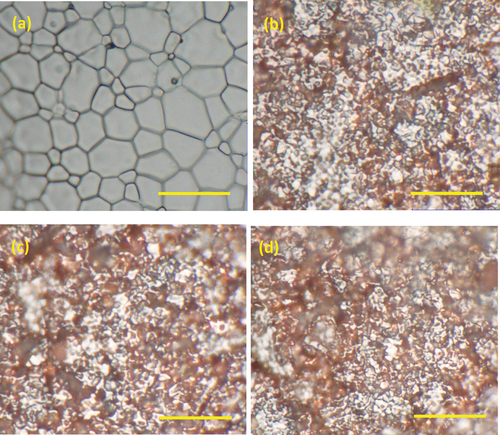
An optical image of the reference pellet surface is provided in , showing grain sizes between 1 and 5 µm. The immersed pellet surfaces in exhibited surface degradation compared to the reference pellet, showing an increased surface roughness due to preferential dissolution at the high energy grain boundaries. No particulate material was observed on the pellet surfaces, indicating that any deposition of particles from solution onto the surface was minimal.
Figure 3. Optical images of the surface of the pellets (a) before immersion, and after immersion in (b) 0 mM, (c) 10 mM and (d) 50 mM bicarbonate solution (5000x magnification, scale bar = 10 µm).
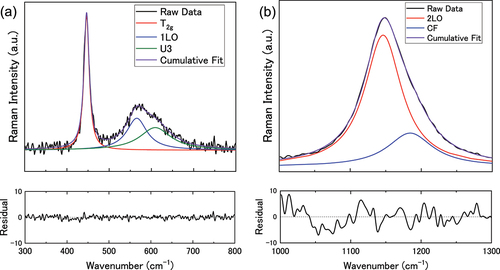
shows the averaged Raman spectra acquired via surface mapping for the immersed UO2 pellets and reference pellet. According to group theory, the perfect fluorite lattice should exhibit two vibrational modes: one triply degenerate Raman active mode (T2 g at ~445 cm−1), and an infrared active mode (T1 u) [Citation27,Citation36]. Therefore, a single peak should be observed at ~445 cm−1. However, the obtained spectra were more complex than this as seen in . Each spectrum exhibited a band between 500–700 cm−1 as well as a large peak at ~1150 cm−1. These Raman forbidden peaks are caused by distortions in the lattice causing a loss of symmetry and a relaxation of the selection rules i.e. UO2+x [Citation31]. The Raman spectra showed no peaks associated with higher uranium oxides involving bulk transformations of the lattice (i.e. to U3O7 and above) and so the oxides can be described as UO2+x where 0 < x < 0.25.
Figure 4. Averaged Raman spectra of the UO2 pellets immersed in NaHCO3 solution acquired by surface mapping.
The so called defect bands between 500–700 cm−1 were deconvoluted along with the T2 g peak with three Lorentzian peaks as shown in , giving peaks at ~445 cm−1, 570 cm−1, and 610 cm−1. The peak at 570 cm−1 has been attributed to the 1LO phonon [Citation37,Citation38], while the peak at 610 cm−1 (assigned as U3) has been attributed to excess oxygen in the sublattice [Citation30,Citation31,Citation39–43]. A defect peak at ~525 cm−1 postulated to be due to UO2-x hypo-stoichiometric sites has been described in the literature [Citation38,Citation42], but was not observed here. There has been some discussion about the peak at 1150 cm−1 which has been described as the 2LO peak by Livneh and Strerer [Citation43] and a crystal field transition by Schoenes [Citation25]. Recently, Elorrieta et al. [Citation44] deconvoluted the peak into both a 2LO and crystal field contribution, and the same treatment has been conducted here (). The 2LO peak showed an enhanced signal which has been attributed to a Raman resonance effect caused by the 532 nm laser. The 532 nm laser excitation energy (2.33 eV) exceeds that of the band absorption edge for UO2 (~2 eV) allowing for electronic transitions that increase the strength of the 2LO signal [Citation43,Citation45].
Figure 5. An example of the Lorentzian band-shaped fit for (a) the T2g peak and defect band, and (b) the 2LO peak.
From the peak deconvolution, the effect of bicarbonate on the oxide lattice can be inspected. The T2 g peak arises from the triply degenerate d-orbitals in the x, y, z planes associated with a U atom in UO2. The U3 peak is related to excess oxygen in the UO2 lattice, and the area ratio of the U3 peak relative to the T2 g peak has previously been used to analyse the extent of oxygen inclusion [Citation30], where the ratio increases with increasing interstitial oxygen. Recently, it has been shown that the ratio between the 2LO and T2 g peak area decreases with increasing numbers of defects which can be used to analyse defect formation in the UO2 lattice [Citation38]. The 2LO phonon derives from vibrations of atoms within a lattice, so a defect in the lattice will reduce the intensity of the phonon, meaning a decrease in the 2LO/T2 g ratio means more defects.
When discussing the effect of lattice defects on the Raman spectra of UO2, it is important to clarify what type of defects are being considered. On the micro-scale, typical imperfections in a lattice can arise from planar defects such as twinning, stacking faults etc. and line defects such as dislocations. Such defects are usually associated with an external stress and are not considered when discussing chemical reactions. Defects on the atomic scale such as interstitials (i.e. oxygen), vacancies, impurity atoms, Frenkel defect pairs etc. can be considered as the cause of the defect peaks in the Raman spectra. Due to the large signals obtained for the T2 g and 2LO peaks and the fact they are sensitive to distortions in the fluorite lattice, these ratios provide a convenient method to investigate the inclusion of defects. Therefore, for this study, the U3/T2 g area ratio and the 2LO/T2 g area ratio after Raman peak deconvolution have been analysed to investigate the effect of bicarbonate on the UO2+x surface oxide.
The ratios of the deconvoluted Raman peaks obtained by surface mapping of the UO2 pellets are shown in . The data points reflect the average values taken from 968 spectra for each sample. The reference pellet showed variance in the data points, particularly for the U3/T2 g peak area ratio, indicating that the surface of the pellets was not homogeneous. The effect of bicarbonate on the surface oxide of the UO2 pellets will be discussed by analyzing the changes in the peak ratios seen in .
Figure 6. (a) the U3/T2g peak area ratio and (b) the 2LO/T2g peak area ratio as a function of bicarbonate concentration. Surface mapping was conducted on 11 x 11 grids at eight locations on the surface of each pellet and averaged.
The U3/T2 g peak area ratio decreased for all the immersed pellets relative to the reference pellet, indicating a reduction in interstitial oxygen in the surface sublattice. This can be explained by the dissolution of UV/VI in the UO2+x surface into solution as seen in , and the reducing conditions of the solution (~-300 mV) inhibiting surface oxidation. Although this trend can be seen in the averaged values of the U3/T2 g peak area ratio, the changes with respect to the reference pellet are within the range of error. Therefore, the reduction in the interstitial oxygen would be slight or insignificant.
The immersed pellet’s 2LO/T2 g peak area ratios decreased relative to the reference pellet showing an increase in defects in the surface oxide. As the amount of interstitial oxygen decreased these defects must not be interstitial oxygen, and are unlikely to be related to any carbonate containing species as the 0 mM solution also showed increased numbers of defects compared to the reference. Rather, the change in the 2LO/T2 g peak area ratios must be related to chemical behaviour of surface U atoms. Preferential dissolution of UV and UVI atoms within the UO2+x oxide would explain the increase in defects as vacancies would form within the lattice upon dissolution.
Based on the Raman peak analysis, solution analysis, and speciation calculations, a pathway for the effect of bicarbonate on the UO2+x surface oxide can be proposed. Initial immersion of the pellet into solution leads to preferential dissolution of the UV/UVI atoms within the surface oxide, generating vacancies with the lattice. In the absence of bicarbonate, the dissolved U exists in the hydroxide form and the dissolution of U is low. In 10 mM bicarbonate solution, the dissolution of U increased due to stabilization of U by complexation with carbonate and UO2(CO3)34- formation. However, formation of UO2 on the surface occurred via reduction of UO2(CO3)34-, which provided protection from further dissolution of UV/UVI due to the low solubility of UIV. In 50 mM bicarbonate solution, the equilibrium between surface UO2 and dissolved UO2(CO3)34- lies further towards dissolution, meaning less protection of the surface and more dissolution of UV/UVI from the lattice leading to a higher defect density. Whilst the degradation of the oxide surface in oxidising conditions has been extensively studied for nuclide release prediction models, these results indicate degradation of the oxide surface in reducing conditions. The degradation at the grain boundaries of the spent fuel leads to increased defects within the surface lattice, increasing the probability of nuclide release into groundwater. The release is promoted by the addition of bicarbonate which complexes with oxidised U atoms in the oxide.
3.3. Depth profile analysis
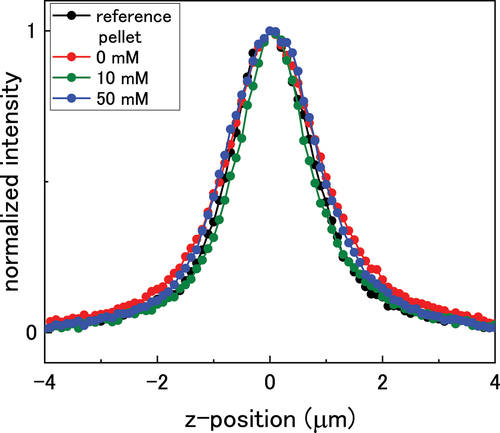
To probe the formation of defects through the oxide, depth profiles of the pellets were taken by obtaining Raman spectra at 0.1 µm intervals through the surface. shows the normalized intensity of the T2 g peak through the oxide. The surface of the pellet was taken as the position of the largest T2 g peak intensity, and this position was set to 0 µm, with positive values indicating penetration into the oxide surface. Peak analysis was conducted up to a depth of 1.5 µm where peak deconvolution was achievable. As the spatial resolution of the laser is ~1 µm in the z-plane, each point on the depth profile represents an average rather than a discrete measurement at the z-position.
Figure 7. Depth profile of the UO2 pellets immersed in bicarbonate solution showing the normalized T2g peak height.
The calculated peak ratios through the oxide are shown in (U3/T2 g) and (2LO/T2 g). Surface mapping showed an inhomogeneous oxide surface. Therefore, the depth profiles for each pellet were not directly compared as profiles were acquired in seven locations on each sample and so may not be representative of the pellet surface. Thus, the depth profiles were normalised against the z = 0 µm values so that the data could be compared.
Figure 8. The normalised U3/T2g peak area ratio as a function of bicarbonate concentration in the z-direction through the oxide.
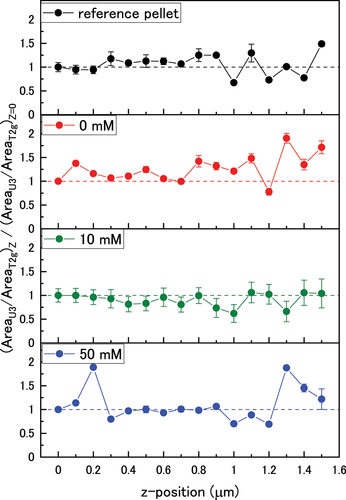
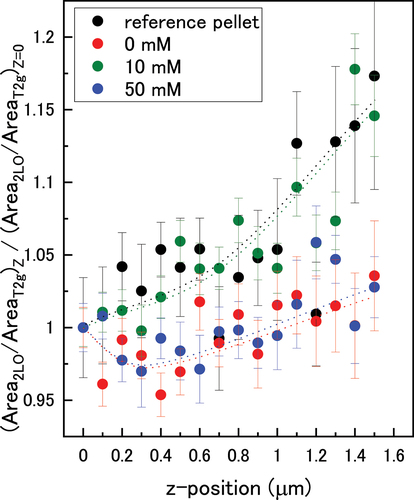
Figure 9. The normalized 2LO/T2g peak height ratios as a function of bicarbonate concentration in the z-direction through the oxide. Dotted lines are a guide for the eye.
The U3/T2 g ratio was relatively constant through the oxide for each pellet and showed no obvious deviation indicating a steady value of x through the UO2+x surface. Under ambient conditions in air, the surface oxidation of UO2 has been shown to form almost homogeneous layers of oxidised material on the UO2 substrate [Citation46,Citation47]. This discrete-layer mechanism of growth suggests that the oxide layer consists of discrete layers that thicken over time, rather than a solid-solution with a continuous increase in excess oxygen through the oxide from 0 in the bulk to x at the surface. The oxidised region forms in discrete layers along an oxidation front driven by the rapid rate of oxygen diffusion along grain boundaries [Citation48]. Therefore, it is probable that the initial UO2+x surface on the pellets formed due to oxidation in air, as the reference pellet showed a constant U3/T2 g value. For the immersed pellets, the constant oxygen content through the surface suggests that any deposition of UO2 resulted in a homogeneous layer, or that surface reduction of UO2+x did not affect the structure of the discrete-layer oxide. Another possible reason is that UVI species precipitated on the sample vial wall and so were not involved in the U3/T2 g calculations.
The normalised 2LO/T2 g peak area ratios are shown in . The 10 mM pellet showed a fast decrease in defects towards the bulk which indicated less dissolution of the oxide during immersion. This is consistent with a slow rate of UO2(CO3)24- reduction as indicated in the dissolved U data. In the 0 mM and 50 mM pellets, a layer of high defect concentration formed up to a thickness of ~0.3 µm, before the number of defects decreased towards the bulk. This was due to low dissolution in 0 mM bicarbonate solution, and suppression of reintegration at the surface by the formation of stable UVI-carbonate species in 50 mM bicarbonate solution as demonstrated in the speciation calculations.
4. Conclusions
Raman surface mapping indicated that the addition of UO2 pellets to solution resulted in alterations to the UO2+x oxide as evidenced by changes in the Raman peak area ratios. Depth profiles showed that the value of x in UO2+x throughout the oxide was relatively constant showing stability of the interstitial oxygen. Defects within the oxide were analysed via the 2LO/T2 g peak area ratio, and were found to increase due to immersion in solution. This was attributed to dissolution of UV/VI atoms in the UO2+x surface oxide and the formation of vacancies in the lattice. Differences between the defect content of the oxide with and without bicarbonate was attributed to the form of U in solution (U(OH)4 and UO2(CO3)34-) and the formation of a protective UO2 surface layer. This study provides a deeper understanding regarding the effect of bicarbonate on UO2+x by showing selective dissolution of UV/VI from the surface oxide.
Supplemental Material
Download MS Word (15.8 KB)Acknowledgments
The authors would like to acknowledge Yuriko Moroi for her efforts in conducting the immersion experiments.
Disclosure statement
No potential conflict of interest was reported by the author(s).
Supplementary material
Supplemental data for this article can be accessed online at https://doi.org/10.1080/00223131.2023.2236104.
Additional information
Funding
References
- Minari E, Okamura T, Nakase M, et al. Evaluation of the technical options of radioactive waste management for utilization of MOX fuel: thermal impact of minor actinide separation with geological disposal of high-level waste. J Nucl Sci Technol. 2021;58(10):1123–1133. doi: 10.1080/00223131.2021.1918590
- Grambow B, Nitta A, Shibata A et al. Ten years after the NPP accident at Fukushima: review on fuel debris behaviour in contact with water. J Nucl Sci Technol. 2022; 59(1):1–24. doi: 10.1080/00223131.2021.1966347
- Sun Y, Wang H, Zhao W. Effect of leaching solutions on chemical durability of a natural metamict titanite. J Nucl Sci Technol. 2020;57(7):792–799. doi: 10.1080/00223131.2020.1724205
- He Y, Lu P, Ye W, et al. Coupled chemo-hydro-mechanical effects on volume change behaviour of compacted bentonite used as buffer/backfill material in high-level radioactive waste repository. J Nucl Sci Technol. 2022;59(10):1207–1231. doi: 10.1080/00223131.2022.2044930
- Terashima M, Endo T, Kimuro S, et al. Iron-induced association between selenium and humic substances in groundwater from deep sedimentary formations. J Nucl Sci Technol. 2023;60(4):374–384. doi: 10.1080/00223131.2022.2111376
- Ikeuchi H, Yano K, Washiya T. Chemical forms of uranium elevated by thermodynamic calculation associated with distribution of core materials in the damaged reactor pressure vessel. J Nucl Sci Technol. 2020;57(6):704–718. doi: 10.1080/00223131.2020.1720844
- Romaniello SJ, Herrmann AD, Anbar AD. Uranium concentrations and 238U/235U isotope ratios in modern carbonates from the Bahamas: assessing a novel paleoredox proxy. Chem Geol. 2013;362:305–316. doi: 10.1016/j.chemgeo.2013.10.002
- Kolodny Y, Torfstein A, Weiss-Sarusi K, et al. 238U-235U-234U fractionation between tetravalent and hexavalent uranium in seafloor phosphorites. Chem Geol. 2017;451:1–8. doi: 10.1016/j.chemgeo.2016.12.032
- Jemison NE, Shiel AE, Johnson TM, et al. Field application of 238U/235U measurements to detect reoxidation and mobilization of U(IV). Environ Sci Technol. 2018;52(6):3422–3430. doi: 10.1021/acs.est.7b05162
- Shoesmith DW. Used fuel and uranium dioxide dissolution studies: a review, NWMO TR-2007-03. 2007.
- Ahn TM. Dry oxidation and fracture of LWR spent fuels, NUREG-1565. Div Waste Manag Off Nucl Mater Saf Safeguards US Nucl Regul Comm. 1996:20555–0001. Washington, DC.
- Fukuda K, Watanabe Y, Murakami H et al. Hydrochemical investigation at the Mizunami underground research laboratory – compilation of groundwater chemistry data in the Mizunami group and the Toki granite. Japanese Atomic Energy Agency. 2020.
- Kim BY, Oh JY, Baik MH et al. Effect of carbonate on the solubility of neptunium in natural granitic groundwater. Nucl Eng Technol. 2010; 42(5):552–561. doi: 10.5516/NET.2010.42.5.552
- Kim SS, Baik MH, Choi JW, et al. The dissolution of ThO2(cr) in carbonate solutions and a granitic groundwater. J Radioanal Nucl Chem. 2010;286(1):91–97. doi: 10.1007/s10967-010-0614-5
- Auque LF, Gimeno MJ, Gomez JB. Groundwater chemistry around a repository for spent nuclear fuel over a glacial cycle. 2006.
- Shoesmith DW. Fuel corrosion processes under waste disposal conditions. J Nucl Mater. 2000;282(1):1–31. doi: 10.1016/S0022-3115(00)00392-5
- Hossain MM, Ekeroth E, Jonsson M. Effects of HCO3− on the kinetics of UO2 oxidation by H2O2. J Nucl Mater. 2006;358(2–39):202–208. doi: 10.1016/j.jnucmat.2006.07.008
- De Pablo J, Casas I, Giménez J, et al. Solid surface evolution model to predict uranium release from unirradiated UO2 and nuclear spent fuel dissolution under oxidizing conditions. J Nucl Mater. 1996;232(2–3):138–145. doi: 10.1016/S0022-3115(96)00439-4
- Röllin S, Spahiu K, Eklund UB. Determination of dissolution rates of spent fuel in carbonate solutions under different redox conditions with a flow-through experiment. J Nucl Mater. 2001;297(3):231–243. doi: 10.1016/S0022-3115(01)00645-6
- De Pablo J, Casas I, Gimenez J et al. The oxidative dissolution mechanism of uranium dioxide. I. The effect of temperature in hydrogen carbonate medium. Geochim Cosmochim Acta. 1999; 63(19–20):3097–3103. doi: 10.1016/S0016-7037(99)00237-9
- Stroes-Gascoyne S, Garisto F, Betteridge JS. The effects of alpha-radiolysis on UO2 dissolution determined from batch experiments with 238Pu-doped UO2. J Nucl Mater. 2005;346(1):5–15. doi: 10.1016/j.jnucmat.2005.04.069
- Goldik JS, Noël JJ, Shoesmith DW. Surface electrochemistry of UO2 in dilute alkaline hydrogen peroxide solutions: Part II. Effects of carbonate ions. Electrochim Acta. 2006;51(16):3278–3286. doi: 10.1016/j.electacta.2005.09.019.
- Shoesmith DW, Kolar M, King F. A mixed-potential model to predict fuel (uranium dioxide) corrosion within a failed nuclear waste container. Corrosion. 2003;59(9):802–816. doi: 10.5006/1.3277609
- Kumagai Y, Barreiro Fidalgo A, Jonsson M. Impact of stoichiometry on the mechanism and kinetics of oxidative dissolution of UO2 induced by H2O2 and γ-irradiation. J Phys Chem C. 2019;123(15):9919–9925. doi: 10.1021/acs.jpcc.9b00862.
- Schoenes J. Recent spectroscopic studies of UO2. J Chem Soc Faraday Trans 2 Mol Chem Phys. 1987;83(7):1205–1213. doi: 10.1039/F29878301205.
- Desgranges L, Baldinozzi G, Simon P, et al. Raman spectrum of U4O9: a new interpretation of damage lines in UO2. J Raman Spectrosc. 2012;43(3):455–458. doi: 10.1002/jrs.3054
- Allen GC, Butler IS, Tuan NA. Characterisation of uranium oxides by micro-Raman spectroscopy. J Nucl Mater. 1987; 144(1–2):17–19. doi: 10.1016/0022-3115(87)90274-1.
- Palacios ML, Taylor SH. Characterization of uranium oxides using in situ micro-raman spectroscopy. Appl Spectrosc. 2000;54(9):1372–1378. doi: 10.1366/0003702001951057.
- Manara D, Renker B. Raman spectra of stoichiometric and hyperstoichiometric uranium dioxide. J Nucl Mater. 2003;321(2–3):233–237. doi: 10.1016/S0022-3115(03)00248-4
- Elorrieta JM, Bonales LJ, Rodríguez-Villagra N et al. A detailed Raman and X-ray study of UO2+x oxides and related structure transitions. Phys Chem Chem Phys. 2016;18(40):28209–28216. doi: 10.1039/c6cp03800j.
- He H, Shoesmith D. Raman spectroscopic studies of defect structures and phase transition in hyper-stoichiometric UO2+x. Phys Chem Chem Phys. 2010;12(28):8108–8117. doi: 10.1039/b925495a
- Bragg PWH, Bragg WL. The reflection of X-rays by crystals. Proc R Soc London Ser A, Contain Pap a Math Phys Character. 1913;17:428–438.
- Alekseyev VA, Anan’yeva LA, Rafal’skiy RP. Effects of composition on lattice parameter of UO2+x. Int Geol Rev. 1981;23(10):1229–1236. doi: 10.1080/00206818109451000
- Lynds L, Young WA, Mohl JS et al. X-ray and density study of nonstoichiometry in uranium oxides. 1963;58–65. doi: 10.1021/ba-1964-0039.ch005
- Spana software. 2023. https://github.com/ignasi-p/eq-diagr
- Schoenes J. Electronic transitions, crystal field effects and phonons in UO2. Phys Rep. 1980;63(6):301–336. doi: 10.1016/0370-1573(80)90158-1
- Ekeroth E, Roth O, Jonsson M. The relative impact of radiolysis products in radiation induced oxidative dissolution of UO2. J Nucl Mater. 2006;355(1–3):38–46. doi: 10.1016/j.jnucmat.2006.04.001
- Rickert K, Prusnick TA, Kimani MM, et al. Assessing UO2 sample quality with μ-Raman spectroscopy. J Nucl Mater. 2019;514:1–11. doi: 10.1016/j.jnucmat.2018.11.009
- Tan BT, Popel AJ, Wilbraham RJ, et al. Surface and electrochemical controls on UO2 dissolution under anoxic conditions. J Nucl Mater. 2019;520:41–55. doi: 10.1016/j.jnucmat.2019.03.047
- Senanayake SD, Rousseau R, Colegrave D et al. The reaction of water on polycrystalline UO2: Pathways to surface and bulk oxidation. Pathways To Surface And Bulk Oxidation. 2005;342(1–3):179–187. doi: 10.1016/j.jnucmat.2005.04.060
- Jégou C, Caraballo R, Peuget S et al. Raman spectroscopy characterization of actinide oxides (U1-yPuy)O2: Resistance to oxidation by the laser beam and examination of defects. J Nucl Mater. 2010;405(3):235–243. doi: 10.1016/j.jnucmat.2010.08.005
- Guimbretière G, Desgranges L, Canizares A et al. Determination of in-depth damaged profile by Raman line scan in a pre-cut He2+ irradiated UO2. Appl Phys Lett. 2012;100(25). doi: 10.1063/1.4729588
- Livneh T, Sterer E. Effect of pressure on the resonant multiphonon Raman scattering in UO2. Phys Rev B - Condens Matter Mater Phys. 2006;73(8):1–9. doi: 10.1103/PhysRevB.73.085118.
- Elorrieta JM, Bonales LJ, Baonza VG et al. Temperature dependence of the Raman spectrum of UO2. J Nucl Mater. 2018;503:191–194. doi: 10.1016/j.jnucmat.2018.03.015
- Sarsfield MJ, Taylor RJ, Puxley C, et al. Raman spectroscopy of plutonium dioxide and related materials. J Nucl Mater. 2012;427(1–3):333–342. doi: 10.1016/j.jnucmat.2012.04.034
- Stubbs JE, Chaka AM, Ilton ES et al. UO2 oxidative corrosion by nonclassical diffusion. Phys Rev Lett. 2015;114(24):1–5. doi: 10.1103/PhysRevLett.114.246103
- Tracy CL, Chen CH, Park S, et al. Measurement of UO2 surface oxidation using grazing-incidence x-ray diffraction: Implications for nuclear forensics. J Nucl Mater. 2018;502:68–75. doi: 10.1016/j.jnucmat.2018.01.052
- McEachern RJ, Taylor P. A review of the oxidation of uranium dioxide at temperatures below 400°C. J Nucl Mater. 1998;254(2–3):87–121. doi: 10.1016/S0022-3115(97)00343-7