
 ?Mathematical formulae have been encoded as MathML and are displayed in this HTML version using MathJax in order to improve their display. Uncheck the box to turn MathJax off. This feature requires Javascript. Click on a formula to zoom.
ABSTRACT
The Japan Atomic Energy Agency has been developing 9Cr-oxide dispersion strengthened (ODS) steel as a fuel cladding material for sodium-cooled fast reactors (SFRs). Previous studies have formulated the creep rupture equation for 650°C–850°C. However, little data have been obtained above 850°C, and no equation has been formulated. This study conducted creep tests to evaluate creep strength at 700°C–1000°C. Two creep test methods, the internal pressure and ring creep tests under development, were used, and the validation of the ring creep test method was conducted. The results showed that 9Cr-ODS steel undergoes almost no strength change due to the matrix’s phase transformation, and a single equation can express a creep rupture strength from 700°C to 1000°C. In validating the ring creep test method, analysis clarified the effect of stress concentration on the specimen. Plastic deformation occurs at high initial stress and may lead to early rupture. The results will be essential for future creep testing and evaluation of neutron-irradiated 9Cr-ODS steel.
1. Introduction
Oxide dispersion strengthened (ODS) steels are used as long-life core materials of advanced energy systems, such as Generation IV and fusion reactors, and are being researched and developed [Citation1–10]. The Japan Atomic Energy Agency (JAEA) has been developing 9Cr-ODS steel as a fuel cladding material for sodium-cooled fast reactors (SFRs), a Generation IV reactor [Citation11–16].
The 9Cr-ODS steel has the main matrix of tempered martensitic phase, which has excellent resistance to irradiation-induced swelling. The high-temperature strength of 9Cr-ODS steel is improved because of the dispersion of oxide particles, which are more thermally stable than carbides and nitrides. Thus, the 9Cr-ODS steel possesses exceptional resistance to swelling, creep rupture, and deformation under high-dose neutron irradiation environments at high temperatures.
In a previous report [Citation17], creep rupture strength data were obtained for 650°C–850°C and 1000°C, whereas the fuel cladding tube’s temperatures in a Japanese SFR design [Citation12,Citation13] are 400°C–700°C for normal operation, 700°C–830°C for transient condition, and > 830°C for accident conditions. Only little data were obtained at temperatures above 850°C, and no data were obtained for 900°C–950°C corresponding to the phase transformation temperature of 9Cr-ODS steel. Note that creep deformation behavior has not been evaluated for the 9Cr-ODS steel cladding tube.
This study systematically evaluated the creep rupture strength and the deformation of a 9Cr-ODS steel cladding tube from 700°C to 1000°C to enhance the reliability in integrity evaluation of the fuel with the 9Cr-ODS steel cladding tube. The creep rupture strength equation and the secondary creep strain rate equation were developed for 9Cr-ODS steel. This study used internal pressure creep and ring creep. The latter is a new technique under development in JAEA for post-irradiation experiments to evaluate the circumferential tube creep behavior more easily than the internal pressure creep test. The study discusses the ring creep test technique’s validity through finite element simulation and comparison of ring creep data with internal pressure creep data.
2. Materials and methods
2.1. Materials
This study used 9Cr-ODS steel (lot MP23) fuel cladding. The detailed manufacturing process of 9Cr-ODS steel fuel cladding was reported in a previous paper [Citation18]. shows the chemical composition and final heat treatment conditions of 9Cr-ODS steel fuel cladding. A previous paper [Citation17] reported that Ac1 and Ac3 of 9Cr-ODS steel (lot MP 23) were 869°C and 963°C, respectively.
Table 1. Chemical compositions (wt%) of material and heat treatment conditions.
2.2. Test methods
Evaluating the cladding’s circumferential creep strength, which is the primary direction of stress loading in actual fuel pins, is crucial. Therefore, this study obtained data using the internal pressure creep test method, which can perform creep tests in conditions close to actual conditions, and the ring creep test method, which is under development. show the test conditions performed using the internal pressure and ring creep test methods, respectively. Although there are some reports on the ring creep test [Citation19–22], it is not a mature test technique. However, the ring creep test has a smaller specimen size than the internal pressure creep test, does not require sealing the specimen, and it is easy to manufacture a specimen. Therefore, there are many advantages, such as saving irradiation space and reducing the amount of radioactive waste in creep tests of neutron-irradiated materials scheduled to be conducted in the future. Hence, JAEA has been working on developing ring creep test techniques. In this study, as part of developing testing techniques, we worked on validating creep rupture and strain data obtained using the ring creep test method.
Table 2. Conditions for the internal pressure creep tests of 9Cr-ODS steel (lot MP23) cladding.
Table 3. Conditions for the ring creep tests of 9Cr-ODS steel (lot MP23) cladding.
2.2.1. Internal pressure creep test method
The internal pressure creep test method uses a fuel cladding specimen cut to a specific length, with plugs at both ends and filled with He gas. shows the shape of the internal pressure creep test specimen. The He gas sealed inside the specimen simulates a fission gas generated as a fission product of the fuel, and the gas is sealed so that a target test stress is generated when the specimen is heated to a predetermined temperature. The following shows how the internal pressure determines the stress applied to the specimens.
Figure 1. (a) Schematic drawing of the internal pressure creep test specimen.
where P is the internal pressure, D is the cladding’s outer diameter, and t is the wall thickness. Substituting the above equations into the von Mises stress equation, the equation for calculating the equivalent stress (σe) from the internal pressure is obtained as follows.
The precise and robust welding of end plugs is required at both ends of the specimen to prevent premature rupture during the test. Standard welding methods, such as tungsten inert gas welding, cause agglomeration and coarsening of finely dispersed oxide particles near the weld zone, reducing the specimens’ end plug strength. Thus, a pressurized resistance welding method was used for welding the specimens’ end plugs. The precise welding method can be found in the reference [Citation23]. Creep data are obtained by heating the specimen in an electric furnace filled with Ar gas to prevent oxidation. The specimen rupture is detected using a He leak detector connected to the electric furnace to detect the He gas leaking into the electric furnace from inside the ruptured specimen. The specimen’s strain was calculated from the average value of the changes in the diameter of 28 points, seven points axially, and four points radially, measured with an LED displacement measuring device after removing the specimen from the electric furnace at regular intervals. shows the measurement point of specimen. Radial measurements were taken every 45° (between A-A’, B-B’, C-C’, and D-D’) while rotating the specimen.
Figure 1. (b) Schematic drawing of the diametral changes measurement points of the internal pressure creep test specimen.
JAEA has obtained creep data primarily up to 750°C using the internal pressure creep test method. By using an electric furnace capable of testing up to 1000°C, internal pressure creep tests were conducted in this study at temperatures between normal operation and transients (700°C–800°C) and at high temperatures that could occur during accidents (850°C–1000°C).
However, the internal pressure creep test is challenging because of the high degree of difficulty in manufacturing the test specimen, including welding the end plug, multiple gas replacements in the specimen during He gas filling, and sealing He gas by laser spot welding. Interrupting the test each time to measure the creep strain is necessary because the in situ strain measurement is challenging.
2.2.2. Ring creep test method
This study used the ring and internal pressure creep tests, as in the previous report [Citation17]. In the ring creep test method, a fuel cladding tube cut into a ring shape is attached to a jig made of Ti – Zr–Mo alloy and loaded with a weight to apply hoop stress to the specimen. shows the specimen’s shape, and shows the jig’s shape. The ring specimen’s gauge length is 2.0 mm and is designed to break when the load is concentrated in this section. The jig has a pair of upper and lower parts with a half-mandrel in the center, and the clearance between the jig and the specimen is narrow (0.1 mm) when the ring specimen is mounted, suppressing the bending stress on the specimen as much as possible. Furthermore, a boron nitride lubricant that can be used at high temperatures is applied between the specimen and the jig to prevent stress concentration due to friction. The ring creep test apparatus was a direct-load type test apparatus with a maximum load capacity of 0.98 kN, and the load accuracy is ± 0.5% of the set value. The heating furnace’s atmosphere is filled with Ar gas at 0.09–0.11 kPa to prevent oxidation of the specimen, as in the internal pressure creep test. When the gas pressure exceeds the range, the solenoid valve releases the gas, and when the gas pressure falls below the range, Ar gas is introduced into the test section from a cylinder connected to the testing machine. This study obtained much creep data using the ring creep test method.
Figure 2. Schematic drawing of the ring creep test specimen.
Figure 3. Schematic drawing of the ring creep rupture test jig.
2.2.3. Secondary creep strain rate evaluation method
This study conducted a secondary creep strain rate evaluation to evaluate the creep properties of 9Cr-ODS steel fuel cladding. In the ring creep test, a linear gauge attached to the testing machine was used to measure the travel of the pull rod connecting the lower side of the specimen jig and the dead-weight load section. This displacement was regarded as the specimen’s strain and was used to calculate the secondary creep strain rate. In the internal pressure creep test, the secondary creep strain rate was calculated from the strains in the specimen measured at regular time intervals (2,000 h). The strains in the specimen measured at the regular intervals were plotted on a graph of strain versus test time, and the slope of the strains from the start of measurement (2,000 h) to the end of the test was regarded as the secondary creep strain rate. However, it is impractical to interrupt the tests to measure diameter change with a short time step because considerable efforts should be devoted to this procedure. Therefore, the diameter change measurements were conducted every 2,000 h. The secondary creep strain rate was evaluated using the measured diameter data for the internal pressure creep specimen ruptured after a long time. However, for the internal pressure creep tests that ruptured at less than 2,000 h, it is impossible to derive the time-dependence data of diameter change; therefore, the secondary creep strain rate was calculated based on the Bailey – Norton law, as in reference [Citation24]. Since the 9Cr-ODS steel is highly strengthened by oxide dispersion strengthening, the secondary creep strain rate is small; the tertiary creep deformation is either very small or does not occur. Consequently, the primary creep deformation becomes dominant, and the creep deformation behavior can be expressed using the Bailey – Norton law [Citation25]. The method for calculating the secondary creep strain rate is described below. The Bailey – Norton equation expressing the creep strain is
where εc is the creep strain, σ is the equivalent stress, n is the stress exponent, t is the time, K(T) is a temperature-dependent parameter, and m is a constant. By differentiating EquationEquation (4)(4)
(4) with time t, the creep strain rate
can be obtained by EquationEquation (5)
(5)
(5) ,
From the relationship between creep rupture strain and time, EquationEquation 6(6)
(6) is derived from EquationEquation (4)
(4)
(4) , and by transforming EquationEquation 6
(6)
(6) , EquationEquation 7
(7)
(7) is obtained,
where εr is the creep rupture strain and tr is the creep rupture time. EquationEquation 8(8)
(8) is derived from EquationEquation 5
(5)
(5) and EquationEquation 7
(7)
(7) ,
If the creep strain rate at a specific time
(α is a constant) is approximately regarded as the secondary creep strain rate
, the secondary creep strain rate can be obtained from EquationEquation 9
(9)
(9) .
In this study, the secondary creep strain rate was calculated by setting α = 0.5 and m = 0.28 based on the fitting results of previous research [Citation25].
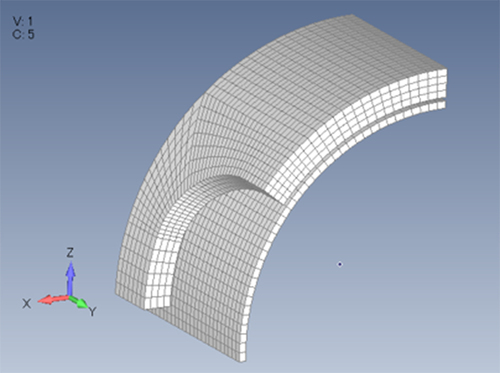
2.2.4. Finite element simulation for the elastic – plastic deformation of the ring creep test
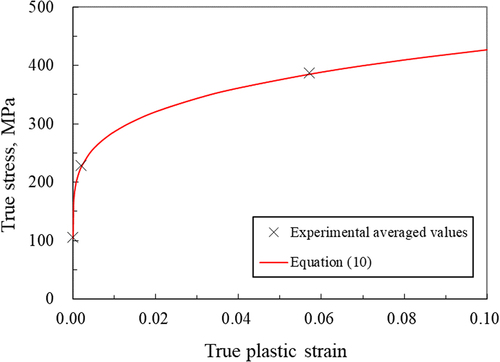
shows a finite element (FE) model constructed for the numerical analysis of the ring creep test. Symmetry conditions enable analysis using an eighth of a three-dimensional (3D) model with appropriate constraints imposed on the symmetry planes. The mandrel of rigid bodies imposed on the ring specimen surface loaded the FE model, and the interaction between the mandrel and the surface of the ring specimen was defined as the contact with the friction coefficient of zero. It has been confirmed that the friction has almost no effect on the stress and strain fields when the friction coefficient is 0.5 or less. A nonlinear FE code, FInite Element Nonlinear Structural Analysis System (FINAS) 20.0, was used, where the yielding condition followed the von Mises yield criterion. In order to calculate the plastic deformation in FE simulation, the true stress – true plastic strain curve was derived based on the experimental tensile data of 9Cr-ODS rods. The tensile tests of 9Cr-ODS rods were performed at 700°C complying JIS G0567. The specimen gauge size was 6 mm in diameter and 30 mm in length. The initial strain rate was 0.3%/min, which was changed to 7.5%/min after yielding. The averaged values of proportional limit, 0.2% proof stress and ultimate tensile stress were 104 ± 14.3 MPa, 227 ± 5.6 MPa and 364 ± 4.8 MPa, respectively. Using Ludwik’s empirical law [Citation26], the experimental tensile curve of 9Cr-ODS rods tested at 700°C was approximated by connecting proportional limit, 0.2% proof stress and ultimate tensile stress converted to true stress as follows:
Figure 4. An eighth 3D finite element (FE) model of the ring creep specimen.
where pl is the true plastic strain. shows the true stress – true plastic strain curve at 700°C obtained from EquationEquation 10(10)
(10) . The true stress – true plastic strain curve was used for the elastic – plastic FE analysis. The thermoelastic properties of Young’s modulus E, Poisson’s ratio, and thermal expansion coefficient at 700°C were 125 GPa, 0.37, and 12.8 × 10⁻⁶/°C, respectively [Citation25].
Figure 5. True stress – true plastic strain curve of 9Cr-ODS steel at 700°C.
3. Results and discussion
3.1. Creep rupture strength of 9Cr-ODS steels
shows the results of the internal pressure creep test of 9Cr-ODS steel obtained in this study as a graph of equivalent stress versus rupture time. The figure also shows the creep rupture equation formulated in [Citation17] for temperatures up to 850°C. All plots for the 850°C are above the creep rupture equation and indicate high strength. This is because the 9Cr-ODS steel used in this paper is a material produced by the latest process and has fewer inclusions acting as fracture initiation sites than the 9Cr-ODS steel used in [Citation17].
Figure 6. (a) Comparison of internal pressure creep test results of 9Cr-ODS steels with creep rupture data of PNC316 and AH4 (a) relationship between equivalent stress and rupture time (b). Relationship between equivalent stress and the Larson – Miller parameter.
For comparison with 9Cr-ODS steel, shows the creep rupture data (700°C, 750°C) of modified type 316 steel (PNC316) fuel cladding previously developed at JAEA [Citation27] and heat-resistant austenitic stainless steel AH4 (900°C, 1000°C) [Citation28]. Compared with the creep test results of PNC316, 9Cr-ODS steel has inferior strength at short times at 700°C and 750°C. However, 9Cr-ODS steel shows superior strength to PNC316 in the low-stress, long-time region where the rupture time exceeds several thousand hours, indicating that 9Cr-ODS steel fuel cladding is suitable for long-time use. The creep test results of AH4 and 9Cr-ODS steel showed that 9Cr-ODS steel has superior creep rupture strength at high temperatures, such as 900°C and 1000°C, which correspond to accident temperatures. These results can be seen from the equivalent stress LMP graph in . Although the 9Cr-ODS steel has lower strength than PNC316 at the low LMP side, which corresponds to low temperature or high stress, the trend curve’s slope is moderate. This result is because 9Cr-ODS steel was strengthened with thermally stable oxide particles and has excellent resistance to deformation due to its high microstructural stability at high temperatures. In other words, oxide particles are densely dispersed in the matrix at the nanoscale pin dislocations and maintain microstructure stability so that the strength does not decrease even when stress is applied for a long time. Also, the 9Cr-ODS steel exhibits superior strength to AH4 on the high LMP side, corresponding to high temperature or low stress. This result is because the oxide particles remain dispersed without agglomeration or coarsening even at temperatures above 900°C, the temperature at which the new data was obtained, and their microstructure is stable. These results indicate that the 9Cr-ODS steel is adequate for extending fuel life and improving fuel failure resistance during accidents.
3.2. Confirmation of ring creep test data
Much internal pressure creep test data has been obtained in previous studies, and the test results’ validity has been verified. However, the ring creep test, a new test technique, lacks verification of the test results’ validity. Therefore, this study verified the ring creep test’s validity by comparing the data obtained from the ring creep test with the data obtained from the internal pressure creep test.
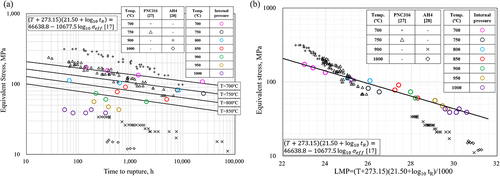
shows the test results obtained at temperatures from 700°C to 1000°C using the internal pressure and ring creep tests. also shows the creep rupture equation for 9Cr-ODS steel up to 850°C shown in [Citation17].
Figure 7. Internal pressure and ring creep test results of 9Cr-ODS steel fuel cladding and the creep rupture equation formulated in a previous report [Citation17].
![Figure 7. Internal pressure and ring creep test results of 9Cr-ODS steel fuel cladding and the creep rupture equation formulated in a previous report [Citation17].](/cms/asset/ce9f1981-467b-40e1-a873-fe8fea3e2cf7/tnst_a_2269178_f0007_oc.jpg)
shows that the ring and internal pressure creep test data trends are consistent with the creep rupture equation, indicating that the difference in creep test results due to differences in testing methods is negligible. However, uniaxial and bending stresses are applied for the ring creep test due to the curvature of the specimen gauge section. Therefore, the stress concentration on the inner surface of the specimen gauge section is concerning. Thus, we conducted an elastoplastic FEA at 700°C to clarify the stress concentration due to bending deformation in the ring creep test.
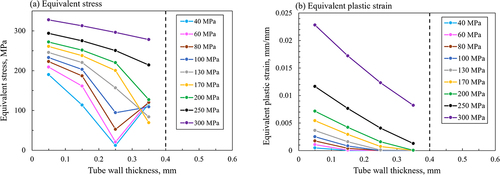
shows contour maps of equivalent stress and plastic strain in the vertical section of the gauge section. The applied stress was 200 MPa. Stress concentration and plastic deformation occur inside the specimen gauge section. Focus on the distribution of stress and plastic strain regarding the thickness direction at the center position of the vertical cross-section of the gauge section. shows the distribution of stress and plastic strain in the thickness direction at the center of the vertical section of the gauge. The applied stresses were 40–300 MPa. Even at a low loading stress of 100 MPa, the inner surface is subjected to a stress level equivalent to a yield stress of approximately 230 MPa. When the applied stress exceeds 200 MPa, plastic deformation also occurs on the outer surface. At 200 MPa, which was conducted in the ring creep tests in this study, the ring ruptured in a shorter time than the creep rupture equation. In the ring creep tests, it was suggested that plastic strain is introduced in the initial stage of stress loading, which affects the creep rupture life when it reaches a non-negligible amount, leading to early rupture. However, shows a slight difference in rupture time between the ring creep and the internal pressure creep where the rupture time exceeds 100 h. Therefore, if creep deformation relieves the stress concentration on the inner surface and the stress gradient in the thickness direction is flattened, the stress concentration effect due to bending deformation can be considered negligible.
Figure 8. Contour maps of (a) equivalent stress, (b) equivalent plastic strain on the horizontal cross-section of the gauge section; the applied stress was 200 MPa.
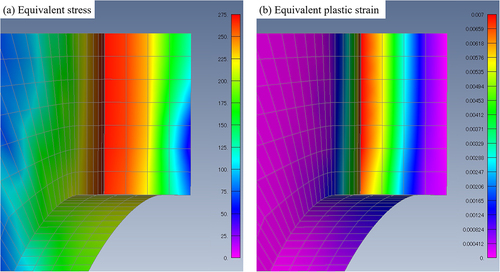
Figure 9. Distribution of (a) equivalent stress, (b) equivalent plastic strain at the center of the horizontal cross-section of the gauge section; the tube wall thicknesses of 0 mm and 0.4 mm were inside and outside the gauge section, respectively.
The creep data obtained in this study is comparable in strength to the creep rupture equation [Citation17] in the short-time region, such as a rupture time of less than 100 h. Therefore, the influence of bending deformation is mitigated, but the possibility that higher stresses than expected are applied cannot be ruled out. Hence, the ring creep test under high-stress conditions might have resulted in a slightly shorter life than initially expected. However, we decided to use the data because it is a conservative evaluation in formulating creep rupture equations. However, since the evaluation of fuel integrity at off-normal conditions also requires a most probable value evaluation, we plan to eliminate the conservatism in the short-time region of the creep rupture equation in the future; for example, by correcting the short-time ring creep data with detailed FEA.
shows that the ring creep test data scattered more than the internal pressure creep test at 900°C and 950°C, corresponding to the temperature range between the Ac1 point (884°C) and the Ac3 point (960°C) of 9Cr-ODS steel (the temperature range where the α/γ 2 phase state occurs). This test revealed that creep rupture life evaluation near the phase transformation point using the ring creep test method has a larger error than other temperature ranges. This result indicates data scatter when the α/γ two-phase state and the stress/strain distribution in the thickness direction are superimposed. The 900°C and 950°C ring creep test results were not used in formulating the creep rupture equation to avoid increasing errors.
3.3. Creep deformation behavior
shows a graph of creep strain vs. test time. The graph also displays the creep strain of SUS316 [Citation29] as a reference. When comparing the strain of SUS316 and 9Cr-ODS steel (internal pressure) at 700°C and 108 MPa, the creep deformation of 9Cr-ODS steel is smaller than that of SUS316 without dispersion strengthening. Furthermore, minimal tertiary creep occurs in the 9Cr-ODS steels, regardless of the creep test method, indicating that nanoscale oxides highly strengthen the 9Cr-ODS steel, suppressing tertiary creep deformation due to microstructural coarsening at the end of the creep phase. This uncommon creep deformation behavior has been reported to occur in other ODS steels at 700°C and 800°C [Citation30–33]. This study revealed that the same creep deformation behavior occurs at extremely high temperatures of 1000°C. Creep deformation mechanism could be explained by a model proposed by Kamikawa and Ukai [Citation34], which is a new creep deformation model for ODS steels with grain boundary sliding in which the rate is controlled via dislocation creep around the grain boundary triple junctions (GBTJs). The local stress in the vicinity of GBTJs exceeds the threshold stress where the stress relaxation due to dislocation creep deformation locally occurs. The rate of this creep deformation mechanism is controlled by dislocation creep (i.e. dislocation climb), but the main creep mechanism is grain boundary sliding.
Figure 10. Comparison of creep strain data of internal pressure and ring creep tests obtained with the creep strain data of SUS316.
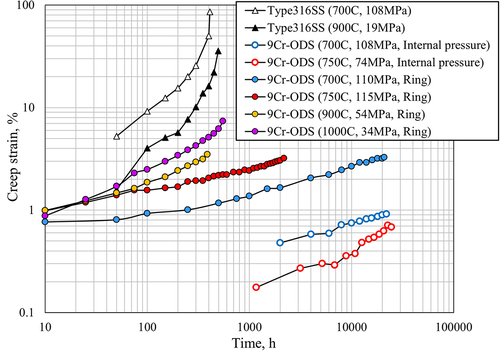
From the creep test results, the 9Cr-ODS steel has high resistance to creep deformation in addition to creep rupture and irradiation-induced swelling. In other words, the fuel assembly using the 9Cr-ODS steel fuel cladding tube has an excellent cooling capacity (resistance to coolant flow blockage by fuel pin deformation).
Furthermore, the creep strain in the ring creep test is larger than that in the internal pressure creep test, e.g. the 700°C and 108 MPa internal pressure creep test vs. the 700°C and 110 MPa ring creep test. In the ring creep test, the specimen’s creep strain is not measured directly, but the movement of the pull rod connecting the jig to the weight load portion. The pull rod is made from a material that does not deform, even at the test temperature, but the difference from the internal pressure creep test is caused by picking up the clearance of the testing machine and the minute elongation of the jig.
Therefore, this study used the internal pressure creep test data to evaluate creep deformation behavior, and the strain data from the ring creep test were treated as a reference value. However, if strain calibration tests are conducted in the ring creep test to remove components other than specimen strain, the strain data from the ring creep test can be used to evaluate the behavior in the same way as the strain data from the internal pressure creep test.
3.4. Optimization of the creep rupture equation
Based on the results of the studies from paragraph 3.1 through 3.3, the data were screened, and the creep rupture equation shown in EquationEquation (11)(11)
(11) below was formulated.
For 50% failure probability (average):
For 5% failure probability:
For 1% failure probability:
where T is the temperature (°C), tR is the rupture time (hour), σeff is the equivalent stress (MPa) and C, A0, and A1 are the constants, S is a common logarithm standard error, and Z is the standard normal distribution.
Based on this study’s results so far, the ring creep test results at 900°C and 950°C were excluded from the data for optimization to prevent an increase in error. Using the LMP and optimizing the constant C using the least-squares method, an equation was formulated to predict the internal pressure and ring creep rupture life from 700°C to 1000°C.
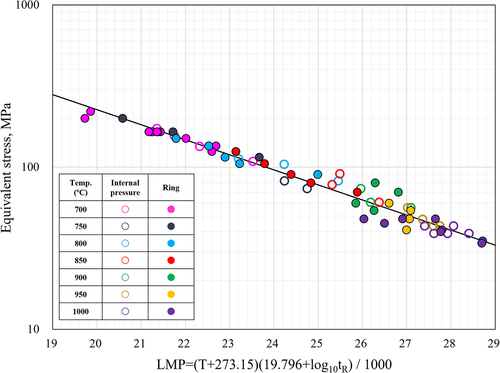
shows EquationEquation 11(11)
(11) and the internal pressure and ring creep test results obtained in this study as a function of the Larson – Miller parameters (LMP). From , the creep rupture equation (EquationEquation 11
(11)
(11) ) can be well regressed over temperatures from 700°C to 1000°C with one creep rupture equation. Although the 900°C and 950°C ring creep data were not used to formulate the LMP equation to prevent an increase in error, they are not too far from the solid line of the LMP and are therefore considered to have some accuracy. The self-diffusion coefficient, which is the controlling factor of creep deformation, differs between phases α and γ. Therefore, creep rupture tendencies were envisioned as different before and after phase transformation, and it is standard to formulate creep rupture equations separately. However, in this evaluation, no change in tendency was observed before and after the phase transformation in 9Cr-ODS steel. This result indicates that oxide particles are stably dispersed even at the phase transformation temperature and that the effect of dispersion strengthening is greater than the effect of changes in the matrix. Consequently, a single equation could be formulated for various temperatures.
Figure 11. Results of internal pressure and ring creep tests obtained; the relationship between equivalent stress and Larson – Miller parameters.
A study was also conducted to formulate the data separately before and after the transformation point. However, no significant difference in rupture life prediction occurred between EquationEquation 11(11)
(11) , which regressed all data from 700°C to 1000°C, and the equation that divided the data separately before and after the transformation point. Therefore, for convenience, EquationEquation 11
(11)
(11) obtained by regressing all temperature data was adopted as the creep rupture equation for 9Cr-ODS steel. However, clarifying the mechanism by which the relationship between creep rupture life and LMP showed no clear change trend before and after phase transformation is crucial to improve the equation’s reliability.
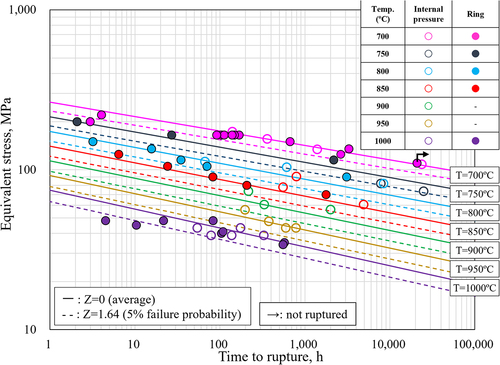
Furthermore, the creep properties of 9Cr-ODS steels have varied. EquationEquation 11(11)
(11) can calculate the creep strength considering these variations by setting Z according to an arbitrary failure probability from the standard normal distribution. shows a graph of equivalent stress vs. creep rupture time for 9Cr-ODS steel. The graph shows the internal pressure-ring creep rupture equation for 9Cr-ODS steel from 700°C to 1000°C, as shown in EquationEquation 11
(11)
(11) . confirms that the test data can be evaluated comprehensively by introducing Z corresponding to the failure probability (for example, Z = 1.64 corresponding to a 5% failure probability) into the creep rupture equation. This study’s creep rupture equation has various applicable temperatures from 700°C to 1000°C and is a helpful formula because it covers several temperatures from normal operation to accidents.
Figure 12. Results of internal pressure and ring creep tests obtained; the relationship between equivalent stress and equivalent stress.
3.5. Feasibility of the Monkman–Grant relationship
An inverse proportional correlation (the Monkman – Grant relationship) is frequently observed between the secondary creep strain rate and the rupture time and has been used as a creep rupture life-prediction method [Citation35–38]. For ODS steels, Wilshire has shown the good feasibility of this relationship for 14Cr-ODS steel (MA957) with an untransformable ferrite matrix [Citation39]. 14Cr-ODS steel (MA957) is a material with a nonrecrystallized structure elongated in the hot extrusion direction.
However, unlike 14Cr-ODS steel (MA957), it was unclear whether the same relationship holds for 9Cr-ODS steel, which has a tempered martensitic matrix. Thus, we evaluated whether the Monkman – Grant relationship holds for 9Cr-ODS steel in this study.
First, to verify the validity of the secondary creep strain rate evaluation based on the Bailey – Norton law, the secondary creep strain rate obtained from strain measured every 2,000 h in the long-term internal pressure creep test at 700°C–850°C was compared with the secondary creep strain rate calculated based on the Bailey – Norton law. shows the measured strain values, the secondary creep strain rate based on the measured strain (dashed line), and the secondary creep strain rate based on the Bailey-Norton law (solid line) for the internal pressure creep tests at (a) 700°C and (b) 750°C. It can be seen from that the calculated secondary creep strain rate agrees with the measured strain-based secondary creep strain rate.
Figure 13. Comparison of calculated secondary creep strain rates with creep strain data measured by internal pressure creep tests in the 9Cr-ODS steel at (a) 700°C, (b) 750°C.
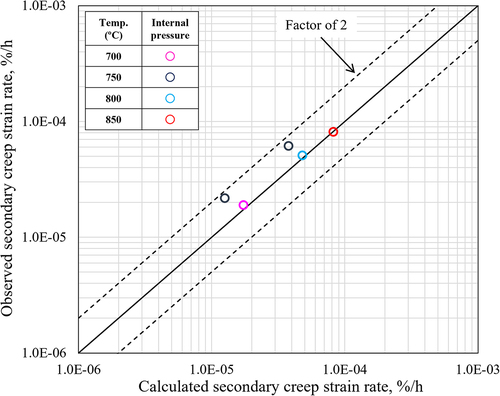
compares the measured and calculated values for the secondary creep strain rate in the long-term internal pressure creep test. Since both are within the range of a factor of 2, the validity of the calculated secondary creep strain rate is high.
Figure 14. Comparison of the measured and calculated values for the secondary creep strain rate in the long-term internal pressure creep test.
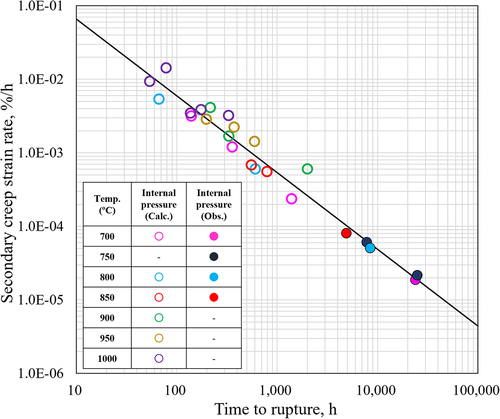
shows the relationship between the secondary creep strain rate and rupture time for the internal pressure creep test. The measured secondary creep strain rate is plotted for the long-time test from 700°C to 850°C, whereas the others are calculated values based on the Bailey – Norton law. The calculated values were adopted in when the measurements could not be done due to the short-time creep test. From , the test data show a linear relationship regardless of temperature, indicating that the Monkman – Grant relationship holds for 9Cr-ODS steel over 700°C–1000°C. Creep damage associated with secondary creep deformation dominates the creep rupture of 9Cr-ODS steel, and the secondary creep strain rate can be predicted with a certain accuracy from the rupture life. The equation obtained from the analysis is shown in EquationEquation (12)(12)
(12) ,
Figure 15. Relationship between the secondary creep strain rate and rupture time for the internal pressure creep test.
where is the secondary creep strain rate (mm/mm/h), tR is the rupture time (h), and T is the temperature (°C). EquationEquation (12)
(12)
(12) formulates the secondary creep strain rate using the Monkman-Grant equation as in EquationEquation (8)
(8)
(8) in [Citation40]. The parameters of EquationEquation (12)
(12)
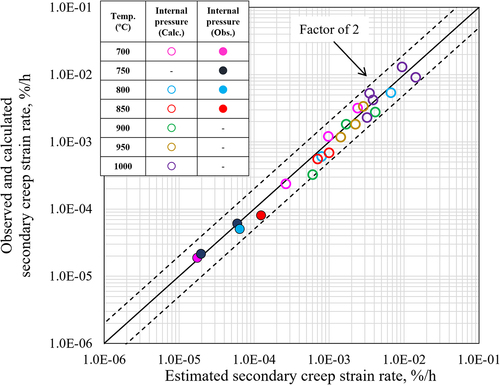
(12) were statistically determined from the secondary creep strain rate, rupture time and test temperature. compares the secondary creep strain rate estimated from EquationEquation (12)
(12)
(12) and the observed and calculated secondary creep strain rate. From , the estimated value from EquationEquation (12)
(12)
(12) falls within a factor of 2 over 700°C–1000°C. Therefore, EquationEquation (12)
(12)
(12) is a reasonable equation for the relationship between secondary creep strain rate and rupture time for 9Cr-ODS steel.
Figure 16. Comparison of the secondary creep strain rate estimated from Equationequation (12)(12)
(12) and the observed and calculated secondary creep strain rate.
4. Conclusions
The creep strength and deformation properties necessary to evaluate fuel integrity during transient accident conditions were obtained by conducting high-temperature creep tests on 9Cr-ODS steel cladding at 700°C–1000°C using internal pressure and ring test methods. The test results can be summarized as follows.
The creep behavior of 9Cr-ODS steel cladding, which should be an accident-resistant cladding for SFRs, was evaluated at 700°C–1000°C. The results showed excellent creep strength and deformation resistance at high temperatures for a long time.
Creep data were obtained systematically from 700°C to 1000°C by the ring creep test. Then, it was confirmed that the ring creep test provided the same creep rupture strength data as the internal pressure creep test.
Creep rupture equations were developed for 9Cr-ODS steel over a wide temperature range, including the phase transformation point. Consequently, it becomes possible to predict the rupture life of 9Cr-ODS steel from 700°C to 1000°C.
The Monkman – Grant relationship holds over a wide temperature range, including the phase transformation temperature in 9Cr-ODS steel. Then, a secondary creep strain rate equation suitable for 9Cr-ODS steel was proposed.
Acknowledgments
The authors would like to express their sincere gratitude to Dr. Tomoyuki Uwaba for his valuable guidance on finite element simulation.
Disclosure statement
No potential conflict of interest was reported by the author(s).
Additional information
Funding
References
- Ukai S, Ohtsuka S, Kaito T, et al. High-temperature strength characterization of advanced 9Cr-ODS ferritic steels. Mater Sci Eng A. 2009;510-511:115–120. doi: 10.1016/j.msea.2008.04.126
- Yoshitake T, Ohmori T, Miyakawa S. Burst properties of irradiated oxide dispersion strengthened ferritic steel claddings. J Nucl Mater. 2002;307-311:788–792. doi: 10.1016/S0022-3115(02)00947-9
- Dubuisson P, Carlan YD, Garat V, et al. ODS ferritic/martensitic alloys for sodium fast reactor fuel pin cladding. J Nucl Mater. 2012;428(1–3):6–12. doi: 10.1016/j.jnucmat.2011.10.037
- Klimiankou M, Lindau R, Möslang A. HRTEM study of yttrium oxide particles in ODS steels for fusion reactor application. J Cryst Growth. 2003;249(1–2):381–387. doi: 10.1016/S0022-0248(02)02134-6
- Luzginova NV, Nolles HS, Pierick PT, et al. Irradiation response of ODS Eurofer97 steel. J Nucl Mater. 2012;428(1–3):192–196. doi: 10.1016/j.jnucmat.2011.08.030
- Ukai S, Nishida T, Okada H, et al. Development of oxide dispersion strengthened ferritic steels for FBR core application, (I) improvement of mechanical properties by recrystallization processing. J Nucl Sci Technol. 1997;34(3):256–263. doi: 10.1080/18811248.1997.9733658
- Kuwabara T, Kurishita H, Ukai S, et al. Superior charpy impact properties of ODS ferritic steel irradiated in JOYO. J Nucl Mater. 1998;258-263:1236–1241. doi: 10.1016/S0022-3115(98)00192-5
- Malaplate J, Mompiou F, Béchade JL, et al. Creep behavior of ODS materials: a study of dislocations/precipitates interactions. J Nucl Mater. 2011;417(1–3):205–208. doi: 10.1016/j.jnucmat.2010.12.059
- Toualbi L, Cayron C, Olier P, et al. Assessment of a new fabrication route for fe–9Cr–1W ODS cladding tubes. J Nucl Mater. 2012;428(1–3):47–53. doi: 10.1016/j.jnucmat.2011.12.013
- Yurechko M, Schroer C, Wedemeyer O et al. Creep-rupture tests on chromium-containing conventional and ODS steels in oxygen-controlled Pb and air at 650 ºC. Nucl Eng Des. 2014;280:686–696. doi: 10.1016/j.nucengdes.2014.06.003
- Japan Atomic Energy Agency. The Japan Atomic Power Company. [Fast reactor cycle technology development project (FaCT project) -phase I report-]. 2011. (JAEA-Evaluation 2011-003) [in Japanese].
- Ichimiya M, Mizuno T, Kotake S. A next generation sodium-cooled fast reactor concept and its R&D program. J Nucl Eng Technol. 2007;39:171–186. doi: 10.5516/NET.2007.39.3.171
- Yamano H, Kubo S, Shimakawa Y et al. Safety design and evaluation in a large-scale Japan sodium-cooled fast reactor. Sci Technol Nucl Inst. 2012;2012:1–14. doi: 10.1155/2012/614973
- Kaito T, Ohtsuka S, Inoue M et al. In-pile creep rupture properties of ODS ferritic steel claddings. J Nucl Mater. 2009;386-388:294–298. doi: 10.1016/j.jnucmat.2008.12.117
- Oka H, Tanno T, Yano Y, et al. Microstructural stability of ODS steel after very long-term creep test. J Nucl Mater. 2021;547:152833. doi: 10.1016/j.jnucmat.2021.152833
- Yamashita S, Yano Y, Ohtsuka S, et al. Irradiation behavior evaluation of oxide dispersion strengthened ferritic steel cladding tubes irradiated in JOYO. J Nucl Mater. 2013;442(1–3):417–424. doi: 10.1016/j.jnucmat.2013.04.051
- Yano Y, Sekio Y, Tanno T, et al. Ultra-high temperature creep rupture and transient burst strength of ODS steel claddings. J Nucl Mater. 2019;516:347–353. doi: 10.1016/j.jnucmat.2019.01.052
- Kaito T, Yano Y, Ohtsuka S, et al. ODS cladding fuel pins irradiation tests using the BOR-60 reactor. J Nucl Sci Technol. 2013;50(4):387–399. doi: 10.1080/00223131.2013.773165
- Seok CS, Bae BK, Koo JM, et al. The properties of the ring and burst creep of ZIRLO cladding. Eng Fail Anal. 2006;13(3):389–397. doi: 10.1016/j.engfailanal.2005.02.009
- Seok CS, Marple B, Song YJ et al. High temperature deformation characteristics of Zirlo™ tubing via ring-creep and burst tests. Nucl Eng Des. 2011;241(3):599–602. doi: 10.1016/j.nucengdes.2010.04.017
- Jaumier T, Vincent S, Vincent L, et al. Creep and damage anisotropies of 9%Cr and 14%Cr ODS steel cladding. J Nucl Mater. 2019;518:274–286. doi: 10.1016/j.jnucmat.2019.02.041
- Ukai S, Kato S, Furukawa T, et al. High-temperature creep deformation in FeCrAl-oxide dispersion strengthened alloy cladding. Mater Sci Eng A. 2020;794:139863. doi: 10.1016/j.msea.2020.139863
- Seki M, Kono S. Development of pressurized resistance welding technology for ODS ferritic steel cladding tube. Trans At Energy Soc Japan. 2004;3(1):95–105. in Japanese. doi: 10.3327/taesj2002.3.95
- Ohtsuka S, Shizukawa Y, Tanno T, et al. High-temperature creep properties of 9Cr-ODS tempered martensitic steel and quantitative correlation with its nanometer-scale structure. J Nucl Sci Technol. 2023;60(3):288–298. doi: 10.1080/00223131.2022.2096147
- Kaito T, Ohtsuka S, Ukai S. [Provisional material properties equation of ODS ferritic steels for BOR-60 irradiation test]. 2002; (JNC TN9400 2002-061) [in Japanese].
- Ludwik P. Elemente der Technologischen Mechanik. Berlin: Julius Springer;1909p 32. in German.
- Ukai S, Mizuta S, Kaito T, et al. In-reactor creep rupture properties of 20% CW modified 316 stainless steel. J Nucl Mater. 2000;278(2–3):320–327. doi: 10.1016/S0022-3115(99)00233-0
- Yamamoto S, Nishiyama Y, Fukumura Y. Heat-resistant Austenitic stainless steel. Nippon Steel & Sumitomo Metal Tech Rep. 2014;106:96–102.
- Morris DG, Harries DR. Creep and rupture in type 316 stainless steel at temperatures between 525 and 900°C part I: creep rate. Met Sci. 1978;12(11):525–531. doi: 10.1179/msc.1978.12.11.525
- Sakasegawa H, Ukai S, Tamura M, et al. Creep constitutive equation of dual phase 9Cr-ODS steel. J Nucl Mater. 2008;373(1–3):82–89. doi: 10.1016/j.jnucmat.2007.05.031
- Ukai S, Ohtsuka S, Kaito T et al. High-temperature strength characterization of advanced 9Cr-ODS ferritic steels. Mater Sci Eng A. 2009;510–511:115–120. doi: 10.1016/j.msea.2008.04.126
- Hayashi T, Sarosi PM, Schneibel JH, et al. Creep response and deformation processes in nanocluster-strengthened ferritic steels. Acta Mater. 2008;56(7):1407–1416. doi: 10.1016/j.actamat.2007.11.038
- Li Y, Nagasaka T, Muroga T, et al. High-temperature mechanical properties and microstructure of 9Cr oxide dispersion strengthened steel compared with RAFMs. Fusion Eng Des. 2011;86(9–11):2495–2499. doi: 10.1016/j.fusengdes.2011.03.004
- Kamikawa R, Ukai S, Kasai S et al. Cooperative grain boundary sliding in creep deformation of FeCrAl-ODS steels at high temperature and low strain rate. J Nucl Mater. 2018;511:591–597. doi: 10.1016/j.jnucmat.2018.04.050
- Monkman FC, Grant NJ. An empirical relationship between rupture life and minimum creep rate in creep-rupture tests. Proc ASTM. 1956;56:593–620.
- Abe F. Creep behavior, deformation mechanisms, and creep life of Mod.9Cr-1Mo steel. Metall Mat Trans A. 2015;46(12):5610–5625. doi: 10.1007/s11661-015-3144-5
- Sundararajan G. The Monkman-Grant relationship. Mater Sci Eng A. 1989;112:205–214. doi: 10.1016/0921-5093(89)90360-2
- Maruyama K. Reliable evaluation of long-term creep properties at elevated temperature. Tetsu-To-Hagané. 2019;105:767–777. in Japanese.
- Wilshire B, Lieu TD. Deformation and damage processes during creep of incoloy MA957. Mater Sci Eng A. 2004;386(1–2):81–90. doi: 10.1016/S0921-5093(04)00969-4
- Yoshitake A, Wada Y, Hirano M. Statistical study of creep rupture and stress strain behavior of structural materials under elevated temperature conditions. Proceedings of International Conference on Creep; Tokyo; 1986. p 441–446.