
ABSTRACT
This study aimed to assess the accuracy of the particle and heavy-ion transport code system (PHITS) for its application of clinical dosimetry in high-energy photon beam therapy. Percentage depth dose (PDD) and beam profiles in a water phantom with various field sizes created by a Clinac 21EX linear accelerator were measured using an ionization chamber. Experimental setups were precisely reproduced by PHITS version 3.24, and the relative percent differences (%Diff) between the measured and calculated data were evaluated. Furthermore, the PHITS results were compared with the corresponding data obtained from the Electron Gamma Shower National Research Council (EGSnrc), including the energy spectra. The average %Diffs obtained from the PHITS and measurements were less than a few percent in most cases, which are lower than the tolerance levels recommended by European Society for Radiotherapy and Oncology Booklet. In the penumbra region of beam profiles, the differences between the calculated and measured distances from the central axis to the 50% dose level were less than 2 mm, which are also within the tolerance level. The %Diffs between the PHITS and EGSnrc were within ± 1% in most cases. These results demonstrate the potential clinical application of the PHITS in high-energy photon beam therapy.
1. Introduction
A Monte Carlo (MC) method is the most accurate method for dose calculation in high-energy photon beam therapy. Various MC codes, such as GEometry ANd Tracking (Geant) [Citation1], MC N-Particle Transport Code (MCNP) [Citation2], and Electron Gamma Shower National Research Council (EGSnrc) [Citation3], have been used for the research of dose evaluation.
The particle and heavy-ion transport code system (PHITS) [Citation4,Citation5] is a general-purpose MC particle transport simulation code developed primarily by the Japan Atomic Energy Agency. PHITS is widely used for research in medical physics because it can simulate the transport of photons, electrons, neutrons, and heavy ions over a wide energy range (from 10−5 eV to 1 TeV). Several researchers recently reported the application of PHITS to simulations in radiotherapy, which were summarized in a study by Furuta and Sato [Citation6]. For example, Yonai et al. [Citation7,Citation8] estimated the organ dose of out-of-field exposure in carbon-ion radiotherapy for prostate cancer treatment, whereas Fujibuchi et al. [Citation8] estimated the neutron distribution and energy spectrum for photonuclear reactions in a medical linear accelerator. Furthermore, Ozaki et al. [Citation9] estimated whole-body radiation exposure from brachytherapy for oral cancer, whereas Hu et al. [Citation10] evaluated PHITS for estimating the dose and relative biological effectiveness in radiobiological studies of boron neutron capture therapy.
In the previous PHITS version 2.67, the transport algorithm for electrons, positrons, and photons used the original PHITS algorithm. However, the dose distribution in water generated a large error compared with the measurements [Citation11]. In PHITS version 2.70 or later, the transport algorithm for photons, electrons, and positrons in EGS version 5 (EGS5) [Citation12] developed by High Energy Accelerator Research Organization (KEK) was incorporated. The comparison of calculation accuracy between EGS5 code system and EGSnrc in high-energy photon beam therapy has already reported by Shimizu et al. [Citation13]. However, the computational accuracy of the EGS5 algorithm incorporated in PHITS could be different from that of the original EGS5 code due to the differences in the tally and variance reduction methods adopted in PHITS and EGS5. Furthermore, PHITS has not been comprehensively investigated yet, particularly for application to the dosimetry of high-energy photon therapy. From these situations in our mind, this study aims to verify the accuracy of PHITS in terms of photon and electron transport and provide essential data for its application in clinical dosimetry in high-energy photon beam therapy.
2. Methods
2.1. Measurements
A Clinac 21EX linear accelerator (Varian Medical Systems, Palo Alto, CA, USA) was used for this study. A radiotherapy treatment planning system requires registering dose distribution data in a homogeneous phantom at various field sizes. The dose distribution data consists of dose ratios along the beam axis and the lateral direction, so-called percentage depth dose (PDD) and beam profile, respectively. Measurements of the PDD and beam profile were performed according to the professional guidelines specified in the dosimetry protocols of the American Association of Physicists in Medicine Task Group (TG)-51 and the International Atomic Energy Agency (IAEA) [Citation14] Technical Reports (TRS)-398 [Citation15]. A three-dimensional water phantom (Blue Phantom, IBA Dosimetry, Schwarzenbruck, Germany) was used. The cylindrical ionization chamber used for the measurements was the CC13 (IBA Dosimetry), with sensitive volume and cavity radius (R) of 0.13 cm3 and 3 mm, respectively. The effective point of measurement (EPOM) for the CC13 was set at 0.6 times R (0.6R, 1.8 mm) upstream from the chamber center.
The PDDs were measured for various field sizes (x [upper jaw] × y [lower jaw]: 3 × 3, 6 × 6, 10 × 10, 20 × 20, 30 × 30, and 40 × 40 cm2) at a source – surface distance of 100 cm (SSD100 cm) on the central axis from 0 to 20 cm water depth (z). The beam profiles were measured on the x-axis at depths of the maximum dose (dmax), 5 cm (d5 cm), 10 cm (d10 cm), and 20 cm (d20 cm) for various field sizes. The scan modes of the PDDs and beam profiles for measurement were step-by-step (step width of 1.0 mm) and continuous (output step width of 1.0 mm), respectively. The scanning data were normalized to the central axis dose at dmax.
2.2. MC simulations: common aspect of the PHITS and EGSnrc
We employed the PHITS version 3.24, released in 2021 [Citation16], and EGSnrc, released in 2020 [Citation17]. Note that the latest version of PHITS is 3.31, but its algorithm of the electro-magnetic transport simulation has not been changed recently as described in the other paper in this special issue [Citation18]. The detailed conditions of the PHITS and EGSnrc simulations are described in Sections 2.2.1 and 2.2.2, respectively. The specifications of the computer used for the MC simulations were as follows: PHITS, CentOS operating system, three AMD EPYC 7351 (16 Core) 2.4 GHz processors and an AMD EPYC 7352 (64 Core) 2.3 GHz processor, EGSnrc; Windows 7 Professional 64-bit operating system, Intel (R) Core (TM) i7–9700 (8 Core) 3.0 GHz processor. The Clinac 21EX linear accelerator gantry head structures of 4 and 10 MV modeled the following major component targets: the primary collimator, beryllium window, flattening filter, secondary collimator, upper jaws, and lower jaws. The modeling was based on a drawing provided by the manufacturer, which showed the position, shape, and material of the gantry head structure. Bremsstrahlung was generated by an electron incident on the target. The other parameters of the MC simulation are presented in Supplementary Table S1.
2.2.1. MC Simulation using PHITS
The PHITS simulation was divided into two parts. In the first step, we simulated the incident electron transport through the target, flattening filter, etc., and generated dump files of 4 MV and 10 MV at the upper edge of the secondary collimator (SSD20.99 cm). The dump file stores physical quantities of particle fluences crossing the surface, such as spatial coordinates, unit vectors of the direction, and energy; it is generated using the surface crossing tally named the [T-cross] section.
In the second step, we simulated the absorbed doses and photon fluences for the calculations of the PDD, beam profile, and energy spectra. A water phantom (x × y × z: 60 × 60 × 60 cm3) was modeled at SSD100 cm. Information regarding each source particle was read from the dump file generated in the first step. These simulations were performed for field sizes of 3 × 3, 6 × 6, 10 × 10, 20 × 20, 30 × 30, and 40 × 40 cm2. The cell importance method, a variance reduction technique that splits a surface-crossing particle into many pieces, was adopted to reduce the statistical uncertainties in the water phantom [Citation16]. The ratio of importance was set to 4.0, which split one particle into four when passing from the air to water phantom.
In this study, the EGS5 mode was selected, and other parameters were set to their default values, except for the cut-off energies of electrons and photons. The number of MC histories for each simulation and other properties are presented in Supplementary Table S2.
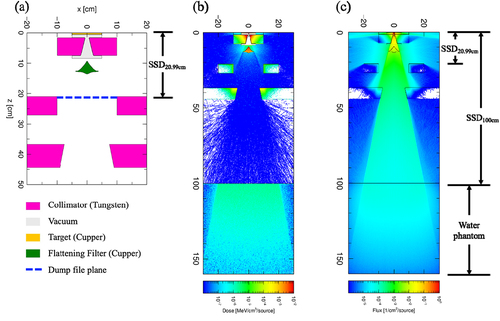
The absorbed doses in the water phantom were deduced from a dose scoring tally named [T-deposit]. The voxel dimensions (x × y × z) for calculating PDDs and beam profiles were set to 1.0 × 1.0 × 0.5 and 0.5 × 1.0 × 1.0 cm3, respectively. The energy spectra of photons on the surface of the water at SSD100 cm were scored using the [T-cross] tally. The output parameter of the [T-cross] tally was set to f-curr, i.e. forward current, to exclude the contributions of backscatters from the water phantom, and its energy resolution was set to 0.02 MeV. The simulation region was filled with air (60 × 60 cm2). shows the sum tally views of the first and second step simulations for the deposition energies (a) and photon fluences (b).
Figure 1. Two-dimensional views of (a) geometry visualization of gantry head structure for 10 MV, (b) deposition energies in the case of percentage depth dose and beam profile simulation, and (c) photon fluences in the case of energy spectra simulation for 10 MV with a field size of 40 × 40 cm2 calculated using the particle and heavy ion transport code system. SSD, source-surface distance.
2.2.2. MC simulations using EGSnrc
The EGSnrc system [Citation17] is a general-purpose MC simulation toolkit that can transport electrons and photons in the energy range of 1 keV–10 GeV. We modeled the same components as PHITS by using BEAMnrc [Citation19]. Cross-sectional data for 700icru.pegs4dat was used in this study. The directional bremsstrahlung splitting (DBS) method was adopted to reduce the statistical uncertainties in the BEAMnrc simulation, in turn reducing the variance [Citation20]. The DBS was set with the following parameters: splitting field radius, 30 cm; bremsstrahlung splitting number, 100; component module for e−/e+ splitting, flattening filter; z of the SSD and rejection plane and Russian roulette plane, bottom of the flattening filter; redistribution of split e−/e+, do not redistribute; and augmented range rejection, off. The phase space file (PSF) at SSD100 cm (PSF100 cm) was generated for each field size. The absorbed dose in water was simulated by DOSXYZnrc [Citation21] using PSFs generated from BEAMnrc. DOSXYZnrc is an EGSnrc-based MC simulation code for calculating the dose distributions in voxel phantoms. The PDDs and beam profile simulations used PSF100 cm. The voxel dimensions of the simulations were set to the same dimensions as in PHITS. A three-dimensional dose file generated by DOSXYZnrc was the output as a dose file using STATDOSE [Citation22]. The energy spectra were simulated using a BEAM Data Processor (BEAMDP) [Citation23] set at PSF100 cm. The simulation settings (i.e. plane, region, and interval of the energy mesh) for calculating the spectra were the same as those described in Section 2.2.1. The number of histories for each simulation and other properties are presented in Supplementary Table S3.
2.3. Comparisons PDDs, beam profiles, and energy spectra between the PHITS and the measurements or EGSnrc
The percentage difference (%Diff) between the PHITS and the measurements or EGSnrc was defined as follows:
%Diff = [(XPHITS – XMeasurement or EGSnrc)/XMeasurement or EGSnrc] × 100(1)
where XPHITS, XEGSnrc, and XMeasurement are the quantities (e.g. absorbed dose in the case of the PDD) obtained from the PHITS and EGSnrc simulations and measurements, respectively. In our study, the %Diffs of PDDs were evaluated and averaged (%Diffave) separately for the build-up region (depth < dmax) and the fall-off region (dmax < depth ≤ d20 cm). Beam profiles were evaluated independently for the plateau region (central area of 80% of the field width) and penumbra region (dose level from 20% to 80%). The %Diffave value was evaluated in the plateau region. Venselaar et al. [Citation24] reported that evaluation in large dose gradient regions, such as the penumbra region, should use the millimeter (mm) shift distance of isodose lines. Millimeter shift was defined as the shift of the 50% isodose lines between the PHITS and the measurements or EGSnrc at a depth of dmax. The evaluated %Diffs and millimeter shift were compared with their recommended criteria of tolerance levels at simple homogeneous geometry reported by European Society for Radiotherapy and Oncology Booklet No. 7 [Citation25], i.e. PDD, ±10% (build-up), ±2% (fall-off); beam profile, ±3% (plateau), ±2 mm (mm shift at penumbra). Furthermore, we compared the energy spectra obtained using PHITS and EGSnrc. The %Diff of the mean energy (Emean) was calculated from the energy spectrum.
3. Results
3.1. PDD curves
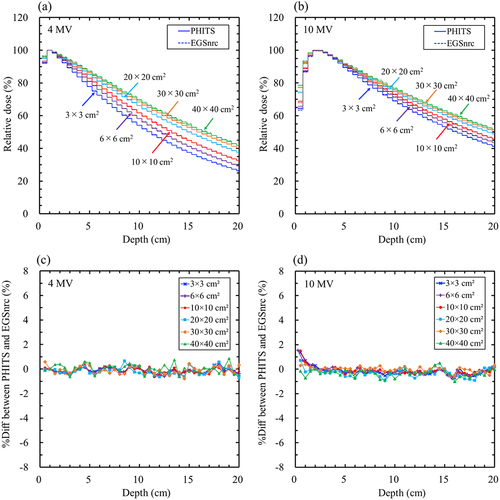
The maximum statistical uncertainties in the MC simulations at dmax for 4 and 10 MV using PHITS were 0.20% and 0.18%, respectively, and those using EGSnrc were 0.29% and 028%, respectively. shows comparisons of the PDD curves (a and b) and %Diff (c and d) between the PHITS and the measurements for 4 and 10 MV. shows that between PHITS and EGSnrc. The %Diff between PHITS and the measurement in the build-up region for 10 MV was greater than that for 4 MV. The maximum %Diff values between PHITS and measurements for 4 MV and 10 MV were − 1.16% and − 6.38%, respectively. The maximum %Diff values were observed at 40 × 40 cm2 (). In contrast, the %Diff between the PHITS and the measurements in the fall-off region for 4 and 10 MV increased with depth (). The maximum %Diff for 4 and 10 MV were − 3.34% and − 2.24%, respectively. The %Diff between PHITS and EGSnrc at 4 and 10 MV was within 2% (). The %Diffave in the build-up and fall-off regions are presented in Supplementary Table S4. The %Diffsave between PHITS and measurement in the build-up and fall-off regions were within − 3.31% and − 1.68%, respectively, which were smaller than the tolerance levels of ± 10% (build-up) and ± 2% (fall-off). The %Diffsave between PHITS and EGSnrc was less than ± 1% in all cases, which was in good agreement.
Figure 2. Comparison of the percentage depth dose curves and percentage local difference (%Diff) between the particle and heavy-ion transport code system (PHITS) and measurements. (a) PHITS (solid lines) and measurements (circles) for 4 MV; (b) PHITS (solid lines) and measurements (circles) for 10 MV; (c) %Diff between PHITS and measurements for 4 MV; (d) %Diff between PHITS and measurements for 10 MV. The maximum statistical uncertainties at the depths of the maximum doses for 4 and 10 MV were 0.20% and 0.18%, respectively.
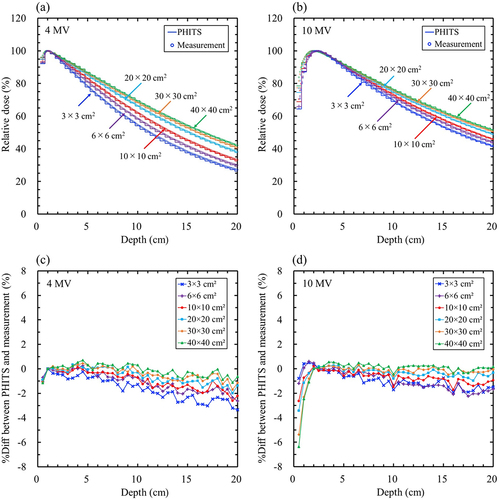
Figure 3. Comparison of the percentage depth dose curves and percentage local difference (%Diff) between the particle and heavy-ion transport code system (PHITS) and electron Gamma Shower National research Council code (EGSnrc). (a) PHITS (solid lines) and EGSnrc (broken lines) for 4 MV; (b) PHITS (solid lines) and EGSnrc (broken lines) for 10 MV; (c) %Diff between PHITS and EGSnrc for 4 MV; (d) %Diff between PHITS and EGSnrc for 10 MV. The maximum statistical uncertainties at the depths of the maximum doses for 4 and 10 MV were 0.29% and 0.28%, respectively.
3.2. Beam profiles
The maximum statistical uncertainties in the MC simulations on the central axis at dmax of 4 and 10 MV using PHITS were 0.21% and 0.20%, respectively, and those using EGSnrc were 0.31% and 0.30%, respectively. show comparisons of the beam profile curves between PHITS, EGSnrc, and measurements for 4 and 10 MV. The %Diffave values in the plateau region are presented in Supplementary Table S5. The %Diffsave between the PHITS and the measurement was within ± 3%, which was smaller than the tolerance level. The %Diffsave of the PHITS tended to increase with smaller field sizes and greater depths. The %Diffsave between PHITS and EGSnrc was less than ± 1% in all cases, which was in good agreement.
Figure 4. Comparison of 4 MV beam profile curves between the particle and heavy-ion transport code system (PHITS), the measurements, and the electron Gamma Shower National research Council code (EGSnrc) for (a) 3 × 3, (b) 6 × 6, (c) 10 × 10, (d) 20 × 20, (e) 30 × 30, and (f) 40 × 40 cm2 field sizes at the depth of the maximum dose (dmax) and at d5 cm, d10 cm, and d20 cm; PHITS (solid lines), measurement (circles), and EGSnrc (broken lines). The maximum statistical uncertainties on the central axis at dmax of PHITS and EGSnrc were 0.21% and 0.31%, respectively.
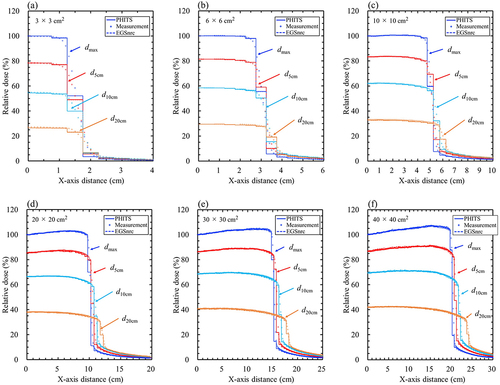
Figure 5. Comparison of 10 MV beam profile curves between the particle and heavy-ion transport code system (PHITS), the measurements, and the electron Gamma Shower National research Council code (EGSnrc) for (a) 3 × 3, (b) 6 × 6, (c) 10 × 10, (d) 20 × 20, (e) 30 × 30, and (f) 40 × 40 cm2 field sizes at the depth of the maximum dose (dmax) and at d5 cm, d10 cm, and d20 cm; PHITS (solid lines), measurement (circles), and EGSnrc (broken lines). The maximum statistical uncertainties on the central axis at dmax of PHITS and EGSnrc were 0.20% and 0.30%, respectively.
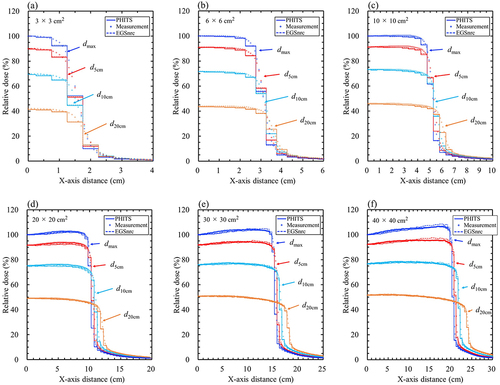
The distances from the central axis to the dose level of the 50% isodose lines and mm shifts are presented in Supplementary Table S6. The distances using the MC method were smaller than those measured. The mm shifts between the PHITS and measured values were within a margin of ±2 mm, which was smaller than the tolerance level. Conversely, the mm shifts between the PHITS and EGSnrc were less than ±0.17 mm in all cases, indicating that these were in agreement.
3.3. Energy spectra
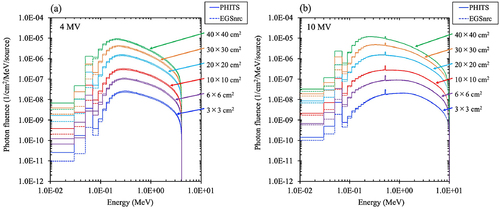
The maximum statistical uncertainties in the energy bins at the maximum fluences for 4 and 10 MV were 0.15% and 0.27% for PHITS, and 0.25% and 0.37% for EGSnrc, respectively. shows the energy spectra at 4 and 10 MV with field sizes of 3 × 3, 6 × 6, 10 × 10, 20 × 20, 30 × 30, and 40 × 40 cm2 at the entrance of the water phantom (SSD100 cm). The photon fluences obtained from PHITS and EGSnrc for both 4 and 10 MV beams were in agreement, except for a slight difference (<0.1 MeV). Supplementary Table S7 shows Emean and percentage differences between PHITS and EGSnrc for 4 and 10 MV for various field sizes. The relative percent differences in Emean between PHITS and EGSnrc were less than 0.34%.
Figure 6. Comparison of (a) 4 MV and (b) 10 MV energy spectra between the particle and heavy-ion transport code system (PHITS) (solid lines) and the electron Gamma Shower National research Council code (EGSnrc) (broken lines) at the surface of the water phantom (source-surface distance of 100 cm). The maximum statistical uncertainties at the energy bins of the maximum counts of PHITS and EGSnrc were 0.15% (4 MV) and 0.27% (10 MV) and 0.25% (4 MV) and 0.37% (10 MV), respectively.
4. Discussion
We compared the PDDs and beam profiles simulated by the PHITS in a homogeneous water phantom with measurements and EGSnrc. The results showed that PHITS could reproduce the measured beam characteristics for 4 and 10 MV. In addition, the PHITS results were in good agreement with the corresponding data obtained from EGSnrc.
The %Diff between the PHITS and measurements in the build-up region of the PDDs increased with the energy and field size. The %Diff for 10 MV was higher than that for 4 MV because the dose gradient in the build-up region of 10 MV was larger than that of 4 MV. The larger %Diff observed in the build-up region for a wider field size may be attributed to the increase in the fluence of low-energy photons below the cut-off energy, which can be transmitted predominantly through the thin part of the flattening filter and increase the doses only near the surface of the water phantom. This tendency is consistent with the decrease in Emean with an increase in field size, as shown in Supplementary Table S7. The discrepancies between the MC simulation and measurements in the build-up region were reported by several researchers [Citation26–28]. The PHITS results were similar to the previous report by Mesbahi et al. [Citation29]; they showed that the difference between MC (MCNP4C and Geant3) simulations and measurements for 6 and 15 MV was − 7%.
The %Diff between the PHITS and measurements in the fall-off region of the PDDs exceeded ± 2%, particularly at deeper locations in the phantom (especially 3 × 3 cm2). This difference can be suppressed by tuning the energy of the incident electrons, as described by Siebers et al. [Citation30]. The importance of initial electron tuning has been shown in previous studies [Citation31,Citation32]. However, the tuning requires a substantial amount of computational time. The PDD for smaller fields is more sensitive to electron energy variations than that for larger fields. Tuning only large fields can result in discrepancies in smaller fields [Citation33]. Concerning the clinical application of the PHITS, it is necessary to tune the initial electrons according to the conditions.
The %Diffave between the PHITS and measurements in the plateau region of the beam profiles increases with a small field size and increased depth. In this study, the incident electron conditions of the MC simulations were based on a dose distribution of 40 × 40 cm2. This tendency implies that fine-tuning the energy and spread of the incident electrons, considering the dose distribution for various field sizes and depths, is essential to precisely reproduce the beam profile and the PDDs. One contributing factor to this difference is the use of a large voxel size relative to the small field size. The voxel size was the same regardless of the field size. Therefore, performing simulations with a higher resolution is necessary to evaluate the small field sizes in detail.
In the penumbra region of the beam profiles, the distances from the central axis to the dose level of the 50% isodose lines of the measurements were wider than those in the MC simulations. This difference is considered to be affected by the EPOM shift of the chamber during the measurement. The distance in the case of 10 × 10 cm2 for 10 MV at dmax, the difference between the theoretical distance with EOPM shift (52.0 mm) and the measurement (52.15 mm) was 0.15 mm, while the difference between the theoretical distance without EPOM shift (51.10 mm) and MC simulations (PHITS, 51.27 mm; EGSnrc, 51.29 mm) was 0.17 mm and 0.19 mm, respectively, these showed similar differences.
In high-energy photon beam therapy above 10 MV, contaminant neutrons are produced by photonuclear reactions between the photon and the head structure of the gantry [Citation33]. The neutron is a risk factor for second cancer induction [Citation34]. One of the advantages of using PHITS compared with EGSnrc is its capability to estimate neutron dose during high-energy photon beam therapy using the photo-nuclear reaction model [Citation35] or data library [Citation36]. Figure S1 illustrates an example of the PDD curve for neutron dose, as determined from our PHITS simulations (normalized by the dose at dmax of PDD for all particles). As shown in the figure, the neutron contributions to the total doses are negligibly small – only up to around 0.001%, but they may not be trivial at the locations far from the irradiation field. In addition, higher energy photon beams above 15 MV have been widely used for radiotherapy in recent years and neutron contaminations are expected to be larger in such radiation fields [Citation37]. Therefore, neutron dosimetry in high-energy photon beam therapy becomes more important, promising the future needs of PHITS in this research area.
5. Conclusion
To comprehensively verify the accuracy of PHITS in high-energy photon beam therapy, we calculated the PDDs and beam profiles for 4 and 10 MV electron linear accelerators by reproducing the irradiation geometry, such as the linear accelerator head structure, the jaw collimators, and the water phantom in PHITS. The simulation results were compared with the corresponding data obtained from the measurements and EGSnrc. It was found from the comparison that the %Diffsave of the PDD and beam profile between the PHITS and experimental results agreed with their tolerance levels. The agreement between the PHITS and EGSnrc calculations was better than the agreement with the measurements, and their %Diffs were within ± 1% in most cases. Excellent agreement was observed between the energy spectra of photons incident on the water phantom calculated by PHITS and EGSnrc, except at very low energies. These findings indicate that PHITS has a potential clinical application in high-energy photon beam therapy, given that its dose calculation accuracy is similar to that of EGSnrc.
Further verification is warranted for more practical irradiation scenarios using human phantoms created from the computed tomography images of patients. The radiotherapy package based on PHITS [Citation38,Citation39], which can convert the Digital Imaging and Communications in Medicine Standard for Radiation Therapy data to a PHITS input file, will play an important role in the verification.
Supplemental Material
Download MS Word (131.8 KB)Acknowledgments
The authors would like to thank Varian Medical Systems for providing drawings of the models of the linear accelerator head structure. The authors are grateful to Shinji Kawamura Ph.D. (Faculty of Radiological Technology, Department of Fukuoka Medical Technology, Teikyo University), Fujio Araki Ph.D. (formerly Faculty of Life Sciences, Department of Health Sciences, Kumamoto University), the members of the EGS research group of the joint study group on South Kyushu Radiation Therapy Technology for their helpful discussion and suggestions on radiation transport analysis. The authors are grateful to Dr. Hideo Hirayama, Dr. Yoshihito Namito, and Dr. Hiroshi Iwase of KEK for their valuable advice on this study.
Disclosure statement
No potential conflict of interest was reported by the author(s).
Supplementary material
Supplemental data for this article can be accessed online at https://doi.org/10.1080/00223131.2023.2275737
Additional information
Funding
References
- Agostinelli S, Allison J, Amako K, et al. Geant4—a simulation toolkit. Nucl Instrum Methods Phys Res A. 2003 July;506(3):250–303. doi: 10.1016/S0168-9002(03)01368-8
- MCNP-A General Monte Carlo N-Particle Transport Code. [Internet]. Los Alamos: Los Alamos National Laboratory; 2000 Dec 18 [cited 2023 Mar 1]. Available from: https://s3.cern.ch/inspire-prod-files-7/78c669e8d3bb59ccf6fb868a6061450c.
- Kawrakow I. Accurate condensed history Monte Carlo simulation of electron transport. I. EGSnrc, the new EGS4 version. Med Phys. 2000 Mar;27(3):485–498. doi: 10.1118/1.598917.
- Sato T, Iwamoto Y, Hashimoto S, et al. Features of particle and heavy ion transport code system (PHITS) version 3.02. J Nucl Sci Technol. 2018 Jan;55(6):684–690. doi: 10.1080/00223131.2017.1419890
- Iwamoto Y, Sato T, Hashimoto S, et al. Benchmark study of the recent version of the PHITS code. J Nucl Sci Technol. 2017;54(5):617–635. doi: 10.1080/00223131.2017.1297742
- Furuta T, Sato T. Medical application of particle and heavy ion transport code system PHITS. Radiol Phys Technol. 2021;14(3):215–225. doi: 10.1007/s12194-021-00628-0
- Yonai S, Matsufuji N, Akahane K. Monte Carlo study of out-of-field exposure in carbon-ion radiotherapy with a passive beam: organ doses in prostate cancer treatment. Phys Med. 2018;51:48–55. doi: 10.1016/j.ejmp.2018.04.391
- Fujibuchi T, Obara S, Sato H, et al. Estimate of Photonuclear Reaction in a Medical Linear Accelerator Using a Water-Equivalent Phantom. Prog Nucl Sci Technol. 2011;2:803–807. doi: 10.15669/pnst.2.803
- Ozaki Y, Watanabe H, Kaida A, et al. Estimation of whole-body radiation exposure from brachytherapy for oral cancer using a Monte Carlo simulation. J Radiat Res. 2017;58(4):523–528. doi: 10.1093/jrr/rrx002
- Hu N, Tanaka H, Takata T, et al. Evaluation of PHITS for microdosimetry in BNCT to support radiobiological research. Appl Radiat Isot. 2020;161:109148. doi: 10.1016/j.apradiso.2020.109148
- Sato T, Furuta T, Hashimoto S, et al. Medical applications of the PHITS code I: recent improvements and biological dose estimation model. Igaku Butsuri. 2015;35(2):180–187. in Japanese.
- The EGS5 code system. [Internet]. Japan: High Energy Accelerator Research Organization (KEK); 2016 Jan 13 [cited 2023 Mar 1]. Available from: https://rcwww.kek.jp/research/egs/egs5_manual/slac730-160113.pdf.
- Shimizu M, Morishita Y, Kato M, et al. Calculation of the characteristics of clinical high-energy photon beams with EGS5-MPI. J Phys Conf Ser. 2014;489(1):012023. doi: 10.1088/1742-6596/489/1/012023
- Almond PR, Biggs PJ, Coursey BM, et al. AAPM’s TG-51 protocol for clinical reference dosimetry of high-energy photon and electron beams. Med Phys. 1999;26(9):1847–1870. doi: 10.1118/1.598691
- Andreo P, Burns DT, Hohlfeld K, et al, editors. International Atomic Energy Agency. Absorbed dose determination in external beam radiotherapy: an International code of practice for dosimetry based on standards of absorbed dose to water. In: Technical reports series. Vol. 398. Vienna, Austria: IAEA; 2000. p. 1–229 .
- PHITS Ver.3.24 User’s Manual. [Internet]. Japan: Japan Atomic Energy Agency; 2021 Mar 26 [cited 2023 Mar 1]. https://phits.jaea.go.jp/manual/manualE-phits324.pdf.
- Kawrakow I, Mainegra-Hing E, Rogers DWO, et al. The EGSnrc code system: Monte Carlo simulation of electron and photon transport. 2020;NRC Report PIRS.701.
- Sato T, Iwamoto Y, Hashimoto S, et al. Recent improvements of the particle and heavy ion transport code system – PHITS version 3.33. J Nucl Sci Technol. doi: 10.1080/00223131.2023.2275736
- Beamnrc users manual. [Internet]. Canada: NRCC; 2023 Feb 16 [cited 2023 Mar 1]. https://nrc-cnrc.github.io/EGSnrc/doc/pirs509a-beamnrc.pdf.
- Kawrakow I, Rogers DW, Walters BR. Large efficiency improvements in BEAMnrc using directional bremsstrahlung splitting. Med Phys. 2004;31(10):2883–2898. doi: 10.1118/1.1788912
- Dosxyznrc users manual. [Internet]. Canada: NRCC; 2023 Feb 16 [cited 2023 Mar 1]. https://nrc-cnrc.github.io/EGSnrc/doc/pirs794-dosxyznrc.pdf.
- STATDOSE for 3D dose distributions. [Internet]. Canada: NRCC; 2023 Feb 16 [cited 2023 Mar 1]. https://nrc-cnrc.github.io/EGSnrc/doc/pirs509f-statdose.pdf.
- BEAMDP as a General-purpose utility. [Internet]. Canada: NRCC; 2023 Feb 16 [cited 2023 Mar 1]. https://nrc-cnrc.github.io/EGSnrc/doc/pirs509c-beamdp.pdf.
- Venselaar J, Welleweerd H, Mijnheer B. Tolerances for the accuracy of photon beam dose calculations of treatment planning systems. Radiother Oncol. 2001;60(2):191–201. doi: 10.1016/S0167-8140(01)00377-2
- Mijnheer B, Olszewska A, Fiorino C, et al. Quality assurance of treatment planning systems - practical examples for non-IMRT photon beams. Brussels, Belgium: ESTRO BOOKLET; 2004. p. 1–104.
- Ding GX. Dose discrepancies between Monte Carlo calculations and measurements in the buildup region for a high-energy photon beam. Med Phys. 2002;29(11):2459–2463. doi: 10.1118/1.1514237
- Abdel-Rahman W, Seuntjens JP, Verhaegen F, et al. Validation of Monte Carlo calculated surface doses for megavoltage photon beams. Med Phys. 2005;32(1):286–298. doi: 10.1118/1.1829401
- Kawrakow I. On the effective point of measurement in megavoltage photon beams. Med Phys. 2006;33(6):1829–1839. doi: 10.1118/1.2201147
- Mesbahi A, Fix M, Allahverdi M, et al. Monte Carlo calculation of Varian 2300C/D linac photon beam characteristics: a comparison between MCNP4C, GEANT3 and measurements. Appl Radiat Isot. 2005;62(3):469–477. doi: 10.1016/j.apradiso.2004.07.008
- Siebers JV, Keall PJ, Libby B, et al. Comparison of EGS4 and MCNP4b Monte Carlo codes for generation of photon phase space distributions for a Varian 2100C. Phys Med Biol. 1999;44(12):3009–3026. doi: 10.1088/0031-9155/44/12/311
- Keall PJ, Siebers JV, Libby B, et al. Determining the incident electron fluence for Monte Carlo-based photon treatment planning using a standard measured data set. Med Phys. 2003;30(4):574–582. doi: 10.1118/1.1561623
- Chibani O, Moftah B, Ma CM. On Monte Carlo modeling of megavoltage photon beams: a revisited study on the sensitivity of beam parameters. Med Phys. 2011;38(1):188–201. doi: 10.1118/1.3523625
- Konefal A, Polaczek-Grelik K, Zipper W. Undesirable nuclear reactions and induced radioactivity as a result of the use of the high-energy therapeutic beams generated by medical linacs. Radiat Prot Dosimetry. 2008;128(2):133–145. doi: 10.1093/rpd/ncm318
- Expósito MR, Sánchez-Nieto B, Terrón JA, et al. Neutron contamination in radiotherapy: estimation of second cancers based on measurements in 1377 patients. Radiother Oncol. 2013;107(2):234–241. doi: 10.1016/j.radonc.2013.03.011
- Noda S, Hashimoto S. Sato T et al. Improvement of photonuclear reaction model below 140 MeV in the PHITS code. J Nucl Sci Technol. 2015;52(1):57–62.
- Iwamoto N, Kosako K, Fukahori T. JENDL photonuclear data file 2016. J Nucl Sci Technol. 2023;60(8):911–922. doi: 10.1080/00223131.2022.2161657
- Dowlatabadi H, Mowlavi AA, Ghorbani M, et al. Study of photoneutron production for the 18 MV photon beam of the Siemens Medical linac by Monte Carlo simulation. J Biomed Phys Eng. 2020;10(6):679–690. doi: 10.31661/jbpe.v0i0.939
- Sato T, Furuta T, Liu Y, et al. Individual dosimetry system for targeted alpha therapy based on PHITS coupled with microdosimetric kinetic model. EJNMMI Phys. 2021;8(1):4. doi: 10.1186/s40658-020-00350-7
- Furuta T, Koba Y, Hashimoto S, et al. Development of the DICOM-based Monte Carlo dose reconstruction system for a retrospective study on the secondary cancer risk in carbon ion radiotherapy. Phys Med Biol. 2022;67(14):145002. doi: 10.1088/1361-6560/ac7998