 ?Mathematical formulae have been encoded as MathML and are displayed in this HTML version using MathJax in order to improve their display. Uncheck the box to turn MathJax off. This feature requires Javascript. Click on a formula to zoom.
ABSTRACT
The neutron capture cross sections and capture -ray spectra of 74,76,78,80,82Se were measured in a region from 15 to 100 keV and around 550 keV. A neutron time-of-flight method was used with a ns-pulsed neutron source based on the 7Li(p,n)7Be reaction and a large anti-Compton NaI(Tl)
-ray spectrometer. A pulse-height weighting technique was applied to the observed
-ray pulse-height spectra to obtain capture yields. The capture cross sections of 74,76,78,80Se were derived with uncertainties from 4.0 to 5.5% and those of 82Se were derived with uncertainties of 6.5–27% by using the standard capture cross sections of 197Au. The present results of 78,82Se were the first experimental ones above the resolved resonance region. The present results were compared with previous measurements and the evaluated values in JENDL-5.0 and ENDF/B-VIII.0. The evaluations of JENDL-5.0 differ from the present results of 74,76,78,80Se and 82Se by 0.9–51% and 6.9–120%, respectively. The capture
-ray spectra of 74,76,78,80,82Se were derived by unfolding the observed capture
-ray pulse-height spectra. The present results were the first experimental ones in the keV region.
1. Introduction
The nuclear transmutation of long-lived fission products (LLFPs: 79Se, 93Zr, 99Tc, 107Pd, 126Sn, 129I, 135Cs, etc.) is one of key issues in the utilization of nuclear fission energy systems [Citation1]. In this situation, the neutron capture cross sections of LLFPs play a very important role in the R&D of the nuclear transmutation systems that utilize neutron capture reactions, because the cross sections directly affect the transmutation performances of systems.
However, the present status of capture cross-section data of LLFPs is very poor both in quality and quantity, because it is difficult to prepare enough of a high-purity sample to make the capture cross-section measurement possible. Moreover, the radiation background from the sample itself is sometimes severe in the measurement, even though the sample preparation is made.
Concerning the stable isotopes corresponding to each LLFP, some of them are also produced in fission reactors. Therefore, the neutron capture cross sections of those stable isotopes are also important for the R&D of transmutation systems without isotope separation, because LLFPs are accompanied by those stable isotopes when LLFPs are loaded into a transmutation system without isotope separation.
Moreover, the keV-neutron capture cross sections and capture -ray spectra of the stable isotopes corresponding to an LLFP contain important information on physical quantities such as
-ray strength functions and nuclear level densities, and the information will contribute to the theoretical calculation of keV-neutron capture cross sections of the LLFP.
From the viewpoints described above, we are trying to measure the keV-neutron capture cross sections and -ray spectra of LLFPs and their stable isotopes. So far, we have finished the direct measurements for 99Tc [Citation2] and 129I [Citation3]. As for 93Zr and 126Sn, we have finished the measurements for their stable isotopes, 90,91,92,94Zr [Citation4,Citation5] and 116,117,118,119,120,122,124Sn [Citation6,Citation7], respectively.
Concerning 79Se, which is one of the most important LLFPs [Citation1] and has a half-life of 2.95105 years [Citation8], there is no experimental data in the whole neutron energy region, and the sample preparation is practically impossible at the moment. As for stable Se isotopes, i.e. 74,76,77,78,80,82Se, the present status of the keV-neutron capture cross section date are poor: there are two data sets and one Maxwellian averaged cross section for 74Se [Citation9–11], only one Maxwellian averaged cross section for 76Se [Citation12], no data sets for 77Se, no data sets for 78Se, three data sets for 80Se [Citation13–15] and no data sets for 82Se, and there exists discrepancy among the data sets. Therefore, we have carried out a systematic measurement of keV-neutron capture cross sections and
-ray spectra of all stable Se isotopes. The cumulative fission yields of 77,78,80,82Se are comparable to that of 79Se [Citation16], although those of 74,76Se are very small. The keV-neutron capture cross sections and capture
-ray spectra of 77Se have been reported [Citation17]. The present paper describes the results of 74,76,78,80,82Se.
2. Experimental procedure
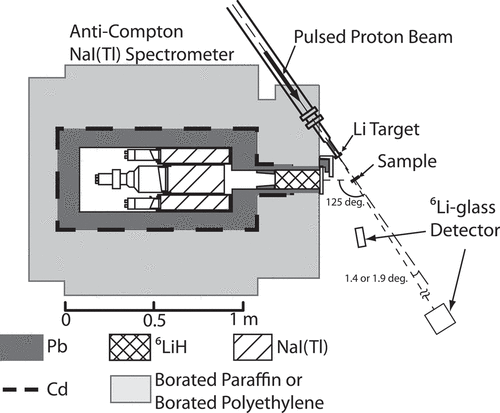
Since the experimental procedure has been described in detail elsewhere [Citation18], it will be explained briefly here. The capture cross sections and capture -ray spectra of 74,76,78,80,82Se were measured in a neutron energy region from 15 to 100 keV and at around 550 keV (552 keV for 74Se, 545 keV for 76Se, 541 keV for 78Se, 542 keV for 80Se, and 544 keV for 82Se), using the 3 MV Pelletron accelerator at the Tokyo Institute of Technology. shows the experimental setup in the 550 keV measurement.
Pulsed keV neutrons were produced by the 7Li(p,n)7Be reaction with a pulsed proton beam (1.5 ns width, 4 MHz repetition rate) from the Pelletron accelerator. The incident neutron energy spectrum on a capture sample was measured by using a time-of-flight (TOF) method with a 6Li-glass scintillation detector. A small 6Li-glass detector (diameter of 5.0 mm and thickness of 5.0 mm) located 30 cm from the 7Li neutron-generation target was used in the 15–100 keV measurement, and a large 6Li-glass detector (diameter of 102 mm and thickness of 6.4 mm) at 455 cm from the neutron source was used in the 550 keV measurements. The small 6Li-glass detector was placed at the average angle of 2.4° or 3.2° and the large 6Li-glass detector was placed at 1.4° or 1.9° with respect to the proton beam direction to observe an average energy spectrum of incident neutrons on the capture sample. The small detector was used also in the 550 keV measurements to monitor the neutron production, as shown in , where the small detector was placed at an angle of about 30°.
Each of 74,76,78,80,82Se samples with a weight of about 1–3 g was made from isotopically enriched metal powder. The 74,76,78,80Se powder was formed into a compact under a uniaxial pressure of 5.0 MPa, followed by a cold isostatic pressure of 200 MPa. The compact was sealed by a Mylar film with a thickness of 15 m. On the other hand, the 82Se powder was formed into a compact under a uniaxial pressure of 5.0 MPa. The compact was contained in a graphite case with an inner radius of 20 mm. A gold(197Au) sample was used as a capture cross-section standard. shows the characteristics of the samples.
Table 1. Characteristics of samples.
The capture sample was placed at right angles to the proton beam direction. The distance between the neutron source and the capture sample was adjusted to 12.0 cm in the 15–100 keV measurement and 20.0 cm in the 550 keV measurements from the consideration of the small amount of Se sample and the neutron TOF. The capture rays emitted from the sample were measured with a large anti-Compton NaI(Tl) spectrometer using a TOF method. The main NaI(Tl) detector of the spectrometer had a diameter of 15.2 cm and a length of 30.5 cm [Citation5]. The detector was centered in a hollow Compton-suppression NaI(Tl) detector with an outer diameter of 33.0 cm and a length of 35.6 cm. The spectrometer was surrounded by a heavy shield which was composed of borated paraffin, borated polyethylene, cadmium, 6LiH, and potassium-free lead [Citation19]. The capture
rays were observed at an angle of 125° with respect to the proton beam direction [Citation18]. The signals from the spectrometer were accumulated event by event as two-parameter list data of pulse height (PH) and TOF with a data acquisition system and stored in a personal computer for offline data analysis.
The measurements with the Se sample, the 197Au sample, and no sample (blank run) were carried out cyclically to average out fluctuations in experimental conditions such as the incident neutron spectrum and the proton beam current. The proton beam currents and the measuring times are summarized in . The measuring time of 114 hours for the blank run in the 550 keV measurements was the sum of the measuring times of the blank runs for the 74,76,78,80Se samples. The summed blank data were used for the data processing, described below, because the experimental conditions were assumed to be equivalent in 74,76,78,80Se measurement at around 550 keV neutron energy region. As for the blank runs for the 82Se sample, the measuring time of 121 hours for the blank run in the 550 keV measurements was the sum of the measuring times of the blank runs for the 74,76,78,80,82Se samples. The measuring time for the blank run in the 550 keV measurement was spent more than that for the 74,76,78,80,82Se sample run, because the time-dependent background described below was determined from the data obtained from the blank run.
Table 2. Average proton beam currents and measuring times.
3. Data processing
The data processing has also been described in detail elsewhere [Citation18], so it will be explained briefly here.
3.1. Incident neutron spectra
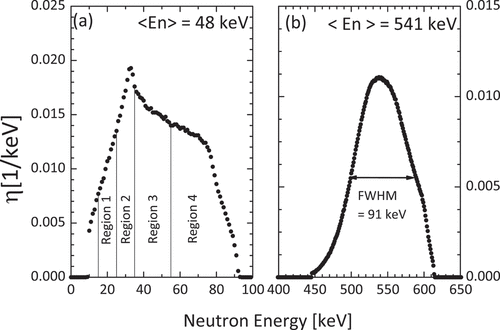
The incident neutron energy spectra on the capture sample were derived from the TOF spectra measured with the small and large 6Li-glass scintillation detector for the blank run. shows the incident neutron energy spectra in the 78Se measurement, , where
stands for the incident neutron energy in the laboratory system. Each spectrum in is normalized so that the integration of spectrum with respect to
is equal to unity. The regions 1–4 in correspond to the neutron energy regions where the capture cross sections were derived. As for the 82Se measurement in the 15–100 keV neutron energy region, different gates were adopted, as described below, because of the resonance structure of the TOF spectrum of capture
rays. The neutron spectra in the 74,76,80,82Se measurements were similar to those shown in
Figure 2. Incident neutron energy spectra, , in the (a) 15–100 keV and (b) 550 keV measurements for 78Se.
indicates an average neutron energy in the laboratory system, see EquationEq. (3)
(3)
(3) .
3.2. Net capture 
 -ray Pulse-Height Spectra
show the TOF spectra measured with the -ray spectrometer for the (a) 78Se, (b) 197Au, and (c) blank runs in the 15–100 keV and 550 keV measurements, respectively.
Figure 3. TOF spectra measured with the -ray spectrometer for the (a)78Se, (b)197Au, and (c) blank runs in the 15–100 keV measurement. Regions 1–4 in the figure correspond to those in .
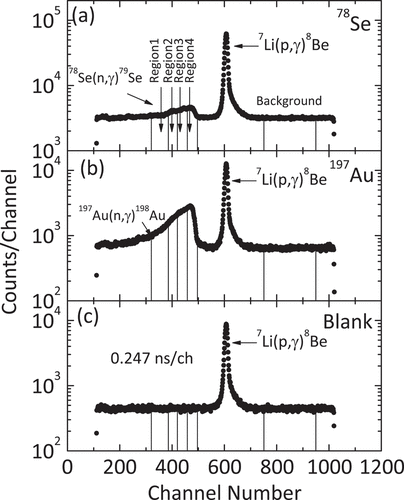
Figure 4. TOF spectra measured with the -ray spectrometer for the (a)78Se, (b)197Au, and (c) blank runs in the 550 keV measurements.
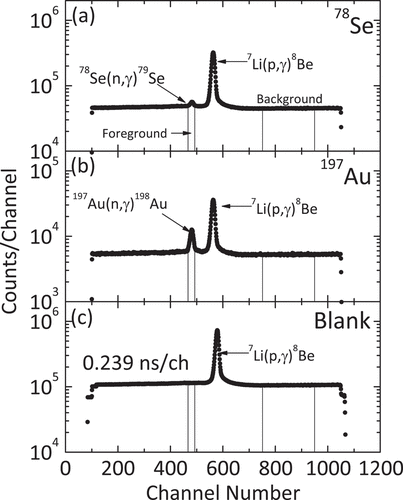
The broad peak below 500 ch. in ) is due to the neutron capture rays from the 78Se or 197Au sample, respectively. The sharp peak around 600 ch. in ) is caused by the
rays from the 7Li(p,
)8Be reaction in the neutron production target. We set four regions in the foreground area and one region in the background area, as shown in , to obtain the foreground and background PH spectra from the data of the 78Se run. Then, net capture
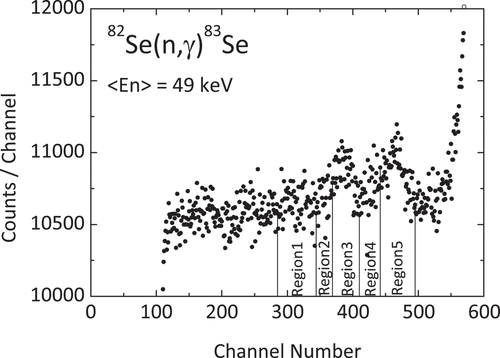
-ray PH spectra were obtained by subtracting the background PH spectra normalized with the ratios of the region widths from the foreground PH spectra [Citation18]. As for the 82Se measurement in the neutron energy region from 15 to 100 keV, the foreground area was divided into five regions because of the resonance structure in the foreground area, as shown in .
Figure 5. Expansion view of TOF spectrum measured with the -ray spectrometer for the 82Se in the 15–100 keV measurement. Resonance structures were observed in this spectrum.
The peak around 480 ch. in or (b) is due to the neutron capture -rays from the 78Se or 197Au sample, respectively. The background in the foreground area in the 550 keV measurements was classified into four components [Citation18]. The time-independent components were evaluated from the data of the 78Se run and the time-dependent ones were evaluated from the data of the blank run. After subtracting those background components, the net capture
-ray PH spectra were obtained.
shows the obtained net capture -ray PH spectra of 78Se. The energy calibration was carried out, using the standard
-ray sources, i.e. 137Cs, 22Na, 60Co, and the background
rays observed in the measurements, i.e. 40K: 1.461 MeV, 56Fe(
)57Fe: 7.638 MeV (weighted average of 7.631 and 7.646 MeV
rays). Constant extrapolation below 0.60 MeV was made for these PH spectra, as shown in by referring to average counts around 2.5 MeV. As for the 82Se measurement, the net capture
-ray PH spectra with (considerably) large statistical fluctuation were obtained, as shown in .
3.3. Capture cross sections
To obtain the capture yields of the individual samples, a PH weighting technique [Citation20] was applied to the net capture -ray PH spectra as follows:
where is the capture yield for region
of sample
,
is the corresponding net PH spectrum,
is the channel number,
is the neutron binding energy of sample nuclide
,
is the weighting function of the
-ray spectrometer with the correction of
-ray transportation in sample
, and
is an average incident neutron energy for region
of sample
in the center of mass system. The average energy was defined as follows:
where is the mass number of sample
and
is an average incident neutron energy for region
in the laboratory system. Here the average energy in the laboratory system was defined as follows:
where ,
are the high- and low-energy boundaries of region
, respectively.
On the other hand, using the number of incident neutrons for region
of sample
, the capture yield was expressed as follows:
where is the number of sample nuclei per barn and
is an average neutron capture cross section for region
of sample nuclide
. The average capture cross-section was defined as follows:
where is the capture cross section of sample nuclide
.
Therefore, the number of incident neutrons in the 197Au run was determined by the capture yield of 197Au and the average capture cross section of 197Au, which was obtained from the standard capture cross sections of JENDL-5.0 [Citation21]. Then, the number of incident neutrons for each region in the Se run was obtained from that in the 197Au run and the neutron monitor counts of the 6Li-glass detector [Citation18].
Finally, the average neutron capture cross-section of Se was derived from the number of incident neutrons and the capture yield for each region in the Se run as follows:
The effects of meta-stable states and/or conversion electron process in the residual nucleus (75,77,79,81,83Se or 198Au) to the capture cross sections derived above should be estimated, because all the excitation energy of capture state is assumed to be promptly released by -ray emission. In the case of 198Au, a meta-stable state exists at 0.812 MeV and has a half-life of 2.30 d [Citation22]. However, its production cross sections by neutron capture reaction are less than about 0.1% of total neutron capture cross sections in the keV region [Citation23]. Therefore, its effect on the derived capture cross sections is thought to be negligibly small. As for 75,77,79,81,83Se, meta-stable states and/or meaningful conversion electron processes have not been reported.
3.4. Capture γ-ray spectra
The capture -ray spectra were derived by unfolding the net capture
-ray PH spectra with the computer code, FERDOR [Citation24], and the response matrix of the
-ray spectrometer [Citation5]. Then, each
-ray spectrum was normalized with the following equation:
where is the
-ray energy and
is the capture
-ray spectrum for region
of sample
. Due to the above normalization, the unit of the present
-ray spectrum is ‘
Rays/MeV/Capture’ and the integration of the
-ray spectrum with respect to
gives the
-ray multiplicity of the capture reaction.
3.5. Corrections and uncertainties
The dead time corrections were small (<0.3%), because the count rates of the -ray spectrometer and the 6Li-glass neutron detectors were less than about 500 cps.
The extrapolation of the net capture -ray PH spectrum below the discrimination level (0.60 MeV) was required for the application of the PH weighting technique. The contributions of the extrapolation regions to the capture yields were 2.3–7.0% and 2.4–8.0% in the 15–100 keV and 550 keV measurements, respectively. In this correction, 30% of the contributions were estimated to be the uncertainties from the sensitivity of the correction factor to various extrapolation methods [Citation6,Citation7].
The correction for the neutron self-shielding and multiple scattering in each sample was carried out with a Monte Carlo method [Citation25], taking account of the isotopic and chemical impurities in each sample. The nuclear data used in the Monte Carlo calculation were taken from JENDL-5.0 [Citation26]. shows the calculated correction factors, where C is the correction factor, defined as the product of the self-shielding correction factor, Cns, and the multiple-scattering correction factor Cnm.
Table 3. Correction factors for the self-shielding and multiple scattering of neutrons in the sample.
The neutron cross sections employed in the calculation had uncertainties. Therefore, 10% [Citation5,Citation18] of the corrections were estimated to be the uncertainties from the sensitivity of the correction factor to the variation of the employed cross sections. The resultant uncertainties were 0.5 to 1.5%.
The -ray scattering and absorption in the sample were taken into account in obtaining the weighting function of the
-ray spectrometer. The weighting function for each sample was obtained from the response functions of the
-ray spectrometer that were calculated for each sample by using a Monte Carlo code [Citation27]. The uncertainty of the weighting function, which was caused by those of response functions and that of a trial function [Citation18] for the weighting function, was estimated to be 4 to 6% [Citation18]. However, since the weighting function appears in both the denominator and numerator of the right-hand side of EquationEq.(6)
(6)
(6) , the contribution of its uncertainty to the capture cross section was about 1%.
The correction for the capture yields due to the chemical and isotopic impurities in the 74,76,78,80,82Se samples was made by using the evaluated capture cross sections of JENDL-5.0 [Citation26]. The corrections for the chemical impurities were less than 0.04%, and those for the isotopic impurities were 0.004–1.5% for 74,76,78,80Se. As for 82Se, the corrections due to the chemical impurities were 0.1–7.3% and those for the isotopic impurities were 0.46–1.6%. These small corrections were due to the high purity of the 74,76,78,80,82Se samples, as shown in . In these corrections, there is no information about the uncertainties of the capture cross sections in JENDL-5.0. Therefore, 20% of the corrections were a priori assumed to be the correction uncertainties.
In addition, the following were taken into account for the uncertainties of capture cross sections: the uncertainties due to the standard capture cross sections of 197Au (3% in the 15–100 keV measurement and 3.5% in the 550 keV measurement) [Citation21] and the number of target nuclei (0.2%).
The uncertainties mentioned above for the derived capture cross sections are summarized in , together with statistical uncertainties. The total uncertainty was obtained as the square root of the sum of squares of individual uncertainties.
Table 4. Statistical and systematic uncertainties.
As for the uncertainties of the capture -ray spectrum, the statistical uncertainties of the input PH spectrum were taken into account.
4. Results and discussion
4.1. Capture cross sections
The capture cross sections of 74,76,78,80Se were derived with uncertainties of 4.0–5.5% and those of 82Se were derived with the uncertainties of 6.5–27% in the incident neutron energy region from 15 to 100 keV and at around 550 keV. The derived capture cross sections of 74,76,78,80,82Se are shown in and compared with previous measurements and the evaluated values of JENDL-5.0 [Citation26] and ENDF/B-VIII.0 [Citation28] in . The average neutron energies and the average capture cross sections in are those defined by EquationEqs (3)(3)
(3) and (Equation5
(5)
(5) ), respectively. In , the present results are plotted at the average neutron energies, and the horizontal bars show the neutron energy regions in . The evaluated values of JENDL-5.0 [Citation26] and ENDF/B-VIII.0 [Citation28] are averaged ones with appropriate energy widths for easy comparison with the present results.
Figure 8. Neutron capture cross sections of 74Se in the keV region. The horizontal bars show the energy region in .
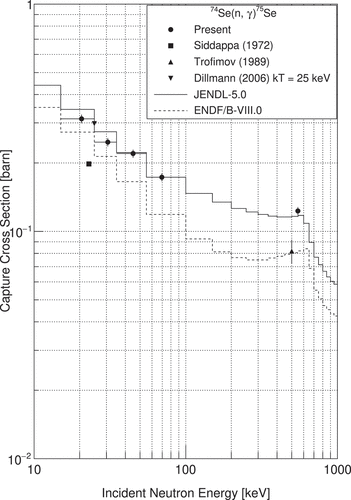
Figure 9. Neutron capture cross sections of 76Se in the keV region. The horizontal bars show the energy region in .
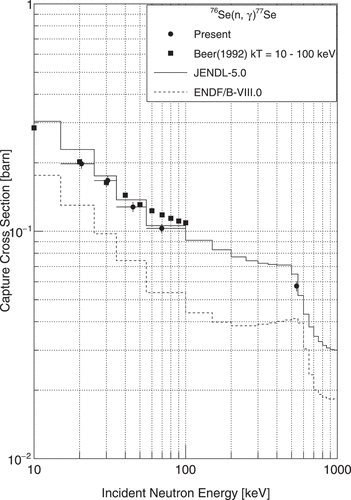
Figure 10. Neutron capture cross sections of 78Se in the keV region. The horizontal bars show the energy region in .
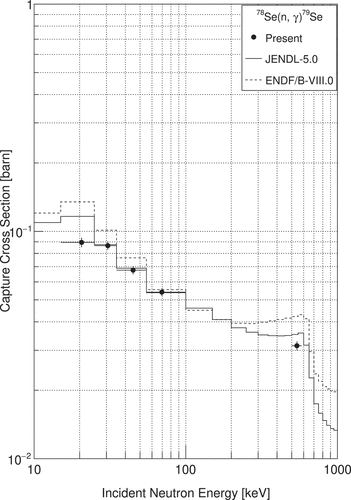
Figure 11. Neutron capture cross sections of 80Se in the keV region. The horizontal bars show the energy region in .
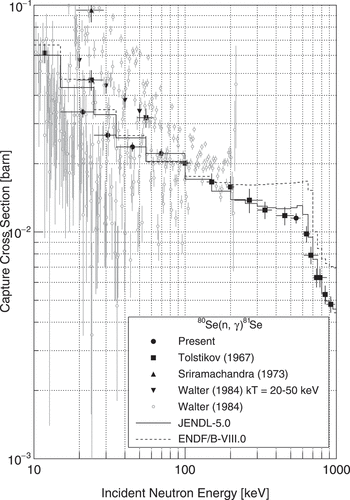
Table 5. Derived neutron capture cross sections of 74.Se.
Table 6. Derived neutron capture cross sections of 76.Se.
Table 7. Derived neutron capture cross sections of 78.Se.
Table 8. Derived capture cross sections of 80.Se.
Table 9. Derived neutron capture cross sections of 82.Se.
Figure 12. Neutron capture cross sections of 80Se in the keV region. The horizontal bars show the energy region in .
4.1.1. 74Se
The capture cross sections of 74Se were derived with uncertainties of 4.0–4.6% in the energy region of 15–100 keV and at 552 keV, as shown in and . The present results of 74Se are the first measurements as a function of neutron energy and are compared with the previous measurements [Citation9–11] and evaluations of JENDL-5.0 [Citation29] and ENDF/B-VIII.0 [Citation30] in . All the previous measurements were performed with neutron activation methods. Siddappa et al. [Citation9] measured the capture cross section at 255 keV, using an Sb-Be neutron source with activities of 20 Ci(740 GBq). Their 74Se result is smaller than the present one by 40%. Trofimov [Citation10] et al. measured the capture cross section at around 500 keV using a p-T neutron source with a Van de Graaff accelerator. Their result is smaller than the present one around 550 keV by 20%. Dillmann et al. measured a Maxwellian averaged cross section at kT = 25 keV using a 7Li(p,n)7Be neutron source. Their result is in good agreement with the present results around 25 keV.
In the evaluation of JENDL-5.0 for the capture cross sections of 74Se, a statistical model calculation with a coupled-channel optical potential was performed, and the -ray strength function was adjusted to reproduce the present ones. The evaluations of JENDL-5.0 have larger than present results by 0.96–11% in the region from 15 to 55 keV, but smaller than present ones by 0.01% and smaller than present ones by 5.4% at 552 keV. The ENDF/B-VIII.0 adopted the values of JENDL-3.3 [Citation31,Citation32] in the unresolved and continuous regions. In the evaluation of JENDL-3.3 for the capture cross sections of 74Se, a statistical model calculation with a spherical optical potential was performed, and the
-ray strength function was adjusted to reproduce capture cross section of 198 mb at 25 keV measured by Sriramachandra et al. (Siddappa et al.). Comparing the evaluated values of JENDL-3.3 with the present results, the evaluated values are smaller than the present results by 13–31% in the region from 15 to 100 keV, and by about 34% at 552 keV.
4.1.2. 76Se
The capture cross sections of 76Se were derived with uncertainties of 4.6–5.1% in the energy region of 15–100 keV and at 545 keV, as shown in and . The present results are compared with a previous measurement and evaluations of JENDL-5.0 [Citation33] and ENDF/B-VIII.0 [Citation34] in . Beer et al. [Citation12] measured Maxwellian cross sections in the region of kT = 10–100 keV using a 7Li(p,n)7Be neutron source and two C6D6 scintillation counters for capture -ray detection. Their result is in agreement with the present ones up to 50 keV within the uncertainty.
In the evaluation of JENDL-5.0 for the capture cross sections of 76Se, a statistical model calculation with a coupled-channel optical potential was performed, and the -ray strength function was adjusted to reproduce the present ones. The evaluations of JENDL-5.0 are larger than the present results by 2.8–16% in the region from 15 to 100 keV, and by about 13% at around 545 keV. Since the ENDF/B-VIII.0 adopted the values of JENDL-3.3 [Citation35] in the unresolved and continuous regions, the evaluated values of ENDF/B-VIII.0 are identical to those of JENDL-3.3. In the evaluation of JENDL-3.3 for the capture cross sections of 76Se, a statistical model calculation with a spherical optical potential was performed, and the
-ray strength function was assumed to be 1.59
10−4. Comparing the evaluated values of JENDL-3.3 with the present results, the evaluated values are smaller than the present results by 34–48% in the region from 15 to 100 keV, and by about 30% at around 545 keV.
4.1.3. 78Se
The capture cross sections of 78Se were derived with uncertainties of 4.1–4.7% in the energy region of 15–100 keV and at 541 keV, as shown in and . As mentioned before, no previous measurements can be compared with the present results. The evaluations of JENDL-5.0 [Citation36] and ENDF/B-VIII.0 [Citation37] are compared with the present results in .
In the evaluation of JENDL-5.0 for the capture cross sections of 78Se, a statistical model calculation with a coupled-channel optical potential was performed, and the -ray strength function was adjusted to reproduce the present results. The evaluations of JENDL-5.0 are larger than the present ones by 0.9–30% in the region from 15 to 55 keV, but smaller than 0.7% in the region from 55 to 100 keV, and larger than the present one by 12% at 541 keV. Since the ENDF/B-VIII.0 adopted the values of JENDL-3.3 [Citation38] in the unresolved and continuous regions, the evaluated values of ENDF/B-VIII.0 are identical to those of JENDL-3.3. In the evaluation of JENDL-3.3 for the capture cross sections of 78Se, a statistical model calculation with a spherical optical potential was performed, and the
-ray strength function was determined from the average radiation width (0.23 eV) and the average spacing (1390 eV) of s-wave neutron resonances which were based on the evaluation of Mughabghab et al. [Citation39]. Comparing the evaluations of JENDL-3.3 are larger than present results by 2.5–51% in the region from 15 to 100 keV and larger than present on by about 34% at around 541 keV.
4.1.4. 80Se
The capture cross sections of 80Se were derived with uncertainties of 4.3–5.5% in the energy region of 15 to 100 keV and at 542 keV, as shown in and , are compared in with previous measurements [Citation13–15] and evaluations of JENDL-5.0 [Citation40] and ENDF/B-VIII.0 [Citation41] in . There are relatively more previous measurements than other Se isotopes because the appropriate half-life(18.45 min) of the residual nuclide 81Se makes it easier to apply an activation method to the capture cross-section measurement. Tolstikov et al. [Citation13], and Sriramachandra Murty et al. [Citation14] adopted neutron activation methods. Their result is smaller than the present ones by a factor of two. Tolstikov et al. [Citation13] measured the capture cross sections in the energy region from 11 keV to 3 MeV using a p-T neutron source with a Van de Graaff accelerator. Their results are larger than the present ones in the energy region from 15–55 keV by 40–60%, but in agreement with the present ones in the energy region from 55–100 keV and at around 550 keV. Sriramachandra et al. [Citation14] measured the capture cross sections at 25 keV using an Sb-Be neutron source. Their result is larger than the present ones by a factor of two. Walter et al. [Citation15] measured the capture cross sections in the energy region of 3–220 keV with a 7Li(p,n)7Be neutron source and a pair of C6D6 scintillation counters by means of a TOF method. Their results have fluctuations due to the resonance structure. Therefore, for easy comparison, their measurements are averaged in each energy region of present data processing, as shown in . Consequently, their measurements are larger than the present ones by 3–45%.
In the evaluation of JENDL-5.0 for the capture cross sections of 80Se, a statistical model calculation with a coupled-channel optical potential was performed, and the -ray strength function was adjusted to reproduce the present results. The evaluations of JENDL-5.0 are larger than the present ones by 9.7–28% in the region from 15–55 keV, but smaller than the present one by 7.8%, but larger than the present one by 11% at around 542 keV. Since the ENDF/B-VIII.0 adopted the values of JENDL-3.3 [Citation42] in the unresolved and continuous regions, the evaluated values of ENDF/B-VIII.0 are identical to those of JENDL-3.3. In the evaluation of JENDL-3.3 for the capture cross sections of 80Se, a statistical model calculation with a spherical optical potential was performed, and the
-ray strength function was adjusted to reproduce the capture cross section of 16 mb at 200 keV measured by Walter et al. [Citation15]. The evaluations of JENDL-3.3 are larger than present results by 12–39% in the region from 15 to 55 keV, but smaller than present one in the region from 55 to 100 keV by 8.5%, but larger than present by 43% at around 542 keV.
4.1.5. 82Se
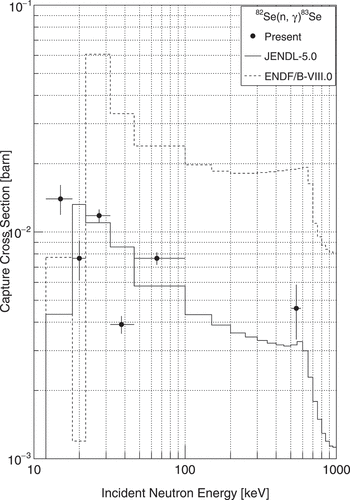
The capture cross sections of 82Se were derived with uncertainties of 6.3–27% in the energy region of 12–100 keV and at 544 keV, as shown in and . The present results are the first measurements in the keV region. Therefore, no previous measurements are to be compared with the present results. The evaluations of JENDL-5.0 [Citation43] and ENDF/B-VIII.0 [Citation44] are compared with the present results in . The present results have large fluctuations due to the resonance structure in .
In the evaluation of JENDL-5.0 for the capture cross sections of 82Se, a statistical model calculation with a coupled-channel optical potential was performed, and the -ray strength function was adjusted to reproduce the present results. The evaluations of JENDL-5.0 are smaller than the present results by 69% in the region from 12 to 18 keV, but larger than the present one in the region from 18 to 22 keV by 73%, and smaller than the present one by about 6.9% in the region from 22 to 32 keV, but larger than present one by 120% in the region from 32 to 46 keV, and smaller than the present one by 25%, and smaller than the present one by 31% at 544 keV. Since the ENDF/B-VIII.0 adopted the values of JENDL-3.3 [Citation45] in the unresolved and continuous regions, the evaluated values of ENDF/B-VIII.0 are identical to those of JENDL-3.3. In the evaluation of JENDL-3.3 for the capture cross sections of 82Se, a statistical model calculation with a spherical optical potential was performed, and the
-ray strength function was adjusted to reproduce the capture cross section of 0.045 b at 25 keV which was a somewhat larger value than a meta-stable state production cross section of 0.045 b at 24 keV measured by Chaubey et al. [Citation46]. The evaluations of JENDL-3.3 are smaller than present results by 44–84% in the region from 12 to 22 keV, but larger than present ones in the region from 18 to 100 keV by 213–750%, and by about 310% at 544 keV.
4.2. Capture γ-ray spectra
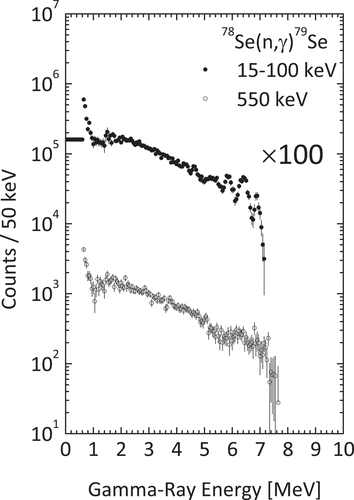
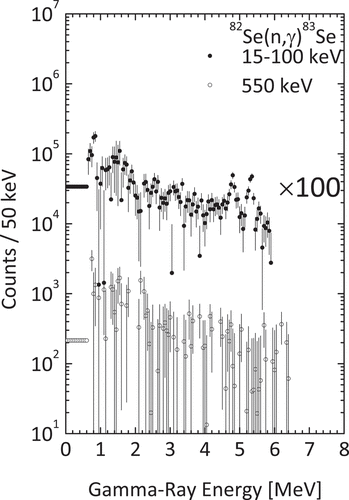
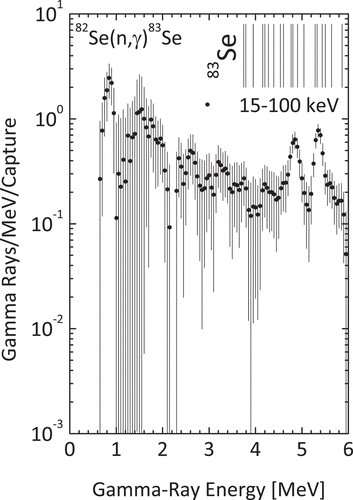
The keV-neutron capture -ray spectra of 74,76,78,80,82Se were obtained for the first time, and are shown in , respectively, where low-lying states of the residual nucleus, 75,77,79,81,83Se, are also shown as vertical bars. The energies of low-lying states correspond to the spectra in the 15–100 keV measurements, i.e., each state is shown at the energy of (
), where
is the average incident neutron energy in the 15–100 keV measurement for sample
in the center of the mass system and
is the excitation energy of the state. Since the statistical uncertainty of the PH spectrum of 82Se at 545 keV was large, as shown in , we tried to perform 3-point smoothing without weighting to the PH spectrum and then unfolded it. However, the obtained spectrum of 82Se was not meaningful. So we omit to show the unfolded spectrum of 82Se at 545 keV in .
Figure 13. Neutron capture cross sections of 82Se in the keV region. The horizontal bars show the energy region in .
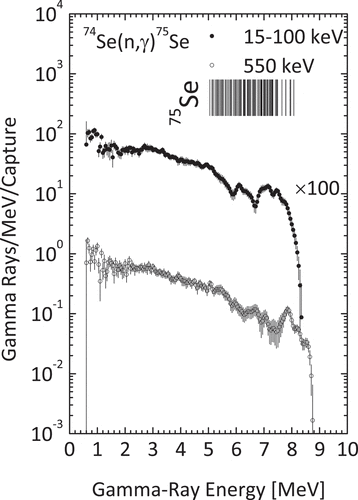
Figure 14. Obtained capture -ray spectra of 74Se in the incident neutron energy region from 15 to 100 keV and around 550 keV. Low-lying states of 75Se are shown as vertical bars. As for the energy positions of states, see the text.
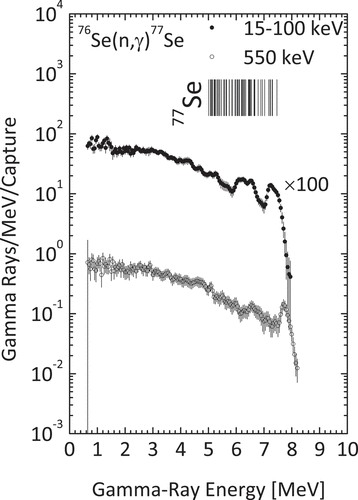
Figure 15. Obtained capture -ray spectra of 76Se in the incident neutron energy region from 15 to 100 keV and around 550 keV. Low-lying states of 77Se are shown as vertical bars. As for the energy positions of states, see the text.
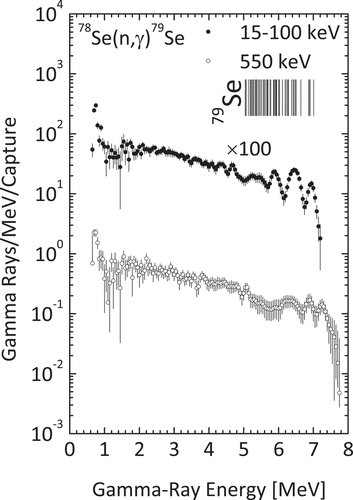
Figure 16. Obtained capture -ray spectra of 78Se in the incident neutron energy region from 15 to 100 keV and around 550 keV. Low-lying states of 79Se are shown as vertical bars. As for the energy positions of states, see the text.
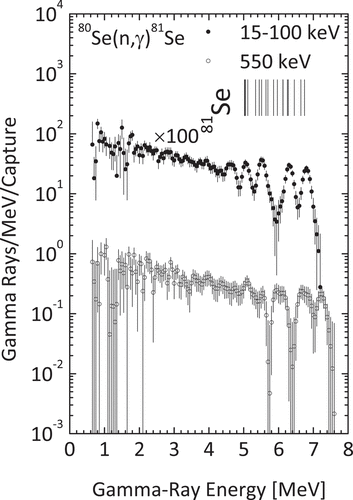
Figure 17. Obtained capture -ray spectra of 80Se in the incident neutron energy region from 15 to 100 keV and around 550 keV. Low-lying states of 81Se are shown as vertical bars. As for the energy positions of states, see the text.
The multiplicities of observed capture rays (
0.60 MeV) were derived by integrating the
-ray spectra with respect to the
-ray energy, and are shown in , where our results [Citation17] for 77Se are also shown. The reduced multiplicities obtained by dividing the multiplicities by the corresponding excitation energy of capture states (the neutron binding energy plus the incident neutron energy) are also shown in . Each multiplicity of 74,76,77,78,80,82Se seems to increase with the excitation energy of capture states, but each reduced multiplicity seems to be constant with respect to the excitation energy, considering the experimental uncertainties. This tendency is similar to those observed for lanthanide nuclides [Citation18,Citation47–49].
Table 10. Multiplicities of observed capture -rays (MP:E
MeV) and reduced multiplicities.
4.2.1. 74Se
In , the primary transitions from the neutron capture states to the ground (Ex = 0 MeV, =
), first (Ex = 0.112 MeV,
=
), nor second (Ex = 0.133 MeV,
=
) states [Citation22] were not clearly observed in the spectrum obtained in the 15–100 keV measurement. This indicates that the capture reaction in the region from 15 to 100 keV is mainly due to the s-wave neutron capture, assuming a predominant electric dipole (E1) transition. On the other hand, the primary transitions from the capture states to the third (Ex = 0.287 MeV,
=
), fourth (Ex = 0.293 MeV,
=
), sixth (Ex = 0.586 MeV,
=
) states and so forth were observed in the spectrum obtained in the 15–100 keV measurement. In the spectrum obtained at around 550 keV measurements, the primary transitions from the capture states to the ground state start to be observed. This suggests that the p-wave neutron capture component increases at 550 keV.
4.2.2. 76Se
In , the primary transitions from the neutron capture states to the low-lying states, that is, the ground (Ex = 0 MeV, =
) and third (Ex = 0.239 MeV,
=
) states [Citation22] are observed above 7 MeV in the spectrum obtained in the 15–100 keV measurement, assuming the s-wave capture and the E1 transition. On the other hand, the primary transitions from the neutron capture states to the ground state are not observed, but the primary ones from the neutron capture states to the third-excited state are clearly observed in the spectrum obtained at around 550 keV measurements. The intensities of the peak above 7 MeV due to these primary
-ray transitions are shown in .
Table 11. Intensities of primary transitions of the neutron capture of 76.Se.
4.2.3. 78Se
In , the primary transitions from the neutron capture states to the first (Ex = 0.096 MeV, =
) and second (Ex = 0.128 MeV,
=
) states and the fifth (Ex = 0.499 MeV,
=
) and sixth (Ex = 0.528 MeV,
=
) states [Citation22] are observed as two composite peaks in the spectra obtained both in the 15–100 keV and 550 keV measurements. The intensities of these two peaks are shown in the . The cascade transitions among low-lying states are observed as a strong peak around 0.8 MeV in both spectra.
Table 12. Intensities of primary -rays transitions of the neutron capture 78.Se.
4.2.4. 80Se
In , the primary transitions from the neutron capture states to the ground (Ex = 0 MeV, =
) state and the third (Ex = 0.468 MeV,
=
) state [Citation22] are observed as two peaks around 6.8 MeV and 6.3 MeV in the spectrum obtained in the 15–100 keV measurement, respectively. In the spectrum obtained in the 550 keV measurement, the peak around 6.8 MeV becomes broader in comparison with the corresponding peak around 6.3 MeV in the spectrum obtained in the 15–100 keV measurement. This may be caused by the transitions to the fifth (Ex = 0.616 MeV,
=
) [Citation22] state as well as the third state. The intensities of these two peaks are shown in the .
Table 13. Intensities of primary -ray transitions of neutron capture of 80.Se.
4.2.5. 82Se
In , the primary transitions from the neutron capture states to the third (E = 0.430 MeV,
=
), fourth (Ex = 0.539 MeV,
=
), and fifth (Ex = 0.582 MeV,
=
) states [Citation22] are observed as a peak around 5.4 MeV in the spectrum obtained in the 15–100 keV measurement. This suggests that the primary transitions are due to the p-wave neutron capture, considering the E1 transition and the spins and parities of these states. The intensity of this peak is shown in the .
Table 14. Intensities of primary -ray transitions of neutron capture of 82.Se.
5. Conclusion
We have measured the rays from the neutron capture reaction 74,76,78,80,82Se in the incident neutron energy region from 15 to 100 keV and around 550 keV, using the 1.5-ns pulsed neutron source based on the 7Li(p,n)7Be reaction and the large anti-Compton NaI(Tl)
-ray spectrometer.
The neutron capture cross sections of 74,76,78,80Se have been derived with the uncertainties of 4.0–5.5% and those of 82Se were derived with the uncertainties of 6.5–27%. The evaluations of JENDL-5.0 differ from the present results of 74,76,78,80Se and 82Se by 0.9–51% and 6.9–120%, respectively. On the other hand, the evaluations in the ENDF/B-VIII.0 have differences of 6–150% and 20–450% with the present results of 74,76,78,80Se and 82Se, respectively.
The keV-neutron capture -ray spectra of 74,76,78,80,82Se have been derived for the first time. The spectra show the primary transitions from the neutron capture states to low-lying states and the cascade transitions among low-lying states. The multiplicities of observed capture
rays as well as the intensities of these primary transitions have been derived from the capture
-ray spectra. The multiplicities seem to increase with neutron binding energies of target nuclides.
Acknowledgments
The present study was supported by a Grant-in-Aid (No. 19360423) of the Japan Ministry of Education, Culture, Sports, Science and Technology. This work was also supported by KAKENHI Grant-in-Aids (21K04580).
Disclosure statement
No potential conflict of interest was reported by the author(s).
Correction Statement
This article has been corrected with minor changes. These changes do not impact the academic content of the article.
References
- Takano H, Ikegami T, “Activities on R&D of partitioning and transmutation in Japan,” Seventh Information Exchange Meeting on Actinide and Fission Product Partitioning and Transmutation; 2002 Oct 14–16; Jeju, Republic of Korea; 2002. p. 23–35.
- Matsumoto T, Igashira M, Ohsaki T. Measurement of keV-Neutron capture cross sections and capture gamma-ray spectra of 99Tc. J Nucl Sci Technol. 2003;40(2):61–68. doi:10.1080/18811248.2003.9715334
- Matsumoto T, [ Dissertation], Tokyo Institute of Technology, (2002), [in japanese].
- Ohgama K, Igashira M, Ohsaki T. Measurement of keV-Neutron capture cross sections and capture gamma-ray spectra of 91,92Zr. J Nucl Sci Technol. 2005;42(4):333–340. doi:10.1080/18811248.2005.9726399
- Ohgama K, [ Dissertation], Tokyo Institute of Technology, (2005), [in japanese].
- Nishiyama J, Igashira M, Ohsaki T et al. Measurements of keV-Neutron capture cross sections and capture gamma-ray spectra of 117,119Sn. J Nucl Sci Technol. 2007;45(4):352–360. doi:10.1080/18811248.2008.9711444
- Nishiyama J, [ Dissertation], Tokyo Institute of Technology, (2007), [in japanese].
- Jiang S, He M, Diao L et al. Remeasurement of the half-life of 79Se with the projectile X-Ray detection method. Chinese Phys Lett. 2001;18(6):746–749. doi: 10.1088/0256-307X/18/6/311
- Siddappa K, Sriramachandra Murty M, Rama Rao J. p-wave neutron capture in medium and heavy weight nuclei. J Phys. 1972;A5(6):877–880. doi: 10.1088/0305-4470/5/6/012
- Trofimov YN. Neutron radiation capture cross-sections for even isotopes Se, Cd, Te, Dy and Yb. Yadernye Konstanty. 1989;2:10.
- Dillmann I, Heil M, Käppeler F et al. Experimental (n,γ) cross sections of the p-process nuclei 74Se and 84Sr. Phys Rev. 2006;C73:015803. doi:10.1016/j.nuclphysa.2005.05.093
- Beer H, Walter G, Käppeler F. Measurement of the 76Se capture cross Section and phenomenological s-process studies: the weak component. Astrophys J. 1992;389:784–790. doi:10.1086/171251
- Tolstikov VA, Koroleva VP, Kolesov VE et al., Radiation capture cross-sections of fast neutrons for Ge-74, Se-80, Cs-133, and Os-192isotopes, Yaderno-Fisicheskie Issledvaniya Reports, No.6, p.5, Fiziko-Energeticheskii Inst, Obninsk, Union of Soviet Socialist Republics (1968).
- Sriramachandra Murty M, Siddappa K, Rao JR. Capture cross sections of intermediate neutrons. J Phy Soc Jpn. 1972;35(1):8–11. doi: 10.1143/JPSJ.35.8
- Walter G. Temperatur und Neutronendichte der schwachen Komponente des s-Prozesses. Karlsruhe: Kernforschungszentrum Karlsruhe, 1984. (KfK 3706). [in German].
- Tasaka K, Katakura J, Ihara H, et al. JNDC Nuclear data Library of fission products, - Second version. Tokai Ibaraki Japan: Japan Atomic Energy Research Institute; 1990. (no. JAERI 1320). https://doi.org/10.11484/jaeri-1320.
- Kamada S, Igashira M, Katabuchi T et al. Measurements of keV-Neutron capture cross sections and capture gamma-ray spectra of 77Se. J Nucl Sci Technol. 2010;47(7):634–641. doi:10.1080/18811248.2010.9720961
- Mizuno S, Igashira M, Masuda K. Measurements of keV-Neutron capture cross sections and capture gamma-ray spectra of 161,162,163Dy. J Nucl Sci Technol. 2000;36(6):493–507. doi:10.1080/18811248.1999.9726232
- Igashira M, Kitazawa H, Yamamuro N. A heavy shield for the gamma-ray detector used in fast-neutron experiment. Nucl Instrum Methods. 1986;A245(2–3):432–437. doi: 10.1016/0168-9002(86)91278-7
- Macklin RL, Gibbons JH. Capture-cross-section studies for 30-220 keV neutrons using a new technique. Phys Rev. 1967;159:1007–1015. doi:10.1103/PhysRev.159.1007
- JENDL-5.0 data file for 197Au (MAT = 7925), evaluated by N. Iwamoto (2021).
- Firestone RB, Shirley VS, Baglin CM et al. Table of isotopes. 8th ed. New York: John Wiley and Sons; 1998.
- Vishnevskiy IN, Zheltonozhskiy VA, Reshit‘ko SV. About the nature of gamma-radiation in (n,γ) reactions. Izv Rossiiskoi Akademii Nauk, Ser Fiz. 1994;58(5):47.
- Kendrick H, Sperling S. M. An Introduction to the Principles and Use of the FERDOR Unfolding Code. San Diego: Gulf Radiation Technology; 1970. ( GA-9882).
- Senoo K, Nagai Y, Shima T, et al. A Monte Carlo code for multiple neutron scattering events in a thick sample for (n, γ) experiments. Nucl Instrum Methods. 1994;A339(3):556–563.
- Iwamoto O, Iwamoto N, Kunieda S, et al. Japanese evaluated nuclear library version 5:JENDL-5. J Nucl Sci Technol. 2023;60(1):1–60. doi: 10.1080/00223131.2022.2141903
- Ohsaki T, Nagai Y, Igashira M, et al. An NaI(Tl) spectrometer system for keV neutron radiative-capture reactions. Nuclear Instruments And Methods In Physics Research Section A: Accelerators, Spectrometers, Detectors And Associated Equipment. 1999;A425(1–2):302–319.
- Brown DA, Chadwick MB, Capte R, et al. ENDF/B-VIII.0: the 8th Major release of the Nuclear reaction data library with CIELO-project cross sections, New standards and thermal scattering data. Nucl Data Sheets. 2018;148:1–420. doi: 10.1016/j.nds.2018.02.001
- JENDL-5.0 data file for 74Se (MAT = 3425), evaluated by S. Kamada (2009).
- ENDF/B-VIII.0 data file for 74Se (MAT = 3425), evaluated by JNDC FP Nuclear data working group (1990).
- Shibata K, Kawano T, Nakagawa T, et al. Japanese evaluated Nuclear data library version 3 revision-3: JENDL-3.3. J Nucl Sci Technol. 2002;39(11):1125–1136. doi: 10.1080/18811248.2002.9715303
- JENDL-3.3 data file for 74Se (MAT = 3425), evaluated by JNDC FP Nuclear data working group (1990).
- JENDL-5.0 data file for 76Se (MAT = 3431), evaluated by S. Kamada (2009).
- ENDF/B-VIII.0 data file for 76Se (MAT = 3431), evaluated by JNDC FP Nuclear data working group (1990).
- JENDL-3.3 data file for 76Se (MAT = 3431), evaluated by JNDC FP Nuclear data working group (1990).
- JENDL-5.0 data file for 78Se (MAT = 3437), evaluated by S. Kamada.
- ENDF/B-VIII.0 data file for 78Se (MAT = 3437), evaluated by JNDC FP Nuclear data working group (1990).
- JENDL-3.3 data file for 78Se (MAT = 3437), evaluated by JNDC FP Nuclear data working group (1990).
- Mughabghab SF, Divadeenam M, Holden NE. Neutron Cross Sections. Vol.1, Neutron resonance parameters and thermal cross sections. New York: Academic Press; 1981. (Part A Z = 1 - 60).
- JENDL-5.0 data file for 80Se (MAT = 3443), evaluated by S. Kamada.
- ENDF/B-VIII.0 data file for 80Se (MAT = 3443), evaluated by JNDC FP Nuclear data working group (1990).
- JENDL-3.3 data file for 80Se (MAT = 3443), evaluated by JNDC FP Nuclear data working group (1990).
- JENDL-5.0 data file for 82Se (MAT = 3449), evaluated by S. Kamada.
- ENDF/B-VIII.0 data file for 82Se (MAT = 3449), evaluated by JNDC FP Nuclear data working group (1990).
- JENDL-3.3 data file for 82Se (MAT = 3449), evaluated by JNDC FP Nuclear data working group (1990).
- Chaubey AK, Sehgal ML. Test of statistical theory of Nuclear reactions. Phys Rev. 1966;152(3):1055–1062. doi: 10.1103/PhysRev.152.1055
- Veerapaspong T, Igashira M, Mizuno M, et al., Measurement of keV-Neutron capture cross sections and capture γ-ray spectra of 143,145,146Nd. J Nucl Sci Technol. 1999;36(10):855–864. https://doi.org/10.1080/18811248.1999.9726276
- Duamet B, Igashira M, Mizumachi M, et al. Measurement of keV-Neutron capture cross sections and capture γ-ray spectra of 147,148,149,150,152,154Sm. J Nucl Sci Technol. 1999;36(10):865–876. doi: 10.1080/18811248.1999.9726277
- Harun-Ar-Rashid AKM, Ro TI, Igashira M, et al. Measurement of keV-Neutron Capture Cross Sections and Capture γ-ray Spectra of 167Er. J Nucl Technol. 2000;37(5):421–427. https://doi.org/10.1080/18811248.2000.9714914

