
 ?Mathematical formulae have been encoded as MathML and are displayed in this HTML version using MathJax in order to improve their display. Uncheck the box to turn MathJax off. This feature requires Javascript. Click on a formula to zoom.
ABSTRACT
In the decommissioning of the Fukushima Daiichi Nuclear Power Station, understanding the distribution of radioactive substances and dose-equivalent rates is crucial to develop detailed decontamination plans and minimize worker exposure. In this study, we remotely visualized radioactive hotspots and dose-equivalent rate distribution in Unit 1 reactor building of the station using a Mecanum wheel robot equipped with a Compton camera, simultaneous localization and mapping device, and survey meter. We successfully visualized high-concentration radioactive hotspots on the U-shaped piping of the drywell humidity control system and the atmospheric control piping in the ceiling in front of the transverse in-core probe room. Furthermore, the hotspot location was identified in three dimensions using the Compton camera used to analyze the atmospheric control piping. By simultaneously analyzing the dose-equivalent rate data acquired by the survey meter and the hotspot locations visualized by the Compton camera, it was confirmed that the hotspots caused elevated dose-equivalent rates in the surrounding area. In the future, if this robotic system is used in unexplored areas, such as the upper floors of reactor buildings, it can provide information about the locations of radioactive hotspots and the distribution of dose-equivalent rates.
GRAPHICAL ABSTRACT

1. Introduction
Owing to the Fukushima Daiichi Nuclear Power Station (FDNPS) accident that occurred due to a large tsunami caused by the Great East Japan Earthquake on 11 March 2011, a significant amount of radioactive substances was dispersed over a wide area inside and outside the FDNPS site. In the ongoing decommissioning work, radioactive substance removal and the dismantling of the structures contaminated with radioactive substances are being carried out. To develop a well-planned work strategy and minimize radiation exposure to workers during these operations, understanding the location of radioactive hotspots and the distribution of ambient dose-equivalent rates (hereafter referred to as the dose rate) within the work environment is necessary.
In the FDNPS work environment, radioactive cesium is the primary contributor to the increased dose rate in the surrounding area. Handheld survey meters were used to assess the dose-rate distribution and identify radioactive hotspots (localized regions with accumulated radioactive cesium). Survey meters measure dose rates at specific locations and are effective in collecting dose-rate data. However, if workers attempt to measure a large area point-by-point for extended periods, they may be exposed to a significant amount of radiation. Furthermore, when attempting to cover a large area, there is a risk of overlooking localized radioactive hotspots. Therefore, combining the capabilities of survey meters and gamma-ray imagers, which visualize the radioactive substances that form hotspots, is expected to be an effective approach for efficiently understanding the distribution of dose rate and radioactive substances in the work environment.
Several gamma-ray imagers have successfully visualized hotspots in the FDNPS site. A pinhole-type camera was used to visualize the radioactive hotspot near the penetration hole in Unit 1 reactor building (R/B) [Citation1]. A similar pinhole-type camera was used to visualize radioactive hotspot in the lower part of the exhaust stack between Units 1 and 2 [Citation2]. Hotspot visualization in the outdoor environment of FDNPS using an all-surrounding sensitive Compton camera has been reported [Citation3]. Furthermore, a coded aperture-type gamma-ray imager is being considered for inspecting segmented radioactive contaminated pipes [Citation4].
To perform measurements in high-dose-rate environments using survey meters and gamma-ray imagers, it becomes necessary to use robots when human entry or prolonged work is not possible due to radiation exposure concerns. Studies have been conducted through simulations and experiments to incorporate a gamma-ray imager into a robot and determine the location of radioactive substances [Citation5–7]. These methods involve equipping robots with simultaneous localization and mapping (SLAM) devices and projecting images of radioactive substances acquired by a gamma-ray imager onto the three-dimensional (3D) models of the working environment obtained through SLAM.
The authors have conducted verification tests using self-developed integrated Radiation Imaging System (iRIS) to achieve 3D visualization of the radioactive hotspot locations in the FDNPS site. iRIS comprises a Compton camera, SLAM device based on 3D light detection and ranging (LiDAR), and survey meter. Compton cameras have a wider effective field of view (FoV) than other types of gamma-ray imagers, which is advantageous when combined with SLAM devices to measure the entire work area as if scanning it. In addition, the gamma-ray sensor used by the author is compact as shown in appendix and can be easily adapted to measure a wide range of dose rate distributions, from low to high, not only in the environment of the difficult-to-return zone in Fukushima prefecture but also inside the FDNPS building, by setting up a shield that can be carried by an operator or robot [Citation8–10].
iRIS maps and displays the hotspot images captured by the Compton camera and the dose-rate data obtained by the survey meter onto the 3D model of the working environment obtained by SLAM. Thus far, successful visualization of the hotspot locations and related dose rates has been achieved for the lower part of the exhaust stack between Units 1 and 2 of FDNPS and the high-contamination filter train inside the air-conditioning room of Unit 2 R/B of FDNPS [Citation9,Citation10]. However, these measurements were not performed using robots; the movement and installation of the devices were performed by humans. In the R/B of FDNPS, there exist environments with extremely high dose rates exceeding 100 mSv/h. Consequently, workers cannot enter such environments and hence using robots is essential.
Therefore, in this study, we investigated the far area of Unit 1 R/B of FDNPS, where radiation levels are high and workers cannot enter, by integrating iRIS and a Mecanum wheel robot. The authors remotely operated the robot system to transport the Compton camera and survey meter into the far area of the R/B of FDNPS Unit 1, which has a maximum dose rate of 262 mSv/h, to obtain information on dose rate and hotspot locations. By remote visualization of hotspots and analyzing the dose-rate data obtained from the survey meter, it was confirmed that the dose rate was elevated near the hotspots. To identify the hotspot location more precisely and compare it with the dose-rate data, 3D visualization of the discovered hotspot in a specific piping was performed. The system overview and test results of the investigation are described herein.
2. Experimental setup
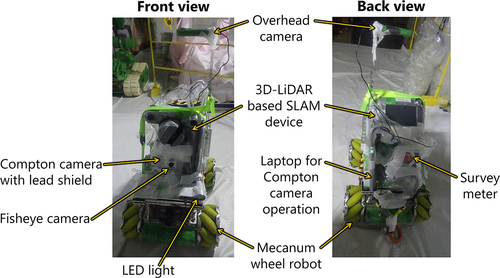
To obtain information on the dose-rate distribution and hotspot locations inside Unit 1 R/B of FDNPS, a remote operating system was constructed using the iRIS mounted on the Mecanum wheel robot ().
Figure 1. Front and back view of the setup used for radioactive hotspot investigation. The basic elements of iRIS, namely a Compton camera, 3D-LiDAR-based SLAM device, and survey meter, were mounted on a Mecanum wheel robot. The robot carried an overhead camera (for the operator to control the robot while viewing the video) and LED light to illuminate in the dark. All devices installed on the robot were covered with plastic bags to prevent radioactive contamination.
The gamma-ray sensor setup of the Compton camera used to detect the hotspot was the same as that was used in the past to visualize radioactive hotspots on the highly contaminated filter train inside the air-conditioning room of Unit 2 R/B [Citation10]. The geometry and basic performance of the gamma-ray sensor setup are described in the appendix.
A 3D-LiDAR-based SLAM device (Contour; KAARTA, Pittsburgh, PA, USA) and survey meter (RADEYE GF-10; Thermo Fisher Scientific, Waltham, MA, USA) were used to obtain the 3D model data of the work environment and dose-rate information. The measurement distance of the LiDAR sensor in the SLAM device was 1–20 m with an accuracy of ±3 cm. The dimensions and weights of the SLAM device and survey meter were 267 mm × 267 mm × 152 mm and 2.78 kg, and 95.5 mm × 61.2 mm × 31.5 mm and 135 g, respectively.
The remote operation system was built based on the Mecanum wheel robot, which was jointly manufactured by Japan Atomic Energy Agency (JAEA) and SHIMANO, Inc., Fukui, Japan. Equipped with Mecanum wheels, this robot is capable of pivotal turns and horizontal movements in all directions. shows the detailed specifications of the robot. Furthermore, to navigate in the dark, the robot was equipped with a light-emitting diode (LED) to illuminate the front section and an LED tape light was attached to the chassis to illuminate the surroundings.
Table 1. Partial specifications of the Mecanum wheel robot used in the hotspot investigation.
The overhead camera (THETA Z1, RICOH, Tokyo, Japan) allows the operator to remotely operate the robot while viewing the front/back, left/right, and upward directions. The operational testing of the robot, where the commercially available Compton camera and the SLAM device were installed, has been conducted in a laboratory. By remotely controlling the robot from outside the laboratory, the 3D localization of the 137Cs radiation source placed inside the laboratory was successfully achieved and reported in Ref [Citation11]. In the present work, to mitigate the influence of gamma rays coming from below the robot, a 2-cm-thick lead plate was mounted on the robot and the measurement devices were installed on it.
In this test, three tasks were performed for acquiring radiation information using this setup: dose-rate mapping, two-dimensional (2D) Compton imaging of radioactive hotspots, and 3D imaging of hotspot locations. As shown in , the robot system started moving from the carry-in entrance of Unit 1 R/B toward the front of the transverse in-core probe (TIP) room at the farthest point under remote control by the operator. The robot and Compton camera were operated wirelessly using Wi-Fi from a base station located in the carry-in entrance.
Figure 2. Schematic of the top view of the investigation area inside Unit 1 R/B of FDNPS. The robot system travelled from the carry-in entrance of the R/B toward the front of the TIP room at the farthest point. The robot and Compton camera were operated wirelessly and remotely using Wi-Fi from a base station located in the carry-in entrance.
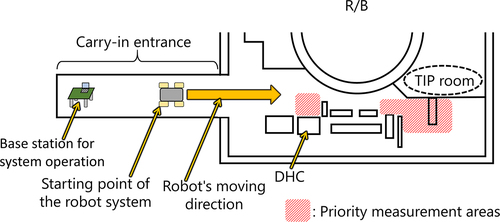
Incidentally, we used another robot (Kobra 725, Teledyne FLIR, Wilsonville, OR, USA), which is no longer used for radiation measurement, for monitoring the measurement system based on the Mecanum wheel robot. Specifically, in order to prevent the Mecanum wheel robot from coming into contact with structures in the building, the Mecanum wheel robot was maneuvered while monitoring its position and orientation with the Kobra robot’s camera. In this measurement, we focused on the drywell humidity control (DHC) system and the passageway in front of the TIP room and reported the results of the survey.
3. Measurement methods and results
The methods and results of dose-rate mapping, 2D Compton imaging of radioactive hotspots, and 3D imaging of the hotspot locations inside Unit 1 R/B of FDNPS are presented.
3.1 Dose-rate mapping
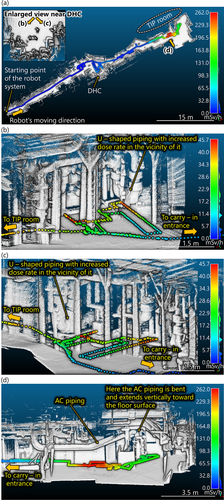
shows the results of the dose-rate mapping. The dose rate measured along the robot’s trajectory was mapped on a 3D model of the R/B acquired by the SLAM device. Panel (a) shows the dose-rate map of the entire work area with the ceiling of the 3D model removed to improve visibility for the reader. Panels (b) and (c) show the vicinity of the DHC system; observations near the DHC system are recorded as indicated by the arrows shown in the enlarged view in panel (a). Panel (d) shows the passageway in front of the TIP room, as indicated by the arrows in panel (a). The height of the survey meter used to obtain the dose-rate data was approximately 57 cm above the floor surface. These maps show that the dose rate increases rapidly in the passageway in front of the TIP room. In addition, an increase in the dose rate is evident in front of the DHC system. The 2D hotspot imaging results using the Compton camera for these areas with elevated dose rates are described in the following section.
Figure 3. Dose-rate mapping results along the robot’s movement trajectory acquired by SLAM. (a) the robot system moved from the carry-in entrance toward the front of the TIP room, as shown in . Panels (b) and (c) show the vicinity of the DHC system; observations were recorded near the DHC system in the direction of the arrows shown in the enlarged view in panel (a). Panel (d) shows the passageway in front of the TIP room indicated by the arrow in panel (a).
3.2 2D Compton imaging of radioactive hotspots
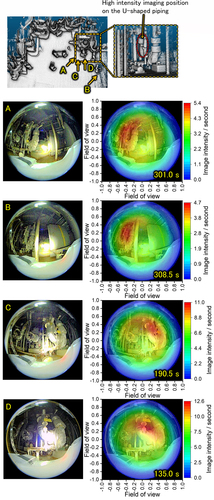
A hotspot location survey using the Compton camera was conducted near the DHC system and in the passageway in front of the TIP room, where dose rates were elevated compared to the surrounding environment. The energy conditions for extracting gamma-ray event data for drawing Compton cones were set to 625 keV ≤ Es + Ea ≤725 keV and 10 keV ≤ Es ≤165 keV to visualize the radioactive hotspot caused by 137Cs emitting 662-keV gamma rays; here Es and Ea denote the energy deposition in the scatterer and absorber of the Compton camera, respectively. This energy range was applied in all measurements conducted in this work. In the 2D imaging in , described below, a virtual hemisphere was defined in front of the Compton camera on which the Compton cone was drawn, and the drawn image was projected onto the fisheye photograph by equisolid angle projection. The horizontal and vertical axes in the imaging results are projections of − 90° to 90° in the hemisphere onto a 2D plane and the rescaling ranges from − 1.0 to 1.0. The intensity, indicated by color bars, represents the overlapping degree of the Compton cones. In addition, the measurement time is noted in the figure. Image reconstruction was conducted by simple back-projection method as described in appendix.
Figure 4. 2D imaging results obtained by the Compton camera near the U-shaped piping installed on the right side of the DHC system. The top panel shows a 3D model of the measurement area viewed from above, with each arrow indicating the approximate locations and measurement directions of the Compton camera. For each view, photographs acquired with the fisheye optical camera attached to the Compton camera (left) and the imaging results of the superimposed hotspot images (right) are shown.
3.2.1 Measurements near the DHC system
show that the dose rate increases near the U-shaped piping located near the DHC system. First, the observations recorded using the Compton camera near the U-shaped piping indicated in are shown; the result is obtained for the U-shaped piping located on the right side of the DHC system when looking at the system from the front.
shows a 2D hotspot image acquired using the Compton camera; the top view is shown with arrows indicating the approximate locations and directions where the images were taken. High-intensity images were observed on the U-shaped piping in all measurements. In particular, the left part of the U-shaped piping was strongly contaminated.
shows the measurement results from positions further away from the U-shaped piping than the Compton camera installation positions shown in . In these results, the high-intensity image is formed near the ceiling rather than the U-shaped piping. Radioactive contamination with a large volume accumulated near the ceiling, and the overall total contamination is probably higher than the U-shaped piping. However, the effective FoV of the Compton camera setup used is about ± 60°, and when approaching the U-shaped piping, part of the ceiling is out of the FoV. Furthermore, the contribution of gamma rays from the U-shaped piping, which was closer in distance than the ceiling, would have been more pronounced. Therefore, it is considered that the image was formed there with high intensity by approaching the U-shaped piping, as shown in . In addition, the dose rate measured by the survey meter shows an increase near the U-shaped piping, as shown in , indicating that this is a local radioactive hotspot.
shows the 2D measurement results for the U-shaped piping shown in on the left side of the DHC system when viewed from the front. Here, a high-intensity image was formed on the U-shaped piping. The dose rate also increased near the U-shaped piping, as shown in , indicating that the U-shaped piping is the primary contamination hotspot.
In previous studies, the authors used a system equipped with a crawler robot with a compact Compton camera and conducted measurements from the Unit 1 R/B entrance toward farther into the R/B; a high-intensity image was confirmed in the direction where the DHC system was located [Citation12]. In the present study, we were able to reconfirm that the DHC system is more contaminated than its surroundings, and these results improve the reliability of past measurement results.
Figure 5. Imaging results of the U-shaped piping on the right side of the DHC acquired with the Compton camera from a greater distance than in .
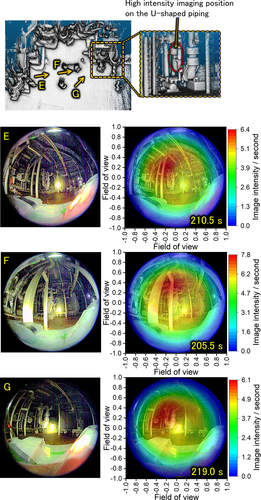
Figure 6. 2D imaging results obtained by the Compton camera near the U-shaped piping installed on the left side of the DHC. The top panel shows a 3D model of the measurement area viewed from above, with each arrow indicating the approximate locations and measurement directions of the Compton camera. For each view, photographs acquired with the fisheye optical camera attached to the Compton camera (left) and the imaging results of the superimposed hotspot images (right) are shown.
3.2.2 Measurements results for the passageway in front of the TIP room
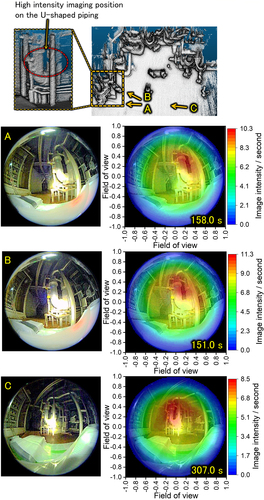
In this section, imaging results pertaining to the passageway in front of the TIP room are described. shows the 2D imaging results obtained from several viewpoints. The top view shows the positions and measurement directions of the Compton camera in each measurement (indicated by arrows); the ceiling has been removed to improve visibility for the reader. In this measurement, the position and posture information of the robot at each measurement point were recorded in real-time through SLAM (Section 3.3).
Figure 7. 2D imaging results obtained by the Compton camera near the atmospheric control piping installed in the ceiling in front of the TIP room. The top panel shows a 3D model of the measurement area viewed from above, with each arrow indicating the approximate locations and measurement directions of the Compton camera. The artifact marked on the top panel is a point cloud generated by a robot separately used to monitor the Mecanum wheel robot equipped with the Compton camera.
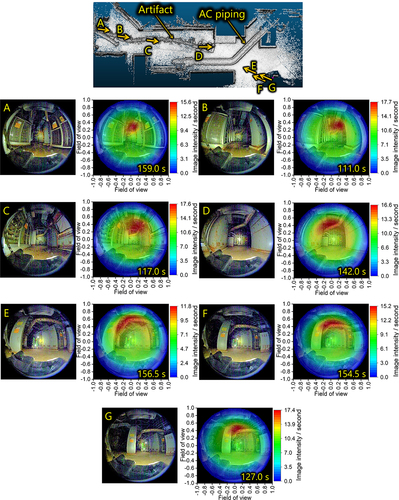
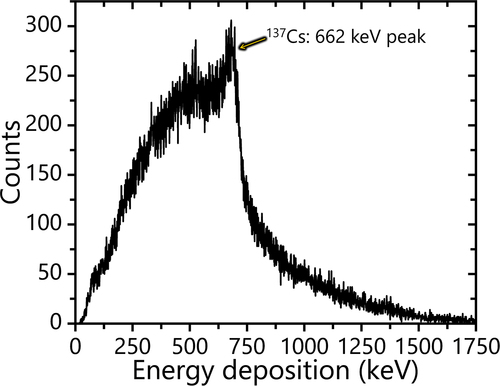
In all measurements, a high-intensity image is observed near the atmospheric control (AC) piping running across the ceiling, specifically evident in the results for views D, E, F, and G. Here, the result of view D was acquired in an environment with a dose rate of 210 mSv/h, which is the highest dose rate for which the Compton camera visualized the hotspot successfully during the investigation. As additional information, shows the energy spectrum of the coincidence events obtained at view D. An increase in counts was observed around 662 keV, the energy of gamma rays emitted from 137Cs. The counting rates in the scatterer and absorber of the Compton camera and the chance coincidence rate at 200 ns of the coincidence time window were 23.9 kcps, 30.1 kcps, and 144 cps. Incidentally, during the prior evaluation conducted at the 137Cs irradiation facility, the scatterer and absorber count rates and coincidence count rates were even more stringent; 49.6 kcps, 47.8 kcps, and 474 cps and 27.1 kcps, 37.0 kcps, and 201 cps at the irradiation level of 84 mSv/h for irradiation from 0° and 60° directions inside the FoV, respectively. The reason why the counting rates at 84 mSv/h in the 137Cs irradiation facility was higher than ones at 210 mSv/h in the FDNPS building is that the former is due to the contribution of 662 keV-direct gamma rays only, while the latter is due mainly to scattered gamma rays. As described in the appendix, the gamma-ray sensor of the Compton camera is covered by a 45-mm-thick lead shield, which cuts out many of the scattered gamma rays. As a result, it is assumed that although the dose rate was higher at the FDNPS, the count rate was not as high as that of the 137Cs irradiation facility. Even under conditions more severe than these FDNPS measurements, we have confirmed that the location of the radiation source can be accurately visualized [Citation10]. Considering only the count rates, it is unlikely that the Compton camera is losing its ability to visualize hotspots at the location of view D. Furthermore, as mentioned later, the comparison between the dose rate data obtained from the survey meter and the visuals obtained from the Compton camera significantly enhances the reliability of the Compton camera’s visualization outcomes.
Figure 8. The energy spectrum of the coincidence event between the scatterer and absorber of the Compton camera. This spectrum was acquired at view D in .
shows the measurement results obtained for areas near the wall of the TIP room; high-intensity image near the ceiling AC piping was observed. This AC piping bends in front of the wall and extends from the ceiling to the floor surface. The 2D imaging result shows that the ceiling part of the piping is more strongly imaged than the vertical part going into the floor surface, indicating that the AC piping is more contaminated in the ceiling part. This result is consistent with dose-rate data obtained using survey meters: the dose-rate data show no significant increase in the vertical part of the piping. Further, it is evident that the dose rate sharply increases directly below the ceiling part [].
Figure 9. 2D imaging results of the AC piping near the wall in front of the TIP room obtained with the Compton camera. The ceiling AC piping bends at the wall and extends perpendicular to the floor surface.

3.3 3D imaging of radioactive hotspot locations
The 2D imaging results obtained from the Compton camera indicate high-intensity contamination in the AC piping installed in the ceiling. In addition, the dose-rate data obtained using the survey meter confirmed that the highest dose rate was observed directly below the angled portion of the AC piping. Therefore, to locate the high-intensity hotspot in more detail and discuss the relationship between the hotspot location and dose rate, we used the Compton camera to visualize the hotspot location in 3D.
Several methods for 3D identification of radiation sources using the Compton camera with the same gamma-ray sensor have been presented by Sato et al. One simply uses the Compton camera to measure the radiation source from multiple viewpoints and finds the radiation source at the position where the Compton cone overlaps in the 3D space use [Citation13]. Additionally, a method was reported that uses a laser range finder or photogrammetry to obtain a 3D model of the work environment and projects the image of the radiation source onto this model [Citation12,Citation14,Citation15]. Another reported method integrates 3D-LiDAR and structure-from-motion based SLAM technology to estimate the Compton camera’s self-position and draw Compton cones on a 3D model using that position as a base point [Citation9,Citation10,Citation16]. Integration of a Compton camera and a SLAM device was also conducted in this measurement, and the 3D visualization method of hotspot location in this work is briefly described below.
As shown in , the work environment is analyzed through multiple viewpoints with the Compton camera. Subsequently, the generated Compton cones are projected onto the 3D model of the work environment obtained from the SLAM device. Hotspots are identified in the region where multiple Compton cones overlap on the 3D model. In this process, the self-position and posture information of the Compton camera for each viewpoint during Compton imaging is estimated using the SLAM device to determine the starting points and projection directions of the Compton cones. The 3D model acquired by the 3D-LiDAR-based SLAM device is in the form of point cloud data (PCD). Compton cones were drawn by the back-projection method using the point cloud comprising the 3D model. In other words, the image intensity, which indicates the overlap degree of Compton cones, was set at each point in the PCD. Multiple Compton cones were projected onto the PCD, and the hotspots were identified at the points where several cones overlapped. The authors have demonstrated the ability to visualize hotspots using a similar method near the exhaust stack between Units 1 and 2 and inside the air-conditioning room of Unit 2 R/B [Citation9,Citation10]. In these previous experiments, data were collected by manually moving the iRIS. However, in the present work, iRIS-integrated robot was used to perform measurements in high-radiation environments where worker entry is not possible, allowing for the remote movement of the iRIS and data acquisition system.
Figure 10. Schematic illustration of locating and visualizing a radiation source in 3D by combining a Compton camera and simultaneous localization and mapping (SLAM) device. These two devices are mounted on a robot, which can be operated remotely. The position and posture where the Compton camera detected gamma rays were estimated using the SLAM device. Generated Compton cones from multiple viewpoints are projected onto the 3D work environment model generated by SLAM, and the hotspot is identified at the intersection of the Compton cones. This figure is a modified version of Figure 3 from ref [Citation9], which describes the principle of the iRIS.
![Figure 10. Schematic illustration of locating and visualizing a radiation source in 3D by combining a Compton camera and simultaneous localization and mapping (SLAM) device. These two devices are mounted on a robot, which can be operated remotely. The position and posture where the Compton camera detected gamma rays were estimated using the SLAM device. Generated Compton cones from multiple viewpoints are projected onto the 3D work environment model generated by SLAM, and the hotspot is identified at the intersection of the Compton cones. This figure is a modified version of Figure 3 from ref [Citation9], which describes the principle of the iRIS.](/cms/asset/b7ba54c6-aa26-40ed-a446-9772b7ee3692/tnst_a_2282551_f0010_oc.jpg)
In this work, measurements were performed from multiple viewpoints, encompassing the AC piping (), and the generated Compton cones were projected onto the 3D model of the piping. At each measurement point, the data obtained from the 60-s measurement was used to reconstruct the hotspot image, and the result is shown in . There is a clear high-intensity hotspot near the angled section of the AC piping, indicating that this hotspot is directly above the region with highest dose rates.
Figure 11. Measurements were performed with the Compton camera across the AC piping in the ceiling, and (a) the reconstructed image of the hotspot was compared with (b) the dose-rate data acquired by a survey meter. Panel (b) is a rescaled figure of . The artifact marked on the panel (a) is a point-cloud shape caused by a robot separately used to monitor the Mecanum wheel robot equipped with the Compton camera.
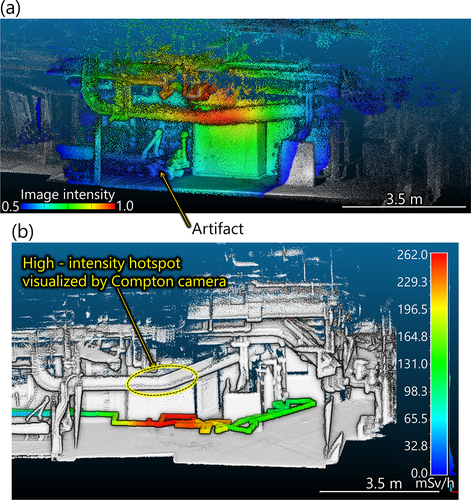
By combining the data from the Compton camera, survey meter, and 3D-LiDAR, we could generate dose-rate maps of the R/B floor and achieve 3D localization of the hotspot that is responsible for increased dose rate. By comparing the positions of the hotspots visualized by the Compton camera with those obtained from the dose-rate data, we can enhance the reliability of both sets of data, which also holds for the 2D visualization results. In the measurements performed near the DHC system, we did not simultaneously record the self-position and posture information of the Compton camera using the SLAM device. Therefore, unfortunately, the 3D visualization of the hotspots was not carried out near the DHC system.
4. Conclusions
We successfully developed a remote radiation imaging system equipped with iRIS and a Mecanum wheel robot, enabling the acquisition of radiation information on dose-rate distribution and hotspot locations within Unit 1 R/B where the dose rates are high and hence the area is inaccessible to workers.
Using the robot equipped with iRIS, we conducted a remote investigation inside Unit 1 R/B. During the investigation, we successfully visualized high-intensity hotspots on the U-shaped piping near the DHC system and AC piping located in the pathway in front of the TIP room. We confirmed that the system could remotely visualize hotspots in an environment with a high dose rate of up to 210 mSv/h. Measurements were performed from multiple viewpoints across the piping to visualize radioactive hotspots on the AC piping, and the 3D visualization of the hotspot location was performed for accurate identification. To enable this 3D visualization, information on the self-position and posture information of the Compton camera was obtained by SLAM at multiple measurement points. Additionally, by acquiring and using the information on hotspot locations and dose rates in the surrounding area, we can discuss the extent to which the hotspots contribute toward the increase in the dose rate in the surrounding. Using this system in unexplored areas, such as the higher floors of the R/Bs of FDNPS, in future will allow us to obtain information on the hotspot locations and dose-rate distributions.
Acknowledgments
The authors deeply appreciate the highly technical-based support for the hotspot investigation at FDNPS conducted by the engineers of ATOX Co., Ltd., and Japan Total Planning. The authors would also like to thank T. Maeda, A. Katayama, I. Wakaida, K. Akaoka, and K. Takasaki of JAEA for safety management of the investigation inside the FDNPS, and K. Minemoto and M. Nemoto of Visible Information Center, Inc. for supporting the development of the 3D reconstruction of the radiation image. The authors would further like to thank H. Shimano, T. Kakuto, and T. Tanaka, of SHIMANO, Inc., for its cooperation in the creation of the Mecanum wheel robot. The authors also wish to acknowledge S. Nakamura and M. Hirayanagi of Hamamatsu Photonics K.K., Prof. J. Kataoka of Waseda University, and A. Kishimoto for the development of the base technologies of the compact Compton camera. This work includes part of a project report submitted by JAEA to Tokyo Electric Power Company Holdings, Inc., which adds details on the specifications of the robot and Compton camera that constitute the imaging system, as well as the specific measurement conditions for 3D imaging.
Disclosure statement
No potential conflict of interest was reported by the author(s).
References
- Okada K, Tadokoro T, Ueno Y, et al. Development of a gamma camera to image radiation fields. Prog Nucl Sci Tech. 2014;4:14–17. doi: 10.15669/pnst.4.14
- Hirayama H, Hayashi K, Iwanaga K, et al. Measurement of 137Cs activity with pinhole gamma camera. Trans At Energy Soc Jpn. 2020;19(3):152–162. Japanese.
- Katagiri H, Satoh W, Enomoto R, et al. Development of an all-sky gamma-ray Compton camera based on scintillators for high-dose environments. J Nucl Sci Technol. 2018;55(10):1172–1179. doi: 10.1080/00223131.2018.1485598
- Albright L, Amway P, Basu S, et al. U.S. Effort support to examinations at Fukushima - November 2021 meeting notes with updated information requests. Argonne National Laboratory, Technical Report, ANL-21/65:C–35. 2022.
- Doyeon K, Hanwool W, Yonghoon J, et al. 3D radiation imaging using mobile robot equipped with radiation detector. Proceedings of the 2017 IEEE/SICE International Symposium on System Integration. 2018:444–449.
- Lee SM, Hanczor M, Chu J, et al. 3-D volumetric gamma-ray imaging and source localization with a mobile robot. 2018. arXiv:1802.06072.
- Vetter K, Barnowski R, Cates WJ. Advances in nuclear radiation sensing: enabling 3-D gamma-ray vision. Sensors. 2019;19(11):2541. doi: 10.3390/s19112541
- Sato Y, Ozawa S, Terasaka Y, et al. Remote radiation imaging system using a compact gamma-ray imager mounted on a multicopter drone. J Nucl Sci Technol. 2018;55(1):90–96. doi: 10.1080/00223131.2017.1383211
- Sato Y, Terasaka Y. Radiation imaging using an integrated Radiation Imaging System based on a compact Compton camera under unit 1/2 exhaust stack of Fukushima Daiichi Nuclear Power Station. J Nucl Sci Technol. 2022;59(6):677–687. doi: 10.1080/00223131.2021.2001391
- Sato Y, Terasaka Y. Radiation imaging of a highly contaminated filter train inside Fukushima Daiichi Nuclear Power Station unit 2 using an integrated Radiation Imaging System based on a Compton camera. J Nucl Sci Technol. 2023;60(8):1013–1026. doi: 10.1080/00223131.2022.2159894
- Sato Y, Minemoto K, Nemoto M. Visualization software for radioactive contamination based on Compton camera: COMRIS. Radiat Prot Dosimetry. 2023;199(8–9):1021–1028. doi: 10.1093/rpd/ncad106
- Sato Y, Terasaka Y, Utsugi W, et al. Radiation imaging using a compact Compton camera mounted on a crawler robot inside reactor buildings of Fukushima Daiichi Nuclear Power Station. J Nucl Sci Technol. 2019;56(9–10):801–808. doi: 10.1080/00223131.2019.1581111
- Sato Y, Terasaka Y, Ozawa S, et al. Development of compact Compton camera for 3D image reconstruction of radioactive contamination. J Inst. 2017;12(11):C11007. doi: 10.1088/1748-0221/12/11/C11007
- Sato Y, Tanifuji Y, Terasaka Y, et al. Radiation imaging using a compact Compton camera inside the Fukushima Daiichi Nuclear Power Station building. J Nucl Sci Technol. 2018;55(9):965–970. doi: 10.1080/00223131.2018.1473171
- Sato Y, Ozawa S, Tanifuji Y, et al. A three-dimensional radiation image display on a real space image created via photogrammetry. J Inst. 2018;13(3):P03001. doi: 10.1088/1748-0221/13/03/P03001
- Sato Y. A concept of mirror world for radioactive working environment by interactive fusion of radiation measurement in real space and radiation visualization in virtual space. Physics Open. 2021;7:100070. doi: 10.1016/j.physo.2021.100070
- Kataoka J, Kishimoto A, Nishiyama T, et al. Handy Compton camera using 3D position-sensitive scintillators coupled with large-area monolithic MPPC arrays. Nucl Instrum Meth A. 2013;732:403–407. doi: 10.1016/j.nima.2013.07.018
- Kishimoto A, Kataoka J, Nishiyama T, et al. Performance and field tests of a handheld Compton camera using 3-D position-sensitive scintillators coupled to multi-pixel photon counter arrays. J Inst. 2014;9(11):P11025. doi: 10.1088/1748-0221/9/11/P11025
Appendix
This appendix describes the geometry and basic performance of the gamma-ray sensor setup of the Compton camera used for detecting radioactive hotspots inside the Unit 1 R/B of FDNPS. Here, we have reprinted some appendices of previous papers to provide the reader with an overview of the gamma-ray sensor setup [Citation10]. shows the photograph of the shielded gamma-ray sensor of the Compton camera used in the Unit 1 R/B of FDNPS. A 45-mm-thick lead shield surrounded the gamma-ray sensor, and the dimensions and weight of the setup are 151 mm × 141 mm × 135 mm and approximately 31 kg, respectively. The sensor setup was the same as that used in the past to analyze the radioactive contaminated filter train inside the air-conditioning room of Unit 2 R/B [Citation10].
The gamma-ray sensor of the Compton camera enclosed in the lead shield was a combination of a Ce-doped Gd3Al2Ga3O12 scintillator and multipixel photon counter (Hamamatsu Photonics K.K., Hamamatsu, Japan), which was the same as that used previously by the authors for hotspot detection at the FDNPS site [9,10,12,14]. The number of pixels in the scatterer and absorber scintillator arrays is 15 × 15 with pixel sizes of 1.5 × 1.5 × 5 mm and 1.5 × 1.5 × 10 mm, respectively. The distance between the scatterer and absorber, set to draw the Compton cones, was 23.5 mm. The gamma-ray sensor was fabricated based on the handheld Compton camera technology jointly developed by Waseda University and Hamamatsu Photonics K. K [Citation17,Citation18].
The scattering angle of gamma rays on the scatterer was estimated using the following general formula for gamma-ray Compton scattering:
Figure A1. Photograph of the shielded gamma-ray sensor of the Compton camera used for hotspot detection inside Unit 1 R/B of FDNPS. This sensor setup is the same as that used to analyze the radioactive contaminated filter train inside the air conditioning room of Unit 2 R/B; this figure is a reprinted version of Figure A1 from ref [Citation10].
![Figure A1. Photograph of the shielded gamma-ray sensor of the Compton camera used for hotspot detection inside Unit 1 R/B of FDNPS. This sensor setup is the same as that used to analyze the radioactive contaminated filter train inside the air conditioning room of Unit 2 R/B; this figure is a reprinted version of Figure A1 from ref [Citation10].](/cms/asset/457f7339-c51e-4492-a059-05a5e0089d6a/tnst_a_2282551_f0012_oc.jpg)
where θ is the gamma-ray scattering angle, Es is the energy deposited on the scatterer, and Ea is the energy of the scattered gamma rays measured at the absorber. me and c are the mass of an electron and the velocity of light, respectively. From the calculated θ and the two-hit positions on the gamma-ray sensors, a Compton cone with a radius of θ is drawn virtually in front of the gamma-ray sensor. Thereafter, radioactive hotspots are identified at the intersection of multiple Compton cones. Here, an angular dependence correction is applied when drawing the Compton cone to reconstruct the image of the radioactive hotspot. The effective FoV for the Compton camera setup is about ± 60° [Citation10]. As the gamma-ray incidence angle increases, the detection efficiency of coincidence events decreases. In particular, a 45-mm-thick lead shielding covers the gamma-ray sensor used in this study from all directions, considerably reducing the number of gamma-ray detections for oblique incidences (). Therefore, high-intensity Compton cones were drawn under large-angle conditions to compensate for this angular dependence of detection efficiency. The relationship between the counting rate of coincidence events and the gamma-ray incidence angles is shown in . Furthermore, describes the basic performance of the gamma-ray sensor setup of the Compton camera used in this work.
Figure A2. Relationship between the incidence angle of 662-keV gamma rays into the gamma-ray sensor and the number of coincidence events detected. The number of detections is normalized with 1.0 for the 0° direction. The irradiation dose rate was 3 mGy/h at the 137Cs irradiation facility. This figure is reproduced from ref [Citation10].
![Figure A2. Relationship between the incidence angle of 662-keV gamma rays into the gamma-ray sensor and the number of coincidence events detected. The number of detections is normalized with 1.0 for the 0° direction. The irradiation dose rate was 3 mGy/h at the 137Cs irradiation facility. This figure is reproduced from ref [Citation10].](/cms/asset/abc119d0-141d-4994-881f-b84b1ae1c626/tnst_a_2282551_f0013_b.gif)
Table A1. Performance of the gamma-ray sensor setup of the Compton camera used for hotspot investigation. This table is reproduced from ref [Citation10].