
 ?Mathematical formulae have been encoded as MathML and are displayed in this HTML version using MathJax in order to improve their display. Uncheck the box to turn MathJax off. This feature requires Javascript. Click on a formula to zoom.
ABSTRACT
The double differential cross-sections (DDXs) of photoneutron production via the photonuclear reaction on tantalum, tungsten, and bismuth for 16.6 MeV linearly polarized photon beam were measured using the time-of-flight method at the NewSUBARU-BL01 facility. Polarized photons were obtained by the laser Compton backscattering (LCS) technique. Two distinct components were observed on the spectra: the low-energy component up to 4 MeV and the high-energy above 4 MeV. The angular distribution of the low-energy component was isotropic, whereas the high-energy was distributed anisotropically and affected by the polarized incident photons. These distributions were similar to the previous studies on the 197Au target. The low-energy component's data were fitted with the Maxwellian function. According to the fitting results, the slopes of low-energy neutrons’ distribution for natTa and natW are similar and steeper than that of 209Bi. The anisotropy of the high-energy component can be expressed as a function of , where
is the angle between the direction of the photon polarization and neutron emission.The DDX energy integrations of the high-energy component were calculated and compared between the three targets. These integration values on natTa and natW were comparable and around 1.5 times smaller than those on 209Bi, regardless of the detection angles.
1. Introduction
High-energy photons are primarily generated as bremsstrahlung in electron accelerators. The interactions between these photons and nuclei of the materials used in the accelerator components probably release secondary neutrons (photoneutrons) via photonuclear reactions. Data on photoneutron yield, energy, and angular distribution, especially high-energy neutron production, are important for understanding not only the nuclear reaction mechanisms in physics but also for designing the shielding walls and structures of electron accelerators. Electron accelerators are widely used in engineering and medicine [Citation1].
Therefore, plenty of studies have been conducted on neutron emission, especially cross-section measurements, in photonuclear reactions using the bremsstrahlung, quasi-monoenergetic photons produced by positron annihilation in flight, and tagged photons reviewed in [Citation2,Citation3]. Majority of the cross-section has an energy dependence with peak structure at photon energy above its reaction threshold energy, in the range 13–25 MeV, called the giant dipole resonance (GDR) [Citation4]. Cross-sectional data help to estimate the neutron yield from the interaction between the photons and materials in an actual application. However, because the neutrons play a crucial role in estimating the external dose of leakage radiation, it is necessary to determine the distribution of their energies to determine their transmittance in the material, in addition to their yield. Therefore, data on the photoneutron energy spectra are necessary.
In 2019, Kirihara et al. [Citation5] studied photoneutron production on a Au target using 16.6 MeV linearly polarized photons generated using the laser Compton backscattering (LCS) technique. Neutron spectra are reported to have two distinct components: low-energy evaporation and high-energy components. This study highlights the influence of the polarization direction of incident polarized photons on the high-energy component.
Following Kirihara’s work, Tuyet et al. [Citation6] measured the photoneutron production double differential cross-section on medium and heavy targets – Pb, Au, Sn, Cu, Fe, and Ti – for 16.6 MeV linearly polarized photons. Low- and high-energy components were observed for other targets with isotropic and anisotropic distributions, respectively. The reported data can help to supplement the database of photoneutron production. In addition, the data on the natural targets of Pb, Fe, Sn, and Cu in [Citation6] are crucial for the structural and shielding design of electron accelerators.
Heavy metals such as tantalum and tungsten are frequently used in electron accelerators as collimator and target materials because of their high atomic numbers, short radiation lengths, and high melting points. These materials with low thicknesses are effective in stopping the beams. Thus, the neutron yields and spectra of these large-atomic-number materials are the primary concerns for designing effective shielding. Bismuth is a monoisotopic element with reaction Q-values, cross-sections, and mass numbers similar to those of natTa and natW. In addition, natTa and natW are well-known deformed nuclei, whereas 209Bi is a spherical nucleus. Hence, it was interesting to observe the differences in the photoneutron spectra of the three targets.
In this study, we measured the double differential cross-section (DDX) of photoneutrons on natTa, natW, and 209Bi targets at 16.6 MeV linearly polarized photon beam. The photoneutron spectra of the natTa, natW, and 209Bi targets are discussed in terms of their shape, number of high-energy components and effect of polarized incident photons on them.
2. Experiment
2.1. Experimental setup
The experiment was conducted at the NewSUBARU facility BL-01 (Hyogo, Japan). The preparation of the monoenergetic photon beam and experimental setup are the same as those described in Ref [Citation6]. We measured the photoneutron emission of three heavy targets: natTa, natW, and 209Bi. Hereafter, only an outline is provided.
The mono-energetic, horizontally polarized photon beam was produced by the collision of a polarized laser source with of wavelength 1.064 m and 982.4 MeV electrons at the backscattering angle by applying the LCS method [Citation7]. The backscattered photons were collimated with lead collimators of diameters 3 mm and 2 mm and thickness 50 cm located 13.82 m and 16.67 m from the collision point and delivered to the Optics Hatch 2. The collimators were aligned precisely 180° with respect to the collision between the electron and laser. Kirihara et al. [Citation5] reported the generated photon energy spectrum with an average energy of 16.6 MeV.
The setup of Optics Hatch 2 is shown in . By aligning the target in Hatch 2, the beam was injected into its center. lists the weight, thickness, and diameter of three cylindrical targets. The targets’ thickness was determined according to the balance between the attenuation of incident photons inside the target materials and photoneutron yield obtained via simulation. A 0.5-cm-thick plastic scintillator (PLS) was placed upstream of the target at the entrance of Hatch 2 to estimate the number of incident photons. Six liquid scintillation detectors (NE213) of diameter 12.7 cm and thickness 12.7 cm were positioned at angles of 30°, 60°, 90°, 120°, and 150° horizontally and 90° vertically with respect to the photon beam direction. The labels and flight paths of the six detectors are listed in . The photons passing through the targets moved to the beam dump area and were absorbed by the NaI(Tl) detector placed in the area. The NaI(Tl) detector was 15.0 cm in diameter and 12.5 cm in length. This NaI(Tl) was used to determine the LCS beam intensity during beam preparation.
Figure 1. Schematic plastic scintillator (PLS), target, and six neutron detectors in Optics Hatch 2.
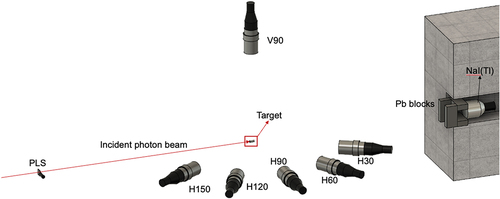
Table 1. Weight, thickness, and diameter of cylindrical targets.
Table 2. Labels and distances from center of targets to front surface of six detectors.
To acquire the data, a system including a charge-to-digital converter (QDC) module, time-to-digital converter (TDC) module, and VME controller was prepared, and the circuit diagram of which was presented in [Citation5,Citation6]. The QDC module integrates the light output signals from the detectors in the entire and tail parts at the total and slow gates, respectively. The ratios of slow to total gates were used to separate the neutrons from gamma rays using the pulse shape discrimination (PSD) technique because of the high sensitivity of NE213 to gamma radiation in the background. The TDC module recorded the time difference between the laser firing timing and signals detected by the NE213s. A constant-fraction discriminator (CFD) generates timing signals from the raw signals of the photomultiplier tubes. These signals, along with the de-multiplied radiofrequency (RF) signal used to fire the laser, were fed into a fourfold one-veto coincidence module, and a coincidence trigger was created. The coincidence trigger was used to generate a gate signal for data acquisition. The dataset was stored on a Linux PC in list mode.
During the experiment, background neutrons originating from LCS photons were checked by removing the target. Their contribution is negligible in comparison to the emission of neutrons from the target. The background neutrons can be emitted from the interaction of photons with PLS and NaI(Tl). The photonuclear reaction cross-sections for elements of PLS and NaI(Tl) are small at 16.6 MeV photon energy, except for iodine [Citation2]. The background neutrons from iodine were suppressed by shielding for NaI(Tl), as shown in .
2.2. Data analysis
The data analysis procedure used in this study was similar to that previously reported in [Citation6]. The DDXs of the photoneutrons were calculated as:
where is the neutron counting spectrum,
is the neutron energy (MeV), m is the weight of the target (g),
is Avogadro number 6.023 × 10²³ (mol−1),
is the atomic mass number of the target (g/mol),
is the radius of the target (cm) and equal to 0.5 cm for all the targets,
is the photon-attenuation correction factor in the target,
is the number of incident photons,
is the diameter of the front surface of the neutron detector and equal to 12.7 cm,
is the flight path (cm) specified in ,
is the neutron detection efficiency,
is the neutron-attenuation correction factor in the target, and
is the energy bin width (MeV) and equal to 0.4 MeV.
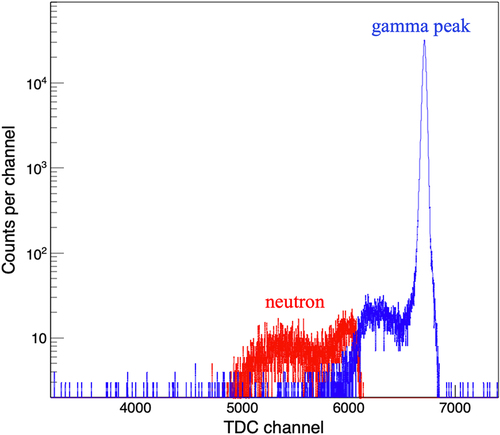
The neutron counting spectrum Y(E) was computed from the time of flight into the energy of neutron events with a light yield greater than the bias energy of 0.25 MeVee-equivalent (half of the 137Cs bias). shows the neutron-gamma separation with a bias energy of 0.25 MeVee. The horizontal and vertical axes represent the TDC channels and PSD parameter values, respectively. The TDC channel values represent the time required for the neutrons and gamma-rays to travel from the target to detector. The combination of the three parameters, light outputs of the slow and total gates, and the TDC channel help distinguish the neutrons from gamma rays. A clear separation between the neutrons and gamma events was achieved by setting boundaries for the PSD parameter and TDC channel. The time-of-flight spectra for the neutron and gamma events are shown in . The blue and red lines represent the neutron and gamma events, respectively. The difference in the speeds of the gamma rays and neutrons causes different maximum positions in the TDC channel, as shown in the TOF spectra. The contribution of background neutrons due to scattering on floor and wall was negligible because they have flight times at least twice longer than foreground neutrons and correspond to events less than the TDC channel approximately 4000. There are almost no events in this region, as shown in .
Figure 2. 2D plot of ratio of tail and total signals, defined as the PSD parameter, and TDC channel for neutron-gamma separation.
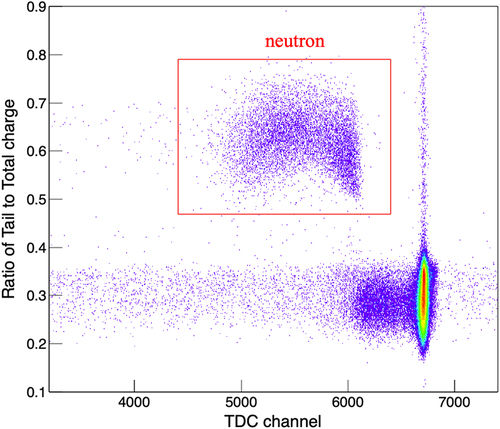
Figure 3. TOF spectrum of neutron and gamma events.
The method used to determine the number of photons was identical to that described in [Citation6]. The number of counts obtained using the PLS was used to calculate the number of incident photons . The detection efficiency of the PLS was determined using the PHITS [Citation8]. The photon-counting efficiency was 1.06% for integrating the photons with energies greater than 0.5 MeV. The uncertainty of the efficiency was estimated to be 5%. Subsequently, the number of photons was determined for each target. In this study, the photon intensity was approximately
photon/s for the data-taking runs of the targets.
The photon-attenuation, neutron-attenuation correction factor, and neutron detection efficiency of six scintillator detectors were presented in detail by Tuyet et al. [Citation6]. The photon attenuation factors for each target are listed in . The neutron attenuation factor was varied in the range 0.9–0.98. The largest attenuation was obtained at the H30 detector position for all the targets. The neutron detection efficiency of the detectors was calculated using the SCINFUL-QMD simulation [Citation9] with a correction of neutrons below 3 MeV based on the neutron measurements from the 252Cf source.
Table 3. Numerical values of photon-attenuation correction factor for all targets.
lists these uncertainties and their corresponding values. The statistical uncertainty of neutron counting, which varied from 4% to 15%, was determined as the square root of the count. The uncertainty in the number of LCS photons involves the statistical factors and energy resolution of PLS when calibrating PHITS calculation and PLS pulse height spectrum. The solid angle, which can be affected by the measurement of the distance from the target to the detectors, had a degree of uncertainty of 0.2%. The detection efficiency had an uncertainty of 5%, representing the accuracy of SCINFUL-QMD code.
Table 4. List of uncertainties and their values.
3. Results and discussions
3.1. Double differential cross-sections (DDXs)
shows the DDX results of the (γ, xn) reaction on the natTa, natW, and 209Bi targets at 16.6 MeV horizontally polarized photons at angles 30°, 60°, 90°, 120°, and 150° horizontal and 90° vertical with respect to the incident photon beam direction. The six neutron detectors were labeled H30, H60, H90, H120, H150, and V90.
Figure 4. Experimental results of DDX of (, xn) reaction on natTa, natW, and 209Bi targets at 16.6 MeV horizontally polarized photons.
The minimum energy of obtained photoneutrons was 2.4 MeV. The value mainly comes from the setting of CFD threshold that makes detection efficiencies low for neutrons below the energy. The maximum theoretical energy of the neutrons, , listed in , is the energy difference between the incident photons, and the absolute Q-values of the photonuclear reaction [Citation10] varied for each target. However, the upper limits of the neutron energy shown in were slightly higher than the maximum theoretical energy owing to the effect of the neutron energy resolution. The energy resolution changes with energy and was of the order of approximately 5% at 2 MeV and 11% at 10 MeV.
Table 5. Threshold and theoretical maximum neutron energy for different targets.
Two components were observed in the DDX spectra: a low-energy component below 4 MeV and high-energy component above approximately 4 MeV. The energy distribution of the low-energy component was closely isotropic and similar to that of the Maxwellian distribution. The slight variations in the DDX of the low-energy neutrons between the six positions were owing to the uncertainties listed in . The isotropic distribution of low-energy photons was owing to the emissions from the evaporation process [Citation11].
Neutrons in the high-energy component are strongly impacted by the polarized photons [Citation5]. The highest and lowest neutron yields were obtained at the H90 and V90 detector positions, respectively, because of the horizontal polarization direction of the incident photons. The neutron emission strongly depended on the emission angle owing to the polarization direction of the incident photons, same as on 197Au [Citation4].
The data of photoneutrons, from 2.4 to 4 MeV, were fitted to the Maxwellian function to determine the exact separation point for the two components. shows the ratio of the experimental data at H90 to the Maxwell fitting results for all the targets. The ratio varies around 1.0 for energies up to 4 MeV. A similar tendency was observed for other detector angles. Thus, the low-energy component was determined to range from the minimum energy to 4 MeV, and the remaining component was the high-energy component. Detailed analyses of these two components are presented in the following sections.
Figure 5. Ratio of experimental data to Maxwell fitting function for all targets at H90 detector.
3.2. Low-energy photoneutron component
The low-energy components occupying the region from the minimum energy to 4 MeV are well known to be produced by the evaporation process. Therefore, it is typically referred to as the evaporation spectrum. The low-energy component can be described by a Maxwellian distribution as [Citation12]:
where is the nuclear temperature in MeV, which is characteristic of a particular target nucleus and its excitation state.
shows the fit of the low-energy component’s data for natTa, natW, and 209Bi targets at 16.6 MeV photon energy using the Maxwellian function, represented by solid red lines. lists the parameters from the Maxwellian distribution for all the targets. The
parameters are connected to the slope of the low-energy component’s distribution. Variations in temperature parameters across different detector angles can be attributed to a lack of low-energy neutron data and inherent experimental uncertainties. There is a need for additional data on neutrons with energies below 2.4 MeV. It can enhance the precision of the Maxwellian fit and allow for a more accurate determination of the nuclear temperature for each target. Regarding the nuclear temperatures of natTa and natW, they closely resemble each other and are lower than that of 209Bi. In other words, the slopes of low-energy neutrons’ distribution for natTa and natW are similar and steeper than that of 209Bi.
Figure 6. Maxwellian fitting for photoneutron data on natTa, natW, and 209Bi for 16.6 MeV photon energy at H90 emission angle.
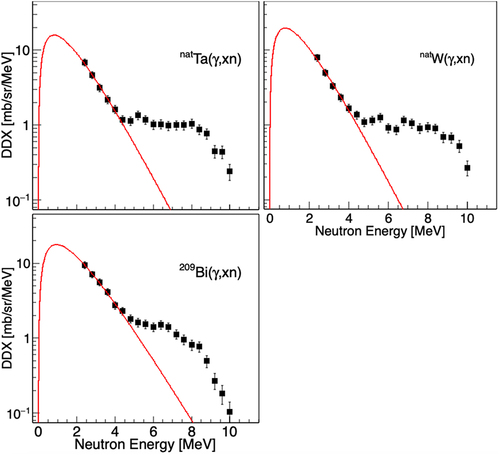
Table 6. Numerical values of nuclear temperature (MeV) for all the targets.
3.3. High-energy photoneutron component
The high-energy component consists of neutrons above 4 MeV for the natTa, natW, and 209Bi targets and are presented in Section 3.1.
Kirihara et al. [Citation5] found that the intensity of high-energy photoneutron emission on 197Au for 16.6 MeV photons was affected by the polarization direction of the polarized incident photons. The same effect was observed for the natTa, natW, and 209Bi targets at the same photon energy, as shown in . The angles of the photon polarization and neutron emission directions were considered to analyze the polarization effect. shows the relationship between the incident photons, polarization, and neutron emission directions. Horizontally polarized photons were used in this experiment. Thus, the polarization direction was in the plane of the incident photon direction with φ values of 0° and 90° for the horizontal and vertical detectors, respectively.
Figure 7. Relationship between incident photon direction and neutron emission direction [Citation5].
![Figure 7. Relationship between incident photon direction and neutron emission direction [Citation5].](/cms/asset/28bb73ca-961e-4979-9da4-f09a3f81b07e/tnst_a_2295438_f0007_b.gif)
The relationship of the three angles ,
, and
can be expressed as:
The values of were obtained from
and
for the six detectors, as detailed in . lists the DDX energy integration of high-energy neutrons, from 4.4 MeV to the maximum energy, for six detectors at 16.6 MeV photons. The DDX energy integration is denoted by the angular differential cross-section (ADX).
Table 7. Values of ,
, and
.
Table 8. DDX energy integration (ADX) of high-energy component.
As indicated in [Citation5], the integrated values of the photoneutron yield at energies greater than 4 MeV – also known as ADX in this study – can be expressed as a function of the angle Θ between the photon polarization and neutron emission, as follows:
where and
denote fitting parameters differing for each target, as listed in .
Table 9. Numerical values of and
parameters.
According to the data presented in , H90 and V90 were the highest and lowest ADX values, respectively, in the high-energy neutron spectra. The ADX values of the detectors with the same are close to each other, such as H30 and H150 with
values of 60°. In other words, the ADX values in satisfy EquationEquation 4
(4)
(4) , describing the angular distribution of the high-energy component.
The ADX values for the natTa and natW targets are comparable and approximately 1.5 times lower than those on the 209Bi targets, regardless of the emission angles. In other words, fewer high-energy photoneutrons are produced on the natTa and natW targets. It provides relatively useful information for shielding against high-energy neutrons because natTa and natW are materials, which are mainly used for collimators and targets in high-energy electron accelerators.
4. Conclusion
We measured the DDXs of the neutron emission from the photonuclear reaction on natTa, natW, and 209Bi targets at 16.6 MeV linearly polarized photon beam. Two components were observed in the energy spectra: a low-energy component up to 4 MeV and high-energy component above 4 MeV. The minimum measured neutron energy was 2.4 MeV.
The low-energy photoneutron components produced by evaporation were distributed isotropically. This component aligns with the Maxwellian distribution. The slopes of low-energy neutrons’ distribution for natTa and natW are similar and steeper than that of 209Bi.
The high-energy component is distributed anisotropically. This anisotropy can be expressed as a function of the angle between the photon polarization and neutron emission. The use of a horizontally polarized photon beam result in the highest and lowest yields of high-energy photons at detector angles parallel and perpendicular to the polarization direction of the incident photons, respectively. The high-energy photoneutron yields of the natTa and natW targets were found to be approximately 1.5 times less than those of the Bi target at every angle. It provides significant information for shielding against high-energy photons because natTa and natW are materials, which are mainly used for collimators and targets in high-energy electron accelerators. Data on photoneutrons below 2.4 MeV are one of our concerns for understanding the relationship between the low- and high-energy components.
Acknowledgments
This work was supported by JSPS KAKENHI, Japan Grant Number JP20K12487. We would like to thank all the staff who work at the NewSUBARU synchrotron radiation research facility for their help.
Disclosure statement
No potential conflict of interest was reported by the author(s).
Additional information
Funding
References
- Cleland MR. Industrial applications of electron accelerators. CERN Accelerator School. Geneva: CERN; 2006.
- Handbook on photonuclear data for applications cross-sections and spectra. TECDOC series 1178. Vienna: International atomic energy agency; 2000. https://www.iaea.org/publications/6043/handbook-on-photonuclear-data-for-applications-cross-sections-and-spectra
- Mutchler GS. The angular distributions and energy spectra of photoneutrons from heavy elements. Cambridge: Massachusetts Institute of Technology; 1966.
- Baranger M, Vogt E, editors Advances in nuclear physics. In: The giant dipole resonance. Vol. 2, New York (NY): Springer; 1969. p. 1–78.
- Kirihara Y, Nakashima H, Sanami T, et al. Neutron emission spectrum from gold excited with 16.6 MeV linearly polarized monoenergetic photons. J Nucl Sci Technol. 2020;57(4):444–456. doi: 10.1080/00223131.2019.1691073
- Tuyet TK, Sanami T, Yamazaki H, et al. Energy and angular distribution of photo-neutrons for 16.6 MeV polarized photon on medium–heavy targets. Nucl Instrum Meth A. 2021;989:164965. doi: 10.1016/j.nima.2020.164965
- Miyamoto S, Asano Y, Amano S, et al. Laser Compton back-scattering gamma-ray beamline on NewSUBARU. Rad Meas. 2006;41:179–185. doi: 10.1016/j.radmeas.2007.01.013
- Sato T, Nitta K, Matsuda N, et al. Particle and heavy ion transport code system, PHITS, version 2.52. J Nucl Sci Technol. 2013;50(9):913–923. doi: 10.1080/00223131.2013.814553
- Satoh D, Sato T, Shigyo N et al. SCINFUL-QMD: Monte Carlo based computer code to calculate response function and detection efficiency of a liquid organic scintillator for neutron energies up to 3 GeV. JAEA-Data/Code. 2006:23:2006.
- Varlamov AV, Varlamov VV, Rudenko DS Atlas of giant dipole resonances. Parameters and graphs of photonuclear reaction cross sections. IAEA Tech Rep INDC(NDS)-394. IAEA; 1999.
- Gayther DB, Goode PD. Neutron energy spectra and angular distributions from targets bombarded by 45 MeV electrons. J Nucl Energy. 1967;21(9):733–747. doi: 10.1016/0022-3107(67)90109-8
- Sari A. Characterization of photoneutron fluxes emitted by electron accelerators in the 4–20 MeV range using monte carlo codes: a critical review. Ap Rad And Iso. 2022;191:110506. doi: 10.1016/j.apradiso.2022.110506