
 ?Mathematical formulae have been encoded as MathML and are displayed in this HTML version using MathJax in order to improve their display. Uncheck the box to turn MathJax off. This feature requires Javascript. Click on a formula to zoom.
ABSTRACT
Plate-type fuel elements, widely used in high flux reactor (HFR), may experience collapse or vibration under high coolant flow rates. The study examined the behaviors of curved fuel plates under varying coolant velocities. The deformations of curved plates with varying curvature radii and flat-plate assemblies were computed to facilitate comparison. The fluid domain was simulated using Ansys Fluent, while the solid domain was analyzed using Ansys Mechanical. The study employed a partitioned, two-way, and explicit coupling strategy. The simulation results have shown that the critical velocity for assemblies of curved plates is 20 m/s, whereas for flat plates it is 6 m/s. As the curvature radius or width increases, the plates become increasingly susceptible to collapse. The critical velocity is associated with the nonlinearity between the maximum plate deflections and the square of flow velocities. It also involves plate deflections that extend from the leading edges to the entire length of the fuel at the critical velocity. Under axial flow conditions, the deflection directions of multiple curved plates exhibit regular patterns. The leading edges of the plates adjacent to the walls deflect towards the walls, while the adjacent plates deflect in opposite directions.
1. Introduction
The plate fuel assembly has garnered significant attention from researchers and requires thorough investigation. While the cylindrical shell fuel assembly is more prevalent in pressurized water reactor nuclear power plants, plate-type fuel elements are primarily utilized in research reactors, such as high flux reactors (HFRs). It is essential to have them in HFRs in order to decrease the quantity of moderator water in the reactor core, thereby sustaining a high fast neutron flux. Simultaneously, it is necessary to dissipate fission heat, which is why the fuel assembly and coolant flow channels are designed with thin layers to prevent overheating. As a result, HFR utilizes plate-type fuel elements. However, thin shell-type fuel elements may experience deflection or vibration under conditions of high coolant velocity. When the velocity of the coolant exceeds the critical value, plate-type fuel elements will deflect excessively, impeding the passage of coolant. This prevents effective heat exchange and may lead to overheating.
Since 1948, numerous researchers have investigated the instability of plate-type fuel elements when subjected to axial flow conditions. Stromquist and Sisman [Citation1] suggested that the plates may experience buckling and collapse under certain extreme conditions, such as high coolant velocity and inadequate constraints at the plate ends. Doan [Citation2] performed a qualitative analysis of the critical flow field related to the onset of plastic deformation in fuel shells. Miller [Citation3] derived the first widely used analytical critical velocity equation for flat-plate and curved-plate flows. Miller’s equation is used to predict the velocity at which parallel-plate assemblies collapse. Miller’s equation overestimated the critical velocity due to its failure to account for the deformations caused by shear forces [Citation4]. Since then, numerous researchers have developed more precise and intricate theoretical equations for critical velocity. Johansson and Scavuzzo expanded upon Miller’s research by considering the redistribution of flow and the pressure drops resulting from friction within the channel [Citation5,Citation6]. Wambsganss [Citation7] considered the second-order effects. Jensen and Marcum [Citation8] incorporated the flexural stiffness into Miller’s velocity formulation. Kim and Davis [Citation9] introduced the concept of critical divergence velocity, which is 1.2 times Miller’s critical velocity, and critical resonant velocity, which is 2 times Miller’s critical velocity. At the critical divergence velocity, the elastic restoring force of the plates becomes less than the fluid force, leading to the collapse of the plates. At the critical resonant velocity, the natural frequency of plates in the fluid coincides with the exciting frequency.
Plate-type fuel elements under axial flow conditions have been the subject of extensive experimental research by numerous scholars. Groninger and Kane [Citation10] observed that adjacent plates exhibit opposite movements at high flow rates. It is noteworthy that plates exhibit high-amplitude and high-frequency vibrations when the flow rate is twice Miller’s critical velocity. Smissaert [Citation11,Citation12] observed that the plate undergoes wave-like deformation at low flow rates, and experiences high-amplitude flutter vibration at water velocities twice Miller’s critical velocity. In certain experiments, collapse occurred at flow rates below the critical velocity predicted by Miller [Citation5,Citation10,Citation11,Citation13–16]. Ho et al. [Citation17] observed that when the flow rate reaches 78% of Miller’s critical velocity, it leads to the collapse of plates. Similarly, Castro et al. [Citation18] reported that plates collapse at 85.5% of Miller’s critical velocity. They also introduced a method for characterizing plate collapse.
The advancement of computer technology and fluid-structure interaction (FSI) algorithm has made numerical simulations more cost-effective and capable of offering more comprehensive details compared to experimental methods. Curtis et al. [Citation19] demonstrated that the use of COMSOL with a fully-coupled implicit solver enables accurate calculation of the behavior of plates subjected to axial flow. Additionally, they found that a fully coupled monolithic solver can effectively capture the behavior of structures experiencing large deflections [Citation20]. González et al. [Citation21] conducted a simulation of two flat plates subjected to axial flow conditions by integrating Ansys CFX and Ansys Mechanical. The observed behavior closely aligned with that predicted by previous experimental and theoretical studies. González’s study revealed a linear relationship between the maximum deflection and the square of the water velocity, when the velocity is less than Miller’s critical velocity. At water velocities exceeding Miller’s critical velocity, nonlinearity was observed, indicating structural changes in the plates. González et al. [Citation22] validated their numerical model and determined that the k-ε model was the most appropriate turbulence model. Subsequently, González et al. [Citation23,Citation24] conducted a numerical study to investigate the impact of manufacturing deviations, system temperatures, and support comb on the behavior of flat-plate assemblies. The simulation also includes involute plates to examine structural deflection [Citation25–27]. Wang et al. [Citation28] conducted a numerical simulation to analyze the response of circular arc plates to axial flow conditions, utilizing a coupling of Ansys Fluent and Ansys Mechanical. Their simulation revealed a valley-like deformation, which is consistent with the findings of Jesse [Citation29] and Rivers [Citation30], who also integrated Star-CCM+ and ABAQUS in their simulations.
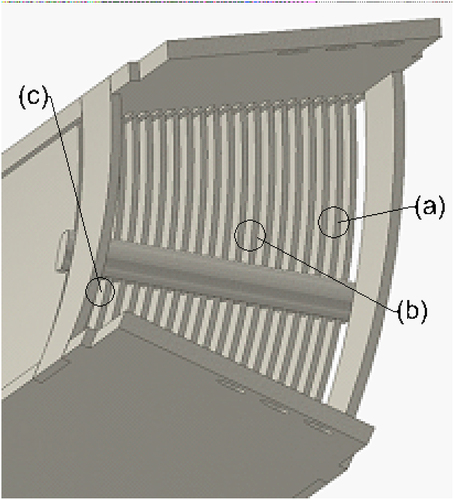
The fuel assembly of Tsinghua high flux reactors (THFRs) is comprised of a sequence of coaxial circular arc plates, as illustrated in . The fuel elements have the potential to collapse under high coolant velocity, thereby obstructing the flow of coolant. The study numerically simulates the deformation behaviors of fuel plates under varying inlet coolant velocities. The deformation response of the flat-plate assembly is also simulated for the purpose of comparison. The study simulates circular arc plates with varying curvature radii to investigate the impact of curvature radius on deformation behaviors. In order to investigate the deformation patterns of multiple plates, simulations were conducted for both a three-plate model and a four-plate model.
Figure 1. Structural configuration of HFR fuel assembly.
2. Analysis methods
2.1. Model description
The fuel assembly of THFR is comprised of a sequence of coaxial circular arc plates. The two plates located on the periphery of the fuel assembly have been chosen for the simulation due to their increased susceptibility to collapse compared to the other plates.
The computational model comprises two circular arc plates that divide the coolant channel into three smaller channels, each with a thickness of 2 mm. The arc length of the outer plate (the plate with a larger radius) measures 106.3 mm. The dimensions of the plates are 530 mm in length and 1.5 mm in thickness. The radius of curvature of the outer plate is 213 mm. The geometric representation of the computational model for HFR fuel elements is depicted in .
Figure 2. Computational geometry of HFR fuel elements (unit: mm).
A two-flat-plate model and models with varying outer plate curvature radii are also generated for comparative analysis.
Fluid water has been selected as the fluid domain due to its use as the coolant in HFR. All walls are designed to have a smooth, no-slip surface. The turbulence model employed is the standard k-ε model. The k-ε turbulence model has been extensively utilized in studies related to confined passages, demonstrating highly accurate results [Citation31–33]. The solid material is simplified to consist solely of aluminum. The two elongated sides of the plates are secured in place.
2.2. Fluid-structure interaction (FSI) setup
FSI involves the solution of the fluid domain and solid domain, as well as the transfer of data between them. The load on the structure in the fluid domain is computed and then transferred to the solid domain, where the deformation of the structure is calculated and subsequently transferred back to the fluid domain.
Finite element analysis methods can be classified as either monolithic or partitioned methods. The monolithic approach addresses FSI problems by iteratively solving a set of integrated system equations. The partitioned method involves solving the fluid domain and solid domain separately. Partitioned methods can be categorized as either one-way coupling or two-way coupling methods. The one-way coupling method exclusively transfers load from fluid domains to solid domains, disregarding the impact of structural deformations on fluid domains. In contrast, the two-way coupling method takes into account the influence of structural deformations on fluid domains [Citation34]. Two-way coupling methods can be categorized into explicit and implicit methods. In explicit methods, the transfer of data occurs between the fluid domain and solid domain only once within a time step. In contrast, implicit methods involve the repeated solving of the data transfer until the convergence criteria are satisfied within a time step. The implicit coupling approach results in increased precision, but it is also associated with a substantial increase in computational time [Citation35].
In this study, the two-way coupling method is employed due to the significant impact of structural deformations that cannot be disregarded. In order to conserve computational resources, the explicit method is employed. The fluid domain is simulated using Ansys Fluent, while the solid domain is analyzed using Ansys Mechanical.
2.3. Grid convergence check
2.3.1. Fluid domain
To assess the grid convergence of the fluid domain, three mesh sets (coarse, medium, and fine) are chosen, as illustrated in . The inlet velocity has been established at 10 m/s. The pressure drops and wall shear stresses in the small coolant channels are compared using the three mesh sets.
Table 1. Parameters of mesh in fluid domain of flat plate model and the pressure drop.
In this section, the simulations are conducted using the steady-state option. The pressure drops between medium and fine mesh differ by 0.10%, while the difference in wall shear stresses is 0.54%. The fine mesh has been chosen for the subsequent simulation.
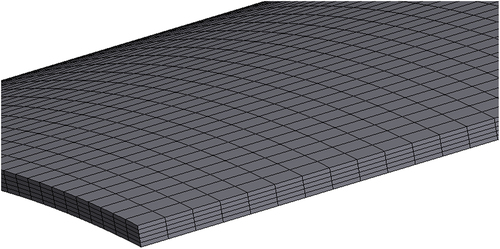
The fine mesh used for simulations are demonstrated in .
Figure 3. Representation of finely meshed model used for simulations.
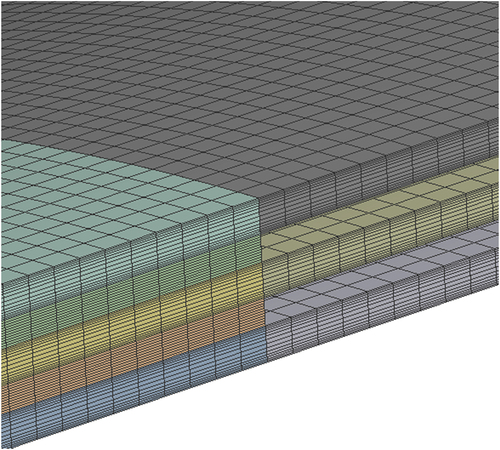
The grid convergence of the fluid model for various geometries was assessed using identical mesh sets, and the fine mesh was also chosen for the fluid model of the curved plate.
2.3.2. Solid domain
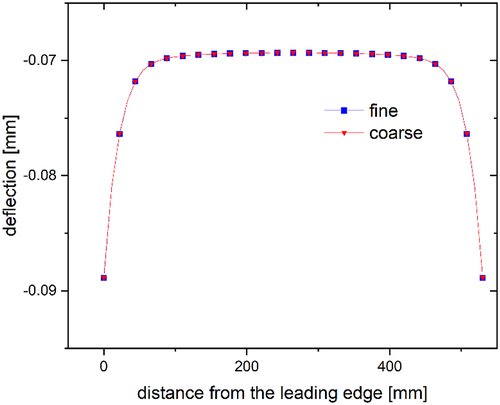
The grid convergence of the solid model was assessed by comparing the deformations of plate centerlines from various mesh sets. A uniform pressure of 0.1 MPa was exerted on the convex side of the plate, as illustrated in . Two mesh sets for the solid domain were employed, namely coarse and fine, as presented in .
Figure 4. Illustration of uniform pressure distribution across the plate surface.

Table 2. Parameters of mesh in solid domain for flat plate model.
In this section, the simulations are conducted using the static structural module in Ansys. A path was established for extracting values along the plate centerline, as illustrated in . The displacements of the centerlines of the plates in two mesh sets are depicted in . The deflection values of two mesh sets differ by less than 0.1% at each sampling point. The fine mesh has been chosen for the subsequent simulation.
Figure 5. Schematic depiction of centerline for value extraction in the model.
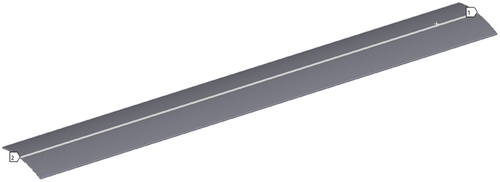
Figure 6. Plate centerline deflections under stress conditions.
The fine mesh used for simulations are demonstrated in .
Figure 7. Fine mesh used for simulations.
The grid convergence of solid domains with different geometries was assessed using identical mesh sets, and the fine mesh was also chosen.
2.4. Time step size selection
In the case of a thin plate and a thin flow channel with incompressible flow, the time step size for FSI is constrained by both a maximum and a minimum value in order to maintain stable simulation. If the time step size is either excessively large or small, it may lead to instability [Citation36,Citation37]. Consequently, the time step size should not be excessively small. Two sets of time step sizes, namely 0.1 s and 0.05 s, have been chosen for the simulation in this section, with the inlet velocity being set at 10 m/s. The total simulation duration is 1.5 s. The deflections of the plate centerlines are depicted in .
Figure 8. Plate centerline deflections at different time step sizes.
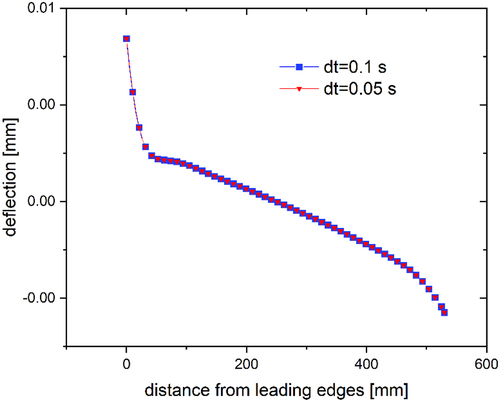
The deflection differences at each sampling point are all less than 1%. In order to conserve computational resources, a time step size of 0.1 s has been chosen.
The same procedure was applied to other geometries, and a time interval of 0.1 s was also chosen.
3. Results and discussion
3.1. Critical velocity predicted by Miller’s equation
Miller’s critical velocity of flat-plate assemblies are expressed as follows [Citation3]:
where is the plate thickness;
is the plate width;
is Young’s modulus of plates;
is the initial flow channel thickness;
is Poisson’s ratio;
is the weight density of coolant; and
is gravitational acceleration. It is important to note that
is the critical velocity of coolant in flow channel. The critical inlet water velocity is expressed as follows:
The predicted critical inlet coolant velocity of flat-plate assemblies according to Miller’s equation is 5.3 m/s.
The critical velocity of curved-plate assemblies is expressed by Miller as follows [Citation3]:
where is the curved-plate arc;
;
;
;
is the area of plate cross section;
is the area moment inertia;
is the initial curvature radius; and
is the plate chord in this study.
The predicted critical inlet coolant velocity of curved-plate assemblies, as per Miller’s equation, is 23 m/s. The designed inlet coolant velocity of THFR is 10 m/s, which indicates that the plates will not collapse as anticipated by Miller equation.
3.2. Structure deformation of flat plates
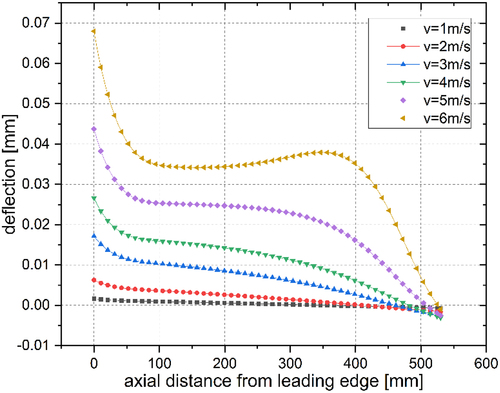
The maximum deflection of flat plates with identical dimensions to THFR fuel elements is depicted in . The maximum deflection is linearly related to the square of water velocity at flow rates below 6 m/s. At flow rates exceeding 6 m/s, there is a significant increase in the maximum deflections with the rise in inlet velocity. The correlation between the maximum deflection and the flow rate aligns with findings from previous experiments [Citation11,Citation18] and the simulation conducted by González et al. [Citation21].
Figure 9. Maximum deflection of flat plates equivalent to HFR fuel elements.
The deflections of the centerlines of flat plates under various inlet velocities are depicted in . The leading edge experiences the greatest deflection. A hump is evident near the trailing edge at an inlet velocity of 6 m/s, as observed in Smissaert’s experiment [Citation11] and González’s simulation [Citation21].
Figure 10. Flat plate centerlines deflections at different inlet velocities.
Flat plates of identical dimensions to THFR fuel elements are prone to collapsing at low flow rates, thus justifying the utilization of more rigid curved plates.
3.3. Structural deformation of curved plates at different locations of THFR core
The fuel assembly of THFR comprises fuel plates with varying radii, and consequently, varying widths, as illustrated in . In this section, the plates at three locations indicated in are subjected to simulation. The geometric representations of the computation models at (b) and (c) HFR are depicted in , respectively. The maximum deflections are presented in . The deflection profiles of the plate centerlines are depicted in . The velocity of the inlet coolant is 20 m/s.
Figure 11. Computation model geometry at (b) (unit: mm).
Figure 12. Computation model geometry at (c) (unit: mm).
Figure 13. Deflection profile of plate centerlines at different locations.
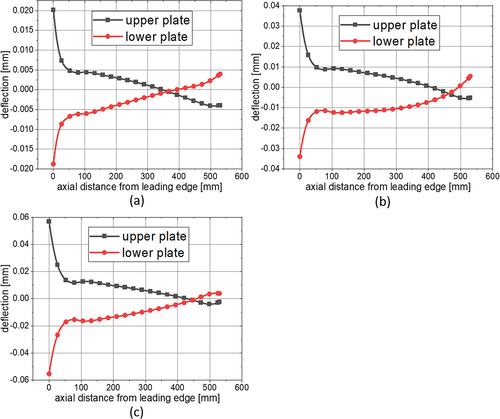
Table 3. Maximum deflection at three locations of THFR fuel assembly.
The two plates exhibited asymmetric deformation. As anticipated, the plates located at the periphery of the fuel assembly exhibited the greatest maximum deflection at the midpoint of the leading edge of the upper plate. Consequently, the two plates identified as (a) in were chosen for the subsequent simulations.
3.4. Structure deformation of curved plate fuel elements at different flow rates
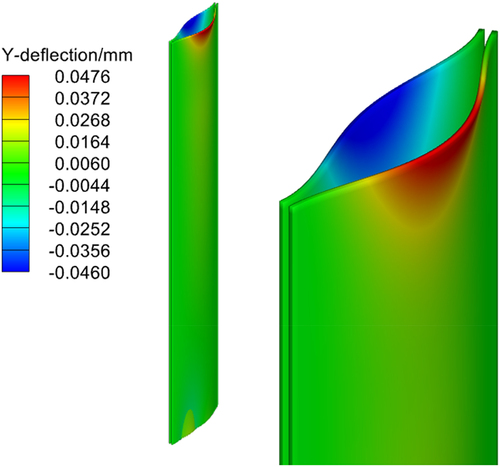
The total deflection of two curved fuel plates at an inlet velocity of 20 m/s is depicted in . The adjacent plates deflect in opposite directions, with the leading edges experiencing the greatest deflection.
Figure 14. Global and detailed perspectives of two plates deflections at inlet velocity of 20 m/s.
The maximum deflections in response to squared inlet velocities are depicted in . Only the data from the upper plate is presented in this study, as it experiences greater deformation than the lower plate and is therefore more deserving of investigation. The maximum deflection is linearly related to the square of the inlet water velocity at flow rates below 20 m/s. At flow rates exceeding 20 m/s, the maximum deflection increases rapidly with the rise in inlet velocity. The alteration in the correlation between the maximum deflection and the square of the inlet water velocity signifies the structural transformation of the plates and the point at which hydraulic instability occurs [Citation18,Citation21].
Figure 15. Maximum deflection of HFR fuel elements under axial flow conditions.
The deflections of plate centerlines under various inlet velocities are depicted in . The leading edge experiences the greatest deflection. A valley is observed near the leading edge at high inlet velocity, indicating a change in the structure. The valley is observed to have a velocity of 20 m/s, which is lower than the critical velocity estimated by Miller’s equation. At low inlet coolant velocity (below the critical value), the deflection far from the leading edge is not readily apparent and may be disregarded. Conversely, when the inlet coolant velocity is high, the deflection far from the leading edge becomes significant.
Figure 16. HFR fuel element centerline deflections at different inlet velocities. (excluding the velocity of 25 m/s in (b)).
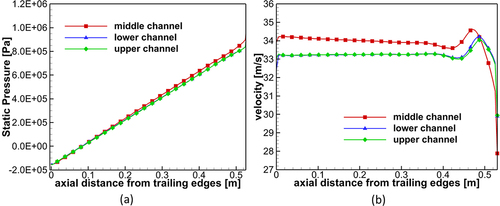
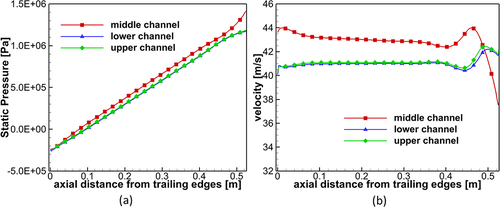
The static pressures along the three coolant channels at inlet velocities of 15 m/s, 20 m/s, and 25 m/s are depicted in respectively. The static pressure difference between the middle channels and side channels is most pronounced at the leading edges. The static pressure difference diminishes as it progresses from the leading edges to the trailing edges. The analysis of the three graphs suggests that the rate of decrease in static pressure difference slows as the inlet coolant velocity increases. This observation may provide an explanation for the occurrence of nonlinearity between the maximum deflection and the square of the inlet coolant velocity after the velocity surpasses the critical value. At low coolant velocities, only the static pressure difference near the leading edges contributes to the deformation of plates. At high coolant velocity, the decrease in static pressure difference is gradual, thereby allowing the static pressure difference far from leading edges to also contribute to the deformations of plates.
Figure 17. Static pressures (a) and velocities (b) in three coolant channels at the inlet velocity of 15 m/s.

Figure 18. Static pressures (a) and velocities (b) in three coolant channels at the inlet velocity of 20 m/s.
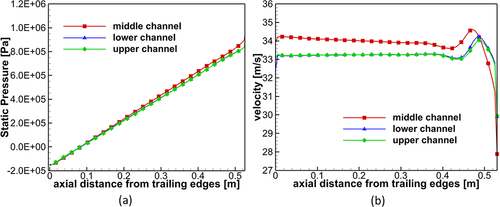
Figure 19. Static pressures (a) and velocities (b) in three coolant channels at the inlet velocity of 25 m/s.
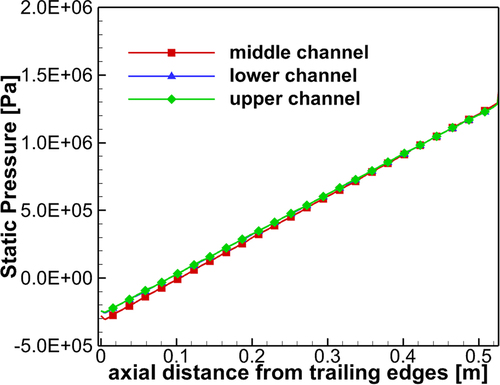
The gradual reduction in static pressure difference at elevated inlet coolant velocities could be attributed to structural deformation. A steady-state simulation was conducted at an inlet velocity of 25 m/s, and the static pressures along three coolant channels are depicted in . The static pressures of the three coolant channels exhibit similar values at their leading edges, with a slightly faster static pressure drop observed in the middle channel. The structural deformation is inferred to result in a static pressure difference between the middle channel and side channels.
Figure 20. Steady-state simulation of static pressures in three coolant channels at the inlet velocity of 25 m/s.
The velocities in three coolant channels at inlet velocities of 15 m/s, 20 m/s, and 25 m/s are depicted in respectively. Due to the deflections of the plates depicted in , the side channels contract while the middle channel expands. Consequently, the velocities adjacent to the leading edges within the lateral channels exceed the velocity within the central channel. The increase in velocity results in the conversion of static pressure to dynamic pressure in the side channels, leading to a lower static pressure in the side channels compared to the middle channel, as illustrated in . As the inlet velocity increases, the deflections of the plates also increase, leading to a greater difference in channel height between the middle channel and the side channels. Consequently, the velocity disparity between the central channel and the side channels increases, leading to a greater static pressure differential between the central channel and the side channels. As the static pressure difference near leading edges increases, a greater distance is required for it to decrease to zero.
3.5. Structure deformation of curved plates with different curvature radiuses
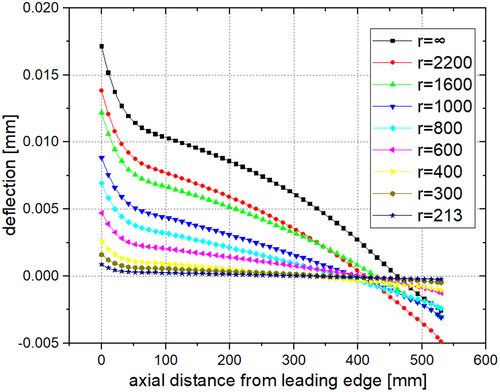
The deformations of curved plates with varying curvature radii at a velocity of 3 m/s are presented in and . The arc length or width of the upper plates is consistent. As the radius of curvature decreases, the deflection of the plates also decreases. As depicted in , it can be observed that at low curvature radii, there is a direct proportionality between the maximum deflection and the curvature radius.
Figure 21. Correlation between maximum plate deflection and different curvature radii.
Table 4. Maximum deflections in curved plates with different curvature radii at the velocity of 3 m/s.
The deflections of the centerlines of upper plates with varying curvature radii at an inlet water velocity of 3 m/s are depicted in . None of these plates collapse, and the flat plate exhibits the greatest deflection. As the radius of curvature increases, the stiffness of the plates decreases.
Figure 22. Centerline deflections of plates with different curvature radii at the inlet water velocity of 3 m/s.
presents the deformations of curved plates with varying curvature radii at a velocity of 15 m/s. The deflection of the plates diminishes as the curvature radius diminishes.
Table 5. Maximum deflections in curved plates with different curvature radii at the velocity of 15 m/s.
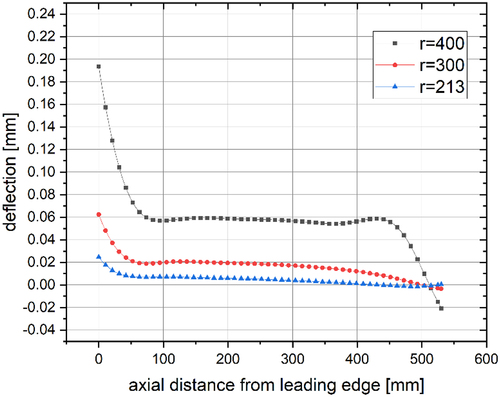
The deflections of centerlines of plates with varying curvature radii at an inlet water velocity of 15 m/s are depicted in . The plate with a curvature radius of 400 mm exhibits an increased deflection near the trailing edge and a slight valley near the leading edge, suggesting that the velocity of 15 m/s exceeds the critical velocity for this plate.
Figure 23. Centerline deflections of plates with different curvature radii at the inlet water velocity of 15 m/s.
In this section, it can be inferred that as the curvature radius decreases, plates are more susceptible to collapse.
3.6. Structural deformation of multiple curved plates
The close-up views of the structural deflections of three plain plates at an inlet coolant velocity of 3 m/s are depicted in . The leading edges of the plates adjacent to the walls exhibited deflection towards the walls, while the central plate did not show significant deflection, as illustrated in . Subsequently, the middle plate was displaced by 0.06 mm, and the simulation involving three plain plates was repeated. The middle plate exhibited deflection towards the thicker channel, as illustrated in .
Figure 24. Detailed visualization of structural deflections in three plain plates at the inlet coolant velocity of 3 m/s: (a) No offset, (b) middle plate offset of 0.06 mm.
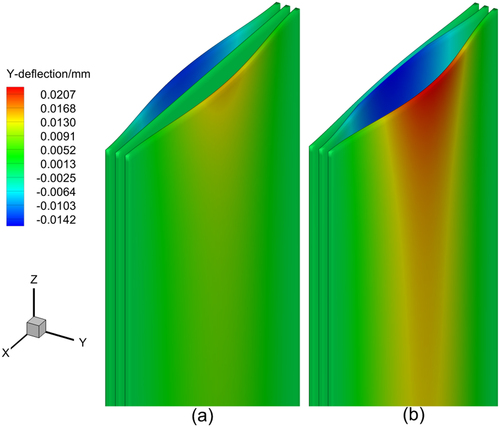
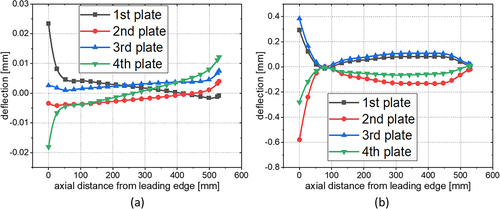
The structural deflections of three and four curved plates at an inlet coolant velocity of 15 m/s are depicted in . displays a detailed observation of the structural deflections of four curved plates at an inlet coolant velocity of 25 m/s. The deflections of the centerlines of four plates at inlet coolant velocities of 15 m/s and 25 m/s are depicted in . The middle plate of the three-plate model did not exhibit significant deflection, as depicted in . The two central plates of the four-plate model exhibited negligible deflection when subjected to a flow rate of 15 m/s, as depicted in . The intermediate two plates exhibited deflections at a flow rate of 25 m/s, as illustrated in . The leading edges of the plates adjacent to the walls deflect towards the walls, while the adjacent plates deflect in opposite directions, as expected.
Figure 25. Detailed visualization of structural deflections in curved plates at the inlet coolant velocity of 15 m/s: (a) three curved plates, (b) four curved plates.
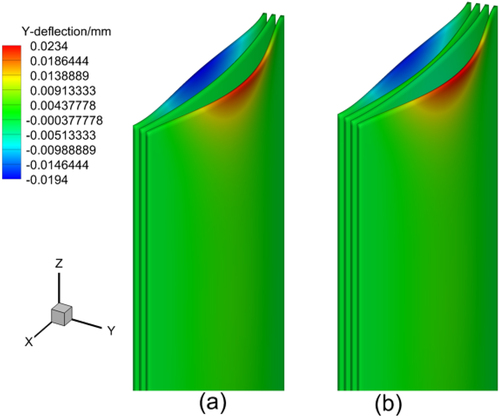
Figure 26. Detailed visualization of structural deflections in four curved plates at the inlet coolant velocity of 25 m/s.
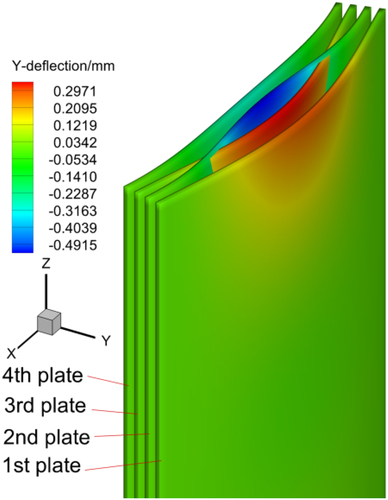
Figure 27. Centerline deflection of four plates at the inlet coolant velocity of 15 m/s (a) and 25 m/s (b).
The maximum deflections of the second and third plates under various flow rates are depicted in . The critical velocity is 22 m/s, which is greater than that of the two-plate model.
Figure 28. Maximum deflections of the second plate and third plate at different flow rates.
4. Conclusion
The study analyzed the behaviors of fuel elements in HFR core at various inlet coolant velocities. The deformations of circular arc plates with varying curvature radii and flat-plate assemblies were computed for the purpose of comparison. The fluid domain was simulated using Ansys Fluent, while the solid domain was analyzed using Ansys Mechanical. The study employed a partitioned, two-way, and explicit coupling strategy. The conclusions are as follows:
The coolant flow velocity in the majority of nuclear reactor cores with plate-type fuel designs is below 10 m/s. Under design conditions, the curved fuel plates in these reactors are not expected to collapse under axial flow conditions.
The critical velocity of curved plate assemblies (20 m/s) significantly exceeds that of flat-plate assemblies (5 m/s). As the curvature radius or width increases, the plates become increasingly susceptible to collapse.
The critical velocity is associated with the nonlinearity between the maximum plate deflections and the square of flow velocities. The nonlinearity is evident in the form of plate deflections that extend from the leading edges to the entire length of the fuel at critical velocity. This nonlinearity originates from the delayed decrease of the static pressure difference between the middle channel and the side channels.
When subjected to axial flow conditions, the deflection directions of multiple curved plates exhibit regular patterns. The leading edges of plates adjacent to the walls deflect towards the walls, while the adjacent plates deflect in opposite directions.
When the coolant flow rate reaches a critical velocity, static instability arises due to the deformation of the plates. This study did not identify any instances of vibration. The inadequate capture of vibration is attributed to the excessively large time step size, and the simulation flow rate is significantly below twice Miller’s critical value, which was identified as the critical resonant velocity. Consequently, the design of the coolant flow rate is constrained by deformation-related limits.
Further investigation is warranted to explore the nonlinearity between maximum plate deflections and the square of flow velocities above the critical value. The numerical simulation of the vibration of plate-type fuel assemblies should also be conducted. This necessitates a reduction in the time step size and a comprehensive investigation of the interaction between fluid and solid. However, a small time step size may lead to instability in the partitioned method [Citation36,Citation37]. Consequently, it is recommended that a monolithic approach be employed in future research.
Author contributions
JZ completed the majority of the tests and the paper. QZ provided the research techniques and made revisions to the manuscript. XW and LS participated in a fluid-structure coupling analysis. WG assumed responsibility for the design of the fuel assembly.
Acknowledgments
This study received funding from the Special Funds for the Key Research and Development Program of the Ministry of Science and Technology of China (Grant No. 2020YFB1901800).
Disclosure statement
The author(s) assert that they do not have any known competing financial interests or personal relationships that could have been perceived to influence the work reported in this paper.
Data availability statement
The data supporting the findings of this study are available from the corresponding author, [QZ], upon reasonable request.
Additional information
Funding
References
- Stromquist WK, Sisman O. High Flux Reactor Fuel Assemblies Vibration And Water Flow. Problem Assignment No. TX5-12. Oak Ridge(TN): Oak Ridge National Lab (ORNL); 1948. (no. ORNL-50, 4351600).
- Doan R. The engineering test reactor–A status report.Nucleonics (US) Ceased publication. 1958;16:102–105.
- Miller DR. Critical Flow Velocities For Collapse Of Reactor Parallel-Plate Fuel Assemblies. Niskayuna, NY (United States): Knolls Atomic Power Lab (KAPL); 1958. (no. 4199355).
- Miller DR. Critical flow velocities for collapse of reactor parallel-plate fuel assemblies. J Eng Power. 1960;82(2):83–91. doi: 10.1115/1.3672746
- Johansson E. Hydraulic instability of reactor parallel-plate fuel assemblies.Niskayuna, NY (United States): Knolls Atomic Power Lab.(KAPL); 1959. (no. 4221444).
- Scavuzzo RJ. Hydraulic Instability of Flat Parallel-Plate Assemblies. Nucl Sci Eng. 1965 April;21(4):463–472. doi: 10.13182/NSE65-A18790
- Wambsganss MW Jr. Second-order effects as related to critical coolant flow velocities and reactor parallel plate fuel assemblies. Nucl Eng Des. 1967;5(3):268–276. doi: 10.1016/0029-5493(67)90064-7
- Jensen P, Marcum WR. Predicting critical flow velocity leading to laminate plate collapse—flat plates. Nucl Eng Des. 2014 February;267: 71–87. doi: 10.1016/j.nucengdes.2013.11.071
- Kim G, Davis DC. Hydrodynamic instabilities in flat-plate-type fuel assemblies. Nucl Eng Des. 1995 September;158(1):1–17.
- Groninger RD, Kane JJ. Flow induced deflections of parallel flat plates. Nucl Sci Eng. 1963 June;16(2):218–226. doi: 10.13182/NSE63-A26503
- Smissaert GE. Static and dynamic hydroelastic instabilities in MTR-type fuel elements part I. introduction and experimental investigation. Nucl Eng Des. 1968 June;7(6):535–546.
- Smissaert GE. Static and dynamic hydroelastic instabilities in MTR-type fuel elements part II. Theoretical investigation and discussion. Nucl Eng Des. 1969 January;9(1):105–122.
- Smith RL. Dynamic pressure limits for flat plates as related to nuclear fuel elements. Washington, DC (WA): National Aeronautics and Space Administration; 1968. ( NASA TN; no. D-4417).
- Kennedy JC. Development and experimental benchmarking of numeric fluid structure interaction models for research reactor fuel analysis [dissertation]. Columbia(MO): University of Missouri; 2015.
- Swinson WF, Battiste RL, Yahr GT. Circular arc fuel plate stability experiments and analyses for the advanced neutron source. Oak Ridge (TN): Oak Ridge National Laboratory (ORNL); 1995. (no. TM-12977, 204253).
- Swinson WF, Yahr GT. Dynamic pressure approach to analysis of reactor fuel plate stability. American Nuclear Society annual meeting; 1990 Jun 10–14; Nashville, TN (USA). Oak Ridge(TN): Oak Ridge National Lab (ORNL); 1990.
- Ho MK , Hong G, Mack A. Experimental Investigation of Flow-Induced Vibration In a Parallel Plate Reactor Fuel-Assembly. 15th Australasian Fluid Mechanics Conference; 2004 Dec 13–17; Sydney, Australia. The University of Sydney; 2004.
- Castro AJA, Scuro NL, Andrade DA. Experimental investigation of critical velocity in a parallel plate research reactor fuel assembly. 2017 International Nuclear Atlantic Conference - INAC 2017; 2017 Oct 22–27; Belo Horizonte, Brazil. 2017.
- Curtis FG, Ekici K, Freels JD, editors. Fluid-structure interaction modeling of high-aspect ratio nuclear fuel plates using COMSOL. COMSOL Conference Boston 2013; 2013 Oct 9–11; Newton, MA. Stockholm (Sweden): COMSOL AB; 2013.
- Curtis FG, Freels JD, Ekici K. Predicting large deflections of multiplate fuel elements using a monolithic FSI approach. Nucl Sci Eng. 2018 January 2;189(1):82–92.
- González Mantecón J, Mattar Neto M. Numerical methodology for fluid-structure interaction analysis of nuclear fuel plates under axial flow conditions. Nucl Eng Des. 2018 July;333: 76–86. doi: 10.1016/j.nucengdes.2018.04.009
- González Mantecón J, Mattar Neto M, editors. Simplified CFD model of coolant channels typical of a plate-type fuel element: an exhaustive verification of the simulations. Associação Brasileira De Energia Nuclear; 2019 Oct 22–27; Belo Horizonte, MG, Brazil. 2019.
- González Mantecón J, Mattar Neto M. Numerical analysis on stability of nuclear fuel plates with inlet support comb. Nucl Eng Des. 2019 February;342: 240–248. doi: 10.1016/j.nucengdes.2018.12.009
- González Mantecón J, Mattar Neto M. Numerical investigation on the effects of geometric deviations and materials properties on flow-induced deflections of fuel plates. Ann Nucl Energy. 2020 June;140: 107118. doi: 10.1016/j.anucene.2019.107118
- Curtis FG, Freels JD, Ekici K. Deflection predictions of involute-shaped fuel plates using a fully-coupled numerical approach. Ann Nucl Energy. 2019 August;130: 184–191. doi: 10.1016/j.anucene.2019.02.001
- Luttrell C. Finite element analysis of advanced neutron source fuel plates. M-4600 . Oak Ridge(TN): Oak Ridge National Lab (ORNL). 1995.
- Sartory W. Nonlinear analysis of hydraulic buckling instability of ANS involute fuel plates.Oak Ridge, (TN): Oak ridge national Lab (ORNL); 1993. (no. TM-12319).
- Wang Y, Bian X, Wang T et al. Numerical investigation of hydraulic instability of circular arc shell-type fuel elements under axial flow conditions. Nucl Eng Des. 2023 April;405: 112185. doi: 10.1016/j.nucengdes.2023.112185
- Jesse CJ. Analysis of the potential for flow-induced deflection of nuclear reactor fuel plates under high velocity flows [master’s thesis]. Columbia(MO): University of Missouri; 2015.
- Rivers JD. A Parametric Study of a Curved Nuclear Fuel Plate in a Narrow Channel Using Numeric Fluid Structure Interaction Modeling [master’s thesis]. Columbia(MO): University of Missouri; 2017.
- DAd A, Angelo G, Angelo E, et al. A CFD numerical model for the flow distribution in a MTR fuel element. International Nuclear Atlantic Conference; 2015 Oct 4–9; São Paulo, Brazil. 2015.
- Gong D, Huang S, Wang G, et al. Heat transfer calculation on plate-type fuel assembly of high flux research reactor. Sci Technol Nucl Install. 2015 May 25; 2015;1–13.
- Salama A, El-Amin MF, Sun S. Three-dimensional, numerical investigation of flow and heat transfer in rectangular channels subject to partial blockage. Heat Transf Eng. 2015;36(2):152–165. doi: 10.1080/01457632.2014.909191
- Rao A. Fluid—solid interaction analysis using ANSYS/multiphysics. In: Computational fluid and solid mechanics 2003. Elsevier; 2003. p. 1492–1496.
- Pozarlik AK, Kok JB, editors. Numerical investigation of one-and two-way fluid-structure interaction in combustion systems. International Conference on Computational Methods for Coupled Problems in Science and Engineering; 2007 May 21–23; Santa Eulalia, Ibiza, Spain. 2007.
- Jesse CJ, Kennedy JC, Solbrekken GL, editors. Fluid-Structure Interaction (FSI) Modeling of Thin Plates. 2015.
- Förster C, Wall WA, Ramm E. Artificial added mass instabilities in sequential staggered coupling of nonlinear structures and incompressible viscous flows. Comput Methods Appl Mech Eng. 2007 January;196(7):1278–1293.