
 ?Mathematical formulae have been encoded as MathML and are displayed in this HTML version using MathJax in order to improve their display. Uncheck the box to turn MathJax off. This feature requires Javascript. Click on a formula to zoom.
ABSTRACT
This study developed a probabilistic determination model with respect to cladding high-temperature burst conditions based on the Bayesian statistical method to reasonably evaluate fuel behaviors under loss-of-coolant accident conditions, including fuel fragmentation, relocation, and dispersal. The candidate models (correlations) were based on the widely accepted empirical model established based on nonirradiated fuel cladding data. Explanatory variables were added to improve the applicability of these models with respect to irradiated materials and generalization performance. The posterior predictive distribution of each candidate model was evaluated using Bayesian estimation comprising 238 sets of high-temperature burst test data. The generalization performance was evaluated using information criteria. The results of model evaluation showed improved predictive performance by considering the effect of hydrogen content. A comparison with burnup as an alternative explanatory variable confirmed that hydrogen content was the better parameter and other burnup-associated effects, such as irradiation hardening of the metal matrix and oxide growth (reduction of the metal matrix), were less dominant under burst conditions.
KEYWORDS:
1. Introduction
When a loss-of-coolant accident (LOCA) occurs owing to a breach in the pressure boundary in a light water reactor, some fuel rods may swell and burst and the cladding tube forms an opening because of rapid reduction in coolant mass and pressure. This reduction results in the increase in fuel, cladding temperature, and rod internal pressure and decrease in cladding strength. In addition, for high-burnup fuel, a phenomenon known as fuel fragmentation, relocation, and dispersal (FFRD) has been observed [Citation1,Citation2]. Depending on conditions, such as burnup, irradiation history, and the relationship between the opening and fragmented pellet sizes, fragmented pellets may be released outside the fuel rods and/or deposited inside the cladding ballooning part [Citation3]. The released fragmented pellets may be deposited on the grid spacer or lower structure of the fuel assembly. Also, the fuel temperature of the ballooning part filled with fragmented pellets can be higher [Citation4]. Overall, FFRD may affect the coolability of the reactor core even under accident conditions that do not undergo guillotine breaks owing to embrittlement. Therefore, the importance of evaluation methodology with respect to the amount of released pellets in determining the impact of FFRD on the coolability is widely accepted and studied [Citation5].
To evaluate the amount of fragmented pellets released outside the fuel rods, various factors related to FFRD, including cladding burst occurrence, cladding opening size, cladding deformation, pellet fragmentation occurrence, fragmented pellet size, pellet restraint by cladding (suppression of fragmentation), and relocation of fragmented pellets, etc., must be studied and modeled. However, the limitations related to experimental data and the large scatter observed in the existing data make assigning an accurate model for each factor challenging.
Conservative models are frequently employed to address these data limitations and uncertainties [Citation6,Citation7]. However, using these models can result in excessive conservatism, specifically when the evaluation involves multiple model components such as FFRD. Furthermore, the output of overly conservative estimations based on over-simplified models is typically less informative regarding physics/mechanisms underlying increased risk and, thus, provides less effective feedback with respect to fuel design and plant operations.
Another approach for constructing a best-estimate model, reported in a previous study [Citation7,Citation8], to fit the existing data, typically with maximum likelihood estimation, may be an alternative to simple conservative models. The maximum likelihood estimation method is a kind of point estimations, which originally does not consider uncertainties. Some distribution should be assumed to be necessary for an interval estimation; however, it is hard to approach the distribution in some cases. For example, if sufficient experimental data exist, uncertainty distribution involved in the experimental data can be considered as Student’s t-distribution. However, capturing the uncertainty trend based on a limited experimental dataset is still challenging, as in the case of FFRD and related behaviors. Additionally, the result obtained based on maximum likelihood estimation heavily relies on the corresponding fitted data. Consideration of generalization performance and the accuracy of the fitted data are often overlooked.
In modeling fuel behavior factors related to FFRD, avoiding overfitting (avoiding using many coefficients and variables) and naturally incorporating the effects of data sparseness and scattering are necessary. Therefore, uncertainty distribution in the data should not be definitive; for example, the parameters determining the uncertainty distribution can also be described as distributions, which allows the regression equation to have distribution of uncertainty. The component model must also be applicable to code-to-code coupling operations for a core-scale calculation. The integrated system of component codes and models can then realize a predictive distribution of the whole amount of released pellets from a reactor core to determine coolability with reasonably determined uncertainty having high robustness. The Bayesian statistical method is a practical method for developing component models, whose uncertainty distribution is automatically obtained using model output.
This study develops a probabilistic evaluation model for predicting cladding burst conditions as a crucial component model needed for integrated FFRD evaluations based on the Bayesian estimation. Some candidate models were developed, and the best model was chosen based on certain factors. One candidate model was created using a well-known empirical burst model established based on nonirradiated fuel cladding data. The other models were also created based on the empirical model and aimed to consider the effects of hydrogen content and burnup as additional explanatory variables. The model parameters were estimated using Bayesian estimation, supported by numerous data points obtained based on high-temperature cladding burst tests. The performances of the developed models were evaluated using information criteria to assess their generalization performance and overfitting.
2. Method
2.1 Candidate models
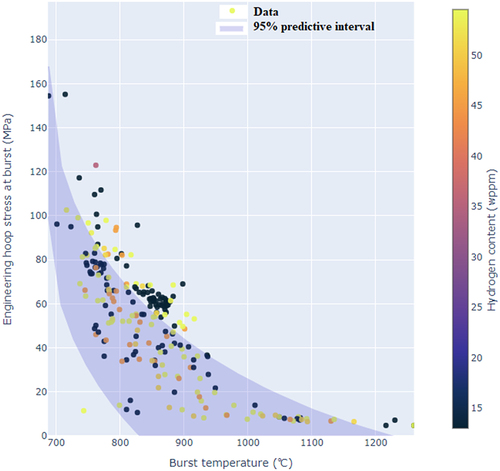
Numerous studies related to the burst behaviors of fuel cladding in LOCA conditions have been published [Citation9]. High-temperature burst conditions in claddings are effectively described using functions of engineering hoop stress related to cladding at burst and cladding surface temperature at burst ().
Figure 1. Burst temperature versus engineering hoop stress at burst related to cladding burst tests performed in studies [Citation8] and [Citation10–20] and the ORNL correlation.
![Figure 1. Burst temperature versus engineering hoop stress at burst related to cladding burst tests performed in studies [Citation8] and [Citation10–20] and the ORNL correlation.](/cms/asset/aafcbeab-7a64-4646-8540-a929336902ac/tnst_a_2321342_f0001_oc.jpg)
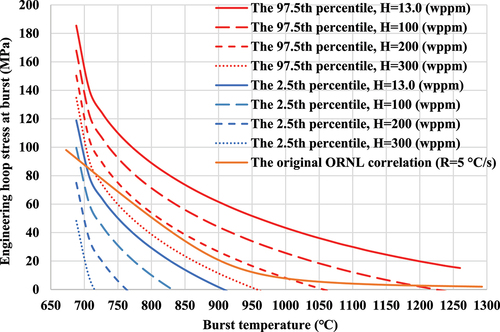
The blue plots in show 238 sets of high-temperature burst tests. The effects of ramp rates, heating conditions, and atmospheres have been examined in preceding studies; however, data regarding high-burnup materials is insufficient [Citation8] and [Citation10–20]. Chapman of Oak Ridge National Laboratory (ORNL) [Citation8] developed a burst temperature correlation derived from test data related to nonirradiated materials, which is also a function of ramp rate, as expressed in (EquationEq. 1(1)
(1) )
where is the surface temperature of cladding at burst,
is the engineering hoop stress of cladding at burst, and
is the ramp rate, with an applicable range of 0–28. The three lines shown in represent the model prediction of EquationEq. 1
(1)
(1) with respect to the ramp rates of 0, 10, and 28.
While this model exhibits a specific performance in estimating the burst condition, the remaining discrepancy between the experimental data points and correlations can be reduced further. For instance, studies conducted at the Argonne National Laboratory (ANL) indicated that a high level of hydrogen content in the fuel cladding tubes of Zry-2 and ZIRLO (one of advanced Zr-based alloy fuel cladding tubes) affects burst conditions [Citation21,Citation22]. These studies by ANL include two kinds of non-irradiated samples: as-received and prehydrided fuel cladding tubes. The burst tests in their studies were thus conducted with as-received, prehydrided and irradiated fuel cladding tubes. The Japan Atomic Energy Agency (JAEA) studies confirm a similar trend using Zry-2, Zry-4 and some kinds of advanced Zr-based alloy fuel cladding tubes [Citation23–25] (). The pressure information in means the internal rod pressure at the beginning of each burst test. shows that hydrogen content affects the burst temperature. The remaining discrepancy observed in can be considerably reduced by introducing hydrogen content as an explanatory variable in Bayesian estimation, especially if sufficient supporting data becomes available. The abovementioned studies do not provide direct input to this study, which used cladding hoop stress level at the burst occurrence as the primary figure of merit.
Figure 2. Burst temperature versus hydrogen content in cladding burst tests performed by ANL and JAEA [Citation21–25].
![Figure 2. Burst temperature versus hydrogen content in cladding burst tests performed by ANL and JAEA [Citation21–25].](/cms/asset/60b31608-d99e-4afa-99f9-ad241c9746d7/tnst_a_2321342_f0002_oc.jpg)
(1) The origin-based ORNL correlation
This study used Bayesian estimation in cases of some candidate models to predict burst conditions prepared based on EquationEq. 1(1)
(1) , with additional variables. Because using the mechanical response of the cladding tube as the output of the prediction model is more straightforward than using the burst temperature in the context of LOCA analyses, EquationEq. 1
(1)
(1) is first solved for the cladding hoop stress at burst, with a slight change in the formulation to realize numerical stability. The unit of the engineering hoop stress of the cladding at burst,
, is converted to σ (MPa) for convenience, and the coefficients and exponents of the factors (T and R, respectively) are partially simplified, as described in EquationEq. 2
(2)
(2) .
where the coefficients C1–3 and the intercept I are to be estimated using the Bayesian estimation. The intercept in this Bayesian statistical process effectively works as a residual error term, which means that it is challenging for the error to be reduced by other terms, including T and R because the error is not caused by a physics-based reason, for example. EquationEq. 2(2)
(2) is further refined to EquationEq. 3
(3)
(3) (the origin-based ORNL correlation), which is one of the candidate models.
where all the explanatory variables in EquationEq. 3(3)
(3) (R and T) are calculated using the z-score, which is a scaled value that ensures the mean value of each variable is zero and the standard deviation (SD) is one for computational stability. Then, depending on the data, the values of the variables can be negative. The minimum values of ramp rate
, and burst temperature
are introduced to avoid the complicated calculations related to the exponent of negative values with decimals.
(2) The modified ORNL correlation combined with the FRAPCON-3.4 model
We consider other candidate models to develop a better model with reduced uncertainty and avoid overfitting. Since EquationEq. 3(3)
(3) refers to the equation derived initially from nonirradiated material and does not cover the effect of hydrogen content, it is natural for the newly developed model to increase the number of explanatory variables. Therefore, second candidate model includes hydrogen content
in addition to EquationEq. 3
(3)
(3) , called the modified ORNL correlation (EquationEq. 4
(4)
(4) ) in this study,
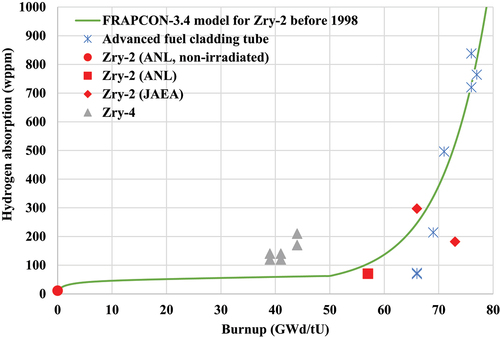
Since the database compiled in this study includes only a small portion of datasets with H, we apply some well-established empirical correlations describing burnup-dependent hydrogen absorption. The high-temperature burst tests shown in primarily comprise Zircaloy-2 and −4 (Zry-2 and −4) cladding tubes. Although hydrogen absorption for Zry-4 is generally described as the combination of the oxide layer growth and hydrogen pick-up ratio, such a two-step approach adds complexity and, thus, the convergence problem in Bayesian estimation process. The simple FRAPCON-3.4 model developed for Zry-2 before 1998 (EquationEq. 5(5)
(5) ) [Citation26], which is a function of burnup
(GWd/tU), is hence applied,
compares EquationEq. 5(5)
(5) and the data given in , for which the prehydrided sample data are excluded from the comparison. EquationEq. 5
(5)
(5) roughly follows the experimental data trends, including Zry-2 and −4 data. The burnup
was assumed to be zero for a few datasets whose sample preparation conditions were not identified from the literature.
Figure 3. Comparison between the FRAPCON-3.4 model and as-received and irradiated cladding tubes.
For a linear regression with parametric Bayesian estimation, this study assumes that the error ϵ between the solution of the regression equation σ and the measured value follows a normal distribution. The relationship is then expressed in EquationEqs. 6
(6)
(6) and Equation7
(7)
(7) ,
where is standard deviation. Namely, the distribution of the experimental results follows as EquationEq. 8
(8)
(8) ,
(3) The nonparametric model with the ramp rate, burst temperature, and hydrogen content
The nonparametric model defined as EquationEq. 9(9)
(9) does not have a specific equation form like EquationEq. 3
(3)
(3) . This nonparametric model was used to verify the possibility that the formulation of EquationEq. 3
(3)
(3) might already be overfitting for nonirradiated material and deteriorate the prediction performance for irradiated material. The number of explanatory variables in EquationEq. 9
(9)
(9) is the same as in EquationEq. 4
(4)
(4) , and the Gaussian process, described later, performs the estimation,
The above formulas of EquationEqs. 3(3)
(3) and Equation4
(4)
(4) are the basic candidate models, and EquationEq. 9
(9)
(9) is the additional verification model for a critical assessment.
The nonparametric model (EquationEq. 9(9)
(9) ) adopts the Gaussian process using a multivariate normal distribution (EquationEq. 10
(10)
(10) ). The factor X in EquationEq. 10
(10)
(10) represents the input vector at which a prediction is made, and X′ represents the input vectors from the training dataset. The Gaussian kernel formula
shown in EquationEq. 11
(11)
(11) describes the similarity between the data (
and
), which is the essence of the Gaussian process to give an infinite-dimensional Gaussian distribution for the input. The parameters in the kernel function θ1,2,3 are also to be calculated in the Bayesian estimation.
The Bayesian estimation method first requires prior distributions to each parameter, and the distributions are updated based on the database (Bayesian update) to obtain the posterior distributions. The parameters to be estimated using the Bayesian method are in EquationEqs. 3
(3)
(3) and Equation4
(4)
(4) , I, SD, and
in EquationEq. 11
(11)
(11) . This study assumes all prior distributions of
in EquationEqs. 3
(3)
(3) and Equation4
(4)
(4) , I, SD, and
in EquationEq. 11
(11)
(11) to be an uninformative uniform distribution. Since many kinds of experimental errors generally follow Gaussian distributions, using the distributions as the prior distributions is likely valid and additionally has the advantage that iterative calculations during Bayesian estimation are more likely to converge. Meanwhile, the uniform distribution is a more careful or conservative approach because it is the assumption that best eliminates the subjectivity and bias of an estimator. The uniform distribution is chosen because it is the first time to apply the Bayesian estimation method to determine cladding burst condition, and convergence problems didn’t occur even using the uniform distribution.
Since it is generally difficult to obtain the analytical results of integral calculations associated with the Bayesian updating, the No-U-Turn Sampler (NUTS) method, a Markov Chain Monte Carlo (MCMC) method, becomes a solution [Citation27]. The specific computational tool is the programming language Stan, which implements the NUTS method as a standard algorithm and is called from PyStan, a library for Python [Citation28]. The identical database was applied to the candidate models (EquationEqs. 3(3)
(3) and Equation4
(4)
(4) ) and the verification model (EquationEq. 9
(9)
(9) ).
2.2 Evaluation method
The widely applicable information criterion (WAIC) [Citation29] and the leave-one-out cross-validation (LOOCV) [Citation30] methods are adopted to evaluate the generalization performance of the candidate models. Although the widely applicable Bayesian information criterion (WBIC) is as popular as WAIC, WBIC is generally accepted as a measure of the fitness of a created model with respect to existing data. Using WBIC for evaluating the candidate models presented in this study is not desirable because most of the tests are performed using low burnup rods. Because the primary focus of this study is regarding the applicability of the models toward FFRD-related evaluation, evaluating the generalization performance with respect to the sparse data region at high burnup is necessary. The WAIC and LOOCV are thus better suited.
It is defined in the WAIC that a difference between a generalization loss (an inverse of the generalization performance) and an empirical loss E (EquationEq. 12(12)
(12) ) can be expressed as the functional variance V (EquationEq. 13
(13)
(13) ) divided by the number of data n. The WAIC is shown in EquationEq. 14
(14)
(14) ,
where is the predictive distribution,
is the data,
is the parameter subjected to the Bayesian estimation, and
is the expected value over
. The empirical loss means the unfitness of the created model for the existing data, and the functional variance divided by n means the effect of uncertainties caused by unknown data.
In LOOCV, one test is once removed from the entire test, and all remaining tests are used for training. Namely, the omitted one is regarded as unknown and used for evaluating the fitness of the trained model. Each test receives the removal treatment, and the average value of such evaluations is defined as the LOOCV value. This study uses the importance-sampling cross-validation: an approximated LOOCV method frequently used in a Bayesian estimation for reducing computation time [Citation31]. EquationEq. 15(15)
(15) expresses the approximated method,
We evaluated the WAIC and LOOCV for double-checking. Lower values indicate increased generalization performance. The WAIC and LOOCV evaluated values are known to become asymptotically equivalent [Citation29]. If the two evaluations give far different results, there could be problems with the quality and/or quantity of data.
3. Results & discussion
The convergence of the posterior distributions estimated using MCMC sampling was confirmed based on the Gelman – Rubin statistic (Rhat) [Citation32], which is also employed in PyStan. When Rhat is close to 1.0, it means that the Markov Chain properly converges to a steady state. Herein, all parameters in each model subjected to Bayesian estimation were equal to 1.0 at Rhat; thus, this study could realize valid posterior distributions.
3.1. Uncertainty distributions
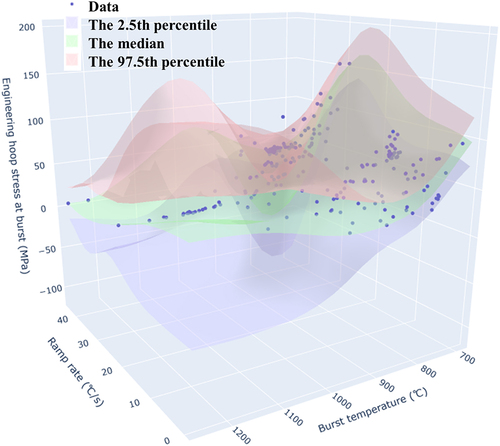
demonstrate the posterior predictive distribution of engineering hoop stress at burst for each model obtained based on the processes described in the previous section. and exhibit the two-dimensional distributions for the ramp rate 5°C/s, which is a typical condition related to a postulated LOCA sequence [Citation33].
Figure 4. Three-dimensional distribution of uncertainty related to the origin-based ORNL correlation.
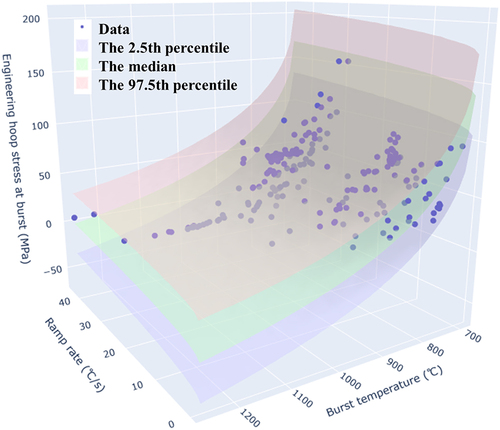
Figure 5. Two-dimensional distribution of uncertainty related to the origin-based correlation, wherein the fixed ramp rate is 5 (°C/s).
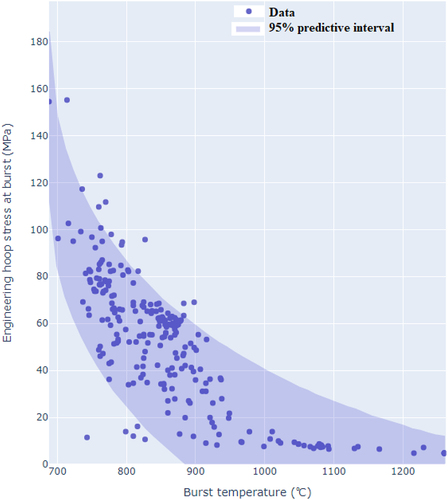
Figure 6. Three-dimensional distribution of uncertainty related to the modified ORNL correlation wherein the fixed hydrogen content is 100 (wppm).
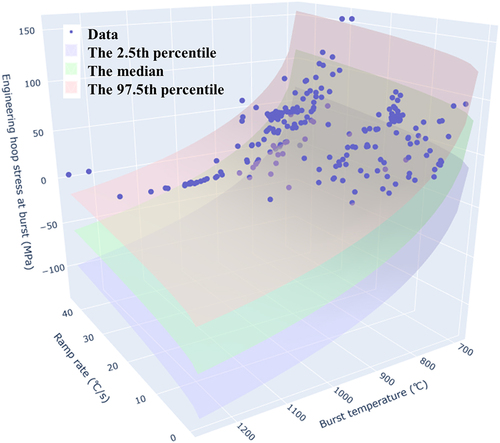
, and show the transparent red, green, and blue surfaces, i.e. the 97.5th percentile, the median, and the 2.5th percentile of the predictive distribution of engineering hoop stress of cladding at burst, respectively. Namely, the area bounded by the red and blue surfaces is the 95% predictive interval: the uncertainty contained in each model. The blue points are the literature data.
The engineering hoop stress of cladding at burst obtained by Bayesian estimation has uncertainty distributions. It reflects the sparseness/density of the datasets depending on the conditions defined by the explanatory variables, providing robustness in uncertainty quantification and giving larger uncertainties for the range less supported by the data.
According to the predictive intervals in and , the burst stress predicted by the modified ORNL correlation (EquationEq. 4(4)
(4) ) with hydrogen content of 100 (wppm) is lower than that predicted by the origin-based correlation (EquationEq. 3
(3)
(3) ). It confirms that the effect of hydrogen content on the burst condition is reflected on the obtained Bayesian model as intended. The two-dimensional plot of cladding hoop stress at burst in visualizes the large uncertainty band more quantitatively: 10–70 MPa, for example, for the surface temperature (800°C).
Figure 7. Two-dimensional distribution of uncertainty related to the modified ORNL correlation wherein the fixed ramp rate is 5 (°C/s) and hydrogen content is 100 (wppm).
visualizes the sensitivity of the modified ORNL correlation (EquationEq. 4(4)
(4) ) to hydrogen content. The hydrogen content of 13 (wppm) corresponds to the minimum level given by EquationEq. 5
(5)
(5) . indicates that the model predicts earlier bursts for higher hydrogen contents, which should be the primary explanatory variable to represent the burnup effect. For the hydrogen content higher than 200 (wppm), the 95% predictive interval estimated by the modified ORNL correlation is systematically lower than the original correlation value. Namely, with the modified ORNL correlation, a high-burnup state will be processed as more penalized regarding, for example, FFRD.
Figure 8. The change in uncertainty by fixing hydrogen content with respect to the modified ORNL correlation wherein the fixed ramp rate is 5 (°C/s).
As the hydrogen effect is incorporated in the modified ORNL correlation as a linear term (EquationEq. 4(4)
(4) ), this formulation entails the monotonic tendency of hydrogen effect in any data region. However, since there is no data directly supporting the model for high hydrogen content, the predictive intervals shown in get spread in higher hydrogen content thanks to the Bayesian approach. Namely, according to the derived modified ORNL model, it becomes increasingly uncertain whether earlier bursts occur in higher hydrogen content, and the risk of model extrapolation to the data scarce (or lacking) range is compensated.
The 95% predictive interval in the nonparametric model () looks deformed in the data-sparse region, specifically the low ramp rate and high-temperature region. The region well-supported by data, specifically the low-temperature region, exhibits a narrower uncertainty band, but the surface shape is more skewed than those in the parametric models ( and ) in the temperature and ramp rate dimensions. Due to the extreme flexibility of the Gaussian process and the distribution of data sparseness, the nonparametric model fails to capture the physics-based trend, like the monotonic decrease in burst stress with increasing burst temperature, associated with material softening, as far as the present Bayesian inference reached. Although it is not essential because an actual ramp rate in an LOCA sequence is several °C/s, a capacity exists to investigate the reason and validity that might improve the uncertainty band in the parametric models by fixing the coefficients and components of the ramp rate.
Figure 9. Three-dimensional distribution of uncertainty with respect to the nonparametric model, wherein the fixed hydrogen content is 13 (wppm).
3.2 Generalization performance
lists the evaluated values of the WAIC and LOOCV for each model. The model described by EquationEq. 4(4)
(4) performs better than EquationEq. 3
(3)
(3) . On the other hand, the verification model (EquationEq. 9
(9)
(9) ) exhibits the best performance.
Table 1. Evaluated WAIC and LOOCV.
The evaluation of the generalization performance of each candidate model using the WAIC and LOOCV showed improved performance of the modified ORNL correlation with an additional explanatory variable of hydrogen content (EquationEq. 4(4)
(4) ) than the origin-based ORNL model (EquationEq. 3
(3)
(3) ). Hydrogen content was accordingly confirmed as crucial for improving the reliability of cladding burst determination.
Adopting burnup instead of
as the additional explanatory variable in EquationEq. 4
(4)
(4) resulted in less improvement of the generalization performance, as observed in . Hydrogen effect in the current database is not likely a spurious correlation by other unnoticed parameters, confirming the primary importance of hydrogen effect among various burnup-related effects, such as irradiation damage in the metal matrix and the reduction in the metal matrix by oxide growth.
According to the information criteria, the nonparametric model (EquationEq. 9(9)
(9) ) showed highly increased performance compared to the parametric models (EquationEqs. 3
(3)
(3) and Equation4
(4)
(4) ). However, the substantial extension of the uncertainty band observed in the data-sparse region in did not have a negative impact on the WAIC and LOOCV evaluations.
As highlighted in the previous section, for the current burst test database, with its specific data sparseness and/or distribution of data sparseness, the Gaussian process fails to capture the trend expected from the underlying physics related to cladding high-temperature burst and produces less practical model, with a substantial uncertainty band. Prior knowledge, such as the temperature effect on cladding mechanical properties, explicitly used in the ORNL correlations, is essential to establish a reasonable model as a component of the integral LOCA simulation system.
Nevertheless, the nonparametric model (EquationEq. 9(9)
(9) ) is an informative and a helpful model to conduct the sensitivity study, when implemented in an integrated simulation. This model can predict the evaluation risk by reacting as an especially large uncertainty band, as expected from the model response observed in . Additionally, substantial reduction in the WAIC and LOOCV values related to the nonparametric model indicates that the form of ORNL correlation is nearly optimized to the behaviors of nonirradiated cladding samples, with room for improvement with respect to the increase in balance between the generalization performances related to nonirradiated and irradiated cladding samples.
4. Conclusions
This study developed a probabilistic determination model with respect to cladding burst conditions, incorporating data uncertainties using the Bayesian statistical method. The Bayesian inference method produced two parametric models based on the widely used ORNL correlation and one nonparametric model based on the Gaussian process, providing burst stress prediction with uncertainty distribution. A comparison between the two parametric models with and without hydrogen content as an explanatory variable using the WAIC and LOOCV methods showed improved reliability with respect to cladding burst determination. The sensitivity study related to incorporating burnup instead of hydrogen content showed that hydrogen content is the more relevant parameter for evaluating cladding bursts and other burnup-associated effects are not dominant. In the case that hydrogen content is more than 200 (wppm), the difference of predictions between the modified ORNL correlation and the original ORNL correlation was prominent. Since this level of hydrogen content is realistic in high burnup fuels, considering the hydrogen effect is crucial for evaluating FFRD. Although the nonparametric model was evaluated as the best model based on the information criteria, its uncertainty distribution is highly skewed to capture the physics-based trend. Thus, the modified ORNL correlation incorporated with the hydrogen content variable is a recommended correlation based on Bayesian models for developing a probabilistic burst model as a component of integral LOCA simulations, which is designed in numerous recent studies for evaluating FFRD. The burst model is well-supported by the experimental data for the temperature range of 700°C–900°C at a low ramp rate (~5°C/s). Further robustness with respect to the treatment of model uncertainty can be increased via the combined use of nonparametric and parametric models, which realize substantially large uncertainty responses in data-sparse conditions.
Acknowledgments
Part of the analyses in this study was performed under the research entrusted by the Nuclear Regulation Authority, Japan. The authors express their sincere gratitude to Mr. K. Hattori for performing data analysis based on the Bayesian inference method.
Disclosure statement
No potential conflict of interest was reported by the author(s).
Data availability statement
MCMC samples of model parameters posterior distributions and the rotatable 3D graphs of , and are available on Mendeley online storage: https://data.mendeley.com/datasets/cm59yssdmb/2. The distributions of uncertainty shown in this study can be calculated using this dataset.
References
- Wiesenack W. Summary of the halden reactor project LOCA test series IFA-650. Halden (Norway): Institutt for energiteknikk; 2013. ( Report no. HPR-380).
- Raynaud P. Fuel fragmentation, relocation, and dispersal during the loss-of-coolant accident. Washington (DC): The U.S. Nuclear Regulatory Commission; 2012. ( Report no. NUREG-2121).
- Capps N, Sweet R, Wirth BD, et al. Development and demonstration of a methodology to evaluate high burnup fuel susceptibility to pulverization under a loss of coolant transient. Nucl Eng Des. 2020 Sep;366:110744.
- Raynaud P, Porter I. Predictions of fuel dispersal during a LOCA. In: The Atomic Energy Society of Japan. Proceeding of 2014 Water Reactor Fuel Performance Meeting. Proceedings; 2014 Sep 14–17; Sendai (Japan).
- Greenquist I, Wysocki A, Hirschhorn J, et al. Multiphysics analysis of fuel fragmentation, relocation, and dispersal susceptibility–part 1: overview and code coupling strategies. Ann Nucl Energ. 2023 Nov;191:109913.
- OECD/NEA. Report on Fuel Fragmentation, Relocation and Dispersal. France: OECD/NEA CSNI; 2016. ( NEA/CSNI/R(2016)16).
- Capps N, Sweet R. Model for determining rupture area in Zircaloy cladding under LOCA conditions. Nucl Eng Des. 2023 Jan;401:112096. doi: 10.1016/j.nucengdes.2022.112096
- Chapman RH. Multirod burst test program progress report for April-June 1979 [BWR; PWR]. TN. (USA): Oak Ridge National Laboratory; 1979. ( Report no. NUREG/CR-1023).
- Hózer Z, Adorni M, Arkoma A, et al. Review of experimental database to support nuclear power plant safety analyses in SGTR and LOCA domains. Ann Nucl Energ.2023;193:110001.
- Powers DA. Meyer RO, Cladding swelling and rupture models for LOCA analysis. Washington (DC): The U.S. Nuclear Regulatory Commission; 1980. ( Report no. NUREG-0630).
- Lorenz RA, Hobson DO, Porker GW. Final report on the first fuel rod failure transient test of a zircaloy-clad fuel rod cluster in TREAT. TN (USA): Oak Ridge National Laboratory; 1971. ( Report no. ORNL-4635).
- Lorenz RA, Hobson DO, Parker GW. Fuel rod failure under loss-of-coolant conditions in treat. J Nucl Sci Technol. 2017;11(4):502–520. doi: 10.13182/NT71-A30847
- Chapman RH. Multirod burst test program quarterly progress report for October–December 1976 [BWR; PWR]. TN. (USA): Oak Ridge National Laboratory; 1979. (Report no. ORNL/NUREG/TM-95).
- Chapman RH. Multirod burst test program. quarterly progress report, January–March 1977. [BWR; PWR]. TN. (USA): Oak Ridge National Laboratory; 1977. ( Report no. ORNL/NUREG/TM-108).
- Chapman RH. Preliminary multirod burst test program results and implications of interest to reactor safety evaluation. water reactor safety research meeting; MD (USA). Report no. CONF-781146-4.
- Chapman RH. Multirod burst test program report, July-December 1978 [BWR; PWR]. TN. (USA): Oak Ridge National Laboratory; 1979. ( Report no. ORNL/NUREG/TM-297).
- Chapman RH. Multirod burst test program. progress report, April-June 1979. [BWR; PWR]. TN. (USA): Oak Ridge National Laboratory; 1979. ( Report no. ORNL/NUREG/TM-351).
- Lowry LM, Markworth AJ, Perrin JS et al. Evaluating strength and ductility of irradiated zircaloy, task 5. OH (USA): Battelle Columbus Labs.; 1981. ( Report no. NUREG/CR-1729).
- Raynaud PAC. Fuel fragmentation, relocation, and dispersal during the loss-of-coolant accident. Washington (DC): The U.S. Nuclear Regulatory Commission; 2012. (Report no. NUREG-2121).
- Chapman RH, Longest AW, Crowley JL. Experiment data report for multirod burst test (MRBT) bundle B-6. TN (USA): Oak Ridge National Laboratory; 1984. ( Report no. NUREG/CR-3460).
- Billone MC, Yan Y, Burtseva TA, et al. Cladding behavior during postulated loss-of-coolant accidents. IL (USA): Argonne National Laboratory; 2016. ( Report no. NUREG/CR-7219).
- Billone MC, Yan Y, Burtseva TA et al. Cladding embrittlement during postulated loss-of-coolant accidents. IL (USA): Argonne National Laboratory; 2008. ( Report no. NUREG 6967).
- Nagase F, Fuketa T. Fracture behavior of irradiated zircaloy-4 cladding under simulated LOCA conditions. J Nucl Sci Technol. 2006;43(9):1114–1119. doi: 10.1080/18811248.2006.9711202
- Nagase F, Chuto T, Fuketa T. Fracture resistance of high burn-up PWR fuel cladding under simulated LOCA conditions. Water Reactor Fuel Performance Meeting 2008. Proceedings; Seoul (Korea); 2008 Oct 19–23.
- Nagase F, Chuto T, Fuketa T. Behavior of 66 to 77 MWd/kg fuel cladding under LOCA conditions. International Conference on the Physics of Reactors “Nuclear Power: A Sustainable Resource”. Proceedings; 2008 Sep 14–19; Interlaken (Switzerland).
- Geelhood KL, Beyer WG. FRAPCON-3.4: a computer code for the calculation of steady-state thermal-mechanical behavior of oxide fuel rods for high burnup. WA (USA): The U.S. Nuclear Regulatory Commission; 2011. ( Report no. NUREG/CR-7022).
- Hoffman MD, Gelman A. The No-U-Turn sampler: adaptively setting path lengths in hamiltonian Monte Carlo. J Mach Learn Res. 2014 Apr;15(1):1593–1623.
- PyStan [Internet] pystan Developers. 2014. [ updated 2022 Nov 26; cited 2023 Mar 20]. Available from: https://pystan.readthedocs.io/en/latest/
- Watanabe S. Asymptotic equivalence of bayes cross validation and widely applicable information criterion in singular learning theory. J Mach Learn Res. 2010 Dec;11:3571–3591.
- Stone M. Cross-validatory choice and assessment of statistical predictions. J Royal Stat Soc Ser B (Methodological). 1974 Jan;36(2):111–133. doi: 10.1111/j.2517-6161.1974.tb00994.x
- Gelfand AE, Dey DK, Chang H. Model determination using predictive distributions with implementation via sampling-based methods. CA (USA): Stanford University; 1992. ( Report no. 462).
- Gelman A, Carlin JB, Stern HS et al. Chapter II basics of Markov chain simulation 11.4 inference and assessing convergence. “Bayesian data analysis, third edition”. Boca Raton, Florida, USA: Chapman & Hall/CRC; 2013. pp. 281–285.
- Nissley ME, Frepoli C, Ohkawa K. Realistic assessment of fuel rod behavior under large-break LOCA conditions. Washington (DC): The U.S. Nuclear Regulatory Commission; 2005. ( Report no. NUREG/CP-0192).