
Abstract
The Schwartz Outcome Scale-10 is a 10-item measure that has proven utility for assessing well-being and mental health and measuring change over time. Although there is a Spanish translation of the measure created in the United States for the Latino population, its acceptability and psychometric properties have not been studied in unilingual Spanish speakers, nor outside the United States. The aim of the present study is to explore these properties in larger samples, clinical and non-clinical, from Latin America adding convergent validity checking and exploration of effects of gender and age on scores. A qualitative study was conducted with 11 participants to test for dialect/language issues, then a psychometric exploration of data from 886 participants in a non-clinical sample and 172 in a clinical sample. The results showed good psychometric characteristics and suggest that the SOS-10-E can be used in Latin America. A cutoff of 42.51 differentiates clinical scores from non-clinical. Future studies are needed to explore sensitivity to change and check replication in other Spanish speaking populations.
One component of the replicability crisis in psychology is the myth that the psychometric properties, all forms of both reliability and validity are fixed properties of measures; the reality is that these are empirical findings about scores in samples. This has been clearly underlined by APA guidance since 1999: “It is important to remember that a test is not reliable or unreliable. Reliability is a property of the scores on a test for a particular population of examinees” (Wilkinson & Task Force on Statistical Inference, American Psychological Association, 1999, p. 596). This makes it vital that we explore all psychometric properties of promising measures in varied samples across different populations. In keeping with this, this study is the first replication and extension of the work that created the Spanish language version of the Schwartz Outcome Scale-10 (SOS-10-E). We aim to see if the properties found in the original work in the small non-clinical US Latino sample would be replicated in larger non-clinical and clinical samples from Latin America and we are adding convergent validity checking and exploration of effects of gender and age on scores.
The SOS-10 is one of a number measures, e.g. the CORE system (www.coresystemtrust.org), OQ system (www.oqmeasures.com) and others that have challenged the historical focus on specific conditions such as anxiety disorders or depression when assessing outcomes of psychological treatments; see Ogles et al. (Citation2002) for one review of this change. This challenge has led the creation of several short and general measures of psychological distress for use in English-speaking countries (Tarescavage & Ben-Porath, Citation2014). However, only few of these have been translated to Spanish and they have as yet been little used in Latin America despite this including a population of around 412 million across 19 Spanish-speaking countries in a region that is growing and developing, as are its mental health services (Rodríguez, Citation2010). Despite developments, there is still serious lack of psychometric exploration of measures that could assess the effectiveness of these mental health interventions in the region. A recent review of the use of outcome measures in Latin America indicated that only 6% of 207 studies were psychometric explorations underlining the need for such exploration of measures in the region (Paz et al., Citation2020).
This lack of psychometric explorations of outcome measures is not a minor issue, not only will psychometric properties of translated measures vary between languages, but they may show marked variation within languages. One early study of internal reliability (Evans et al., Citation1997) for highly respected measures used in their source language (English) in first language or bilingual users of that language showed Cronbach’s alpha values for the oral control scale of the Eating Attitudes Test (EAT-26) from −.01 for adult English speaking Nigerians in Nigeria to .48 in Nigerians in the UK and .61 for indigenous British women. The 95% confidence intervals (CIs) were wide reflecting small samples [-.53, .37], [.16, .71] and [.52, .69] however those intervals confirm that these are not sampling vagaries. The cultural dependence of eating disorders is well known so perhaps the differences there were unsurprising. However, the reliability differences for the anxiety scale of the Hospital Anxiety and Depression Scales measure were also large: .53 [.29, .71], .79 [.66, .88] and .82 [.78, .85]. Exploration of such differences was strengthened by Vacha-Haase (Citation1998) introduction of “reliability generalization” (RG) studies and all RG studies known to the authors (inter alia Rouse, Citation2007 and Rubio-Aparicio et al., Citation2020) have found variation in reliability across studies for all measures reviewed (see Vacha-Haase & Thompson, Citation2011, for an early review of RG reviews).
Turning from the general to the specific issue of the SOS-10: social, political and economic characteristics of Latinos living in United States, and their use of Spanish, are different from those of the Latin American Spanish speaking population, and US Latino use of Spanish is declining (Pew Research Center, Citation2017). As a result, it cannot be assumed that the SOS-10-E developed with a bilingual Latino US sample will show the stable properties across Spanish speaking samples.
The present study will focus on the SOS-10 because, alongside the CORE-10 (Barkham et al., Citation2013), it is the shortest of this new generation of short general mental health measures. The SOS-10 is a 10-item scale designed to measure the effectiveness of mental health treatments in different populations and care contexts (Blais et al., Citation1999) and does not focus on signs and symptoms of specific disorders, but on general mental health and psychological well-being. It was intended to be used regardless of the profession or training of the mental health worker. Greater scores indicate presence of well-being and psychological health. Studies to date, both in English and other languages, have found strong and consistent internal reliability and shown sensitivity for assessing change following intervention (Blais et al., Citation1999; Haggerty et al., Citation2010; Laux & Ahern, Citation2003; Young et al., Citation2003). In addition, SOS-10 scores showed strong negative correlations with a range of psychopathological measure scores and a strong positive correlation with psychological well-being measures (Blais et al., Citation1999). Also, Young et al. (Citation2003) found that SOS-10 scores presented significant correlations with measures of hopelessness, self-esteem, positive and negative affect, mental health, fatigue, satisfaction with life, psychiatric symptoms and desire to live.
There are official translations of the SOS-10 into Spanish (Rivas-Vazquez et al., Citation2001), French (Laux et al., Citation2006), Czech (Dragomirecka et al., Citation2006), Farsi (Jamil et al., Citation2019), Arabic (Mohammed, Citation2008), Chinese and Italian (Blais, Citation2012). The Spanish translation of this measure, named the SOS-10-E, was conducted in United States (US) for use with the US Latino population (Rivas-Vazquez et al., Citation2001). That original paper is still the only published psychometric exploration of the translation hence this paper is the first replication and extension of that work. More specifically, we first checked dialect/language issues and we examined the acceptability, factor structure, reliability, convergent validity, and possible age and gender effects for clinical and non-clinical samples. Also, a cutoff score to differentiate between the clinical and non-clinical population was calculated.
Methods
Ethics
The present study was approved by the Ethic Review Board of the Universidad San Francisco de Quito, Ecuador (ref. 2017-113E). All the participants were carefully informed about the study and gave written consent before starting their participation.
Participants
Non-clinical sample
This sample excluded anyone in any form of psychotherapy or taking psychotropic medication. We approached a total of 1061potential participants, 59 (5.6%) rejected participation and a further 116 (11.6% of the 1002) were excluded because they were receiving psychotherapy or taking psychotropic medication. Participants came from two sub-samples: a student sample and a community sample. No significant differences were found in the refusal rates of the students and community sub-samples (χ2 (1, N = 1,061) = 0.41, p = 0.52). Significantly more participants from the community sample (14.2%) were excluded from the study than from the student sample (8.7%; χ2 (1, N = 1002) = 7.42, p = 0.006). The flow of participants into each sub-sample of the non-clinical sample is showed in .
Figure 1. Non-clinical sample flow of participants.
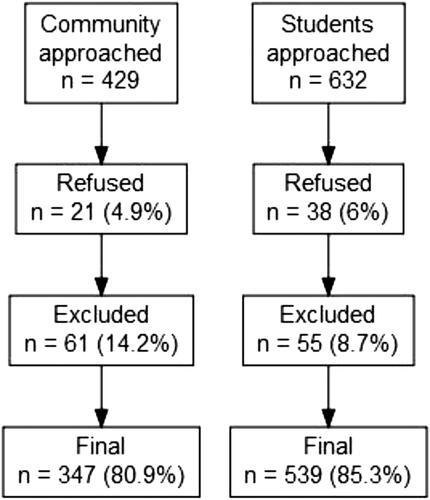
The student sub-sample included 539 participants, 315 females (58.4%) and 223 males (41.4%). One of the participants did not indicate gender. The mean age of the participants was 22.27 years (SD = 3.78), and the age ranged from 18 to 45 years. Participation was voluntary and no extra credit was given.
The community sample included 347 participants, 164 females (47.3%) and 181 males (52.2%), and two participants did not indicate their gender. The mean age was of 39.26 years (SD = 12.35) and ranged from 18 to 78 years. Participation was voluntary with no remuneration; the sample was recruited by snowball sampling with the students who participated in the student subsample inviting non-student relatives and friends to participate.
Clinical sample
Participants were clients attending for a first appointment in one of two clinics offering psychological interventions for non-severe mental disorders (e.g., anxiety or depression) and relational conflicts. This first appointment looks to assess the level of symptoms and the type of intervention that will be conducted. In total 182 clients were approached, 10 (5%) declined to participate in the study leaving a final sample of 172: 97 females (56.4%) and 74 males (43%) with gender missing for one participant. The mean age of the participants was 29.09 years (SD = 9.45) and ranged from 18 to 58 years. In total, 150 clients (87.2%) accepted and continued with the psychological treatment after the first appointment.
Measures
Schwartz Outcome Scale-10 (Blais et al., Citation1999)
As noted above, the SOS-10 is a brief self-report scale of 10 items that measures wide domains of mental health. Each item is answered on a seven-level frequency scale scored 0 to 6 and anchored at the extremes with the labels “never” and “all or nearly all the time”, “nunca” and “todo el tiempo o casi todo el tiempo” in Spanish. The score is the total of the item scores so bounded by zero and 60 and pro-rating is allowed for up to two missing items. The traditional psychometric properties are relative robust for the original version in English in North American samples (Blais et al., Citation1999), as well as for the Spanish version (SOS-10-E) used in bilingual population in United States (Rivas-Vazquez et al., Citation2001). The internal consistency of the SOS-10 in previous studies was .96 [.94, .97] and .88 [.84, .91], for the English and Spanish versions respectively. Test-retest reliability has been acceptable with a previous study (Young et al., Citation2003) reporting a test-retest correlation of 0.86 [.78, .91]. The majority of studies of the SOS-10 report no marked effects on scores of age or gender and a one-factor structure. The one exception is the only existing report on the SOS-10-E, which suggested the fit was better to a two-factor structure. The SOS-10 has shown construct validity by means of significant correlation with measures of interpersonal distress, alexithymia, self-esteem, general psychological distress, satisfaction with life, psychiatric symptoms, and personality traits (Blais et al., Citation1999; Haggerty et al., Citation2010).
Outcome questionnaire (OQ-45.2; Lambert et al., Citation1996)
This is a 45-item self-reported questionnaire designed to assess and to monitor treatment outcomes in mental health care contexts. The English version (Lambert et al., Citation2010), and the Spanish version of the OQ-45.2 (von Bergen & de la Parra, Citation2002) have shown acceptable psychometric properties. A previous study with clients of a university’s counseling service in United States showed the total score of the SOS-10 correlated highly (r = −.84 [-.91, −.72]) with the total score of the OQ-45.2 (Young et al., Citation2003). In the current sample the reliability was excellent (α =.91 [.90, .92]; Omega = .92 [.91, .93]).
Clinical outcomes in routine Evaluation- Outcome measure (CORE-OM; Evans et al., Citation2002)
This is a 34-item self-report measure of global psychological state. The Spanish version (Trujillo et al., 2016) of this measure presents good psychometric properties, which are comparable with the original English version (Evans et al., Citation2002). The reliability in the current study was excellent (α =.94 [.94, .95]; Omega = .94 [.94, .95]).
Procedures
As the SOS-10-E had only been used previously with a bilingual sample (Spanish-English) of Latinos in United States, it was necessary, before conducting a relatively large scale quantitative exploration, to establish that it could be understood by Ecuadorian Spanish-speakers. A semi-structured interview was designed to follow showing the SOS-10-E to participants. The following questions were asked as part of the interview: 1) do you understand the item? what do you think it means? 2) do you think the general population could understand this item? if not, why do you think it will be difficult to understand? how would you change the wording to make it more understandable? and 3) do you think that a person who is experiencing distress could understand this item? If not, how would you change the wording to make it more understandable?
Interviews were conducted with eleven adults from the four principal Ecuadorian regions: Coast (n = 2), Highlands (n = 4), Amazon (n = 3), and Galapagos (n = 2). Nine of the participants had completed high-school (12 years of formal education) and the other two had completed elementary school (six years of formal education). We sought diversity among participants in order to maximize likely generalizability to most of the Ecuadorian population.
After this check, the next step involved traditional psychometric exploration of the SOS-10-E with the full samples, clinical and non-clinical, described above. All participants completed the three measures (SOS-10-E, CORE-OM and OQ-45.2). Participants of the student sub-sample were contacted for re-test at two more time points with a two-week interval between each completion.
Data analysis
This study is epistemologically pragmatic (Guyon et al., Citation2018) and contextual (Tebes, Citation2005). Pragmatically, the analysis was designed to address the likely utility of the SOS-10-E in Latin America and the transferability of the findings from the development study to this sample and location. Contextually, the analyses are in the traditions of Abelson’s “statistics as principled argument” (Abelson, Citation1995) and the PPDAC (Problem, Plan, Data, Analysis, Conclusions and communication) approach to statistics (Oldford & MacKay, Citation2000; Spiegelhalter, Citation2019). The PPDAC Problem was to determine if the SOS-10-E was acceptable, and has appropriate psychometric qualities of internal reliability, structure and convergent validity. The approach is exploratory/descriptive as a universalist model of fixed measurement parameters for the SOS-10 across languages, or even across countries within language is now firmly rejected; null hypothesis tests are reported where informative but most quantitative results are reported with 95% confidence intervals (shown as [xx, yy]). The Plan was a replication and considerable extension of the only existing psychometric exploration of the SOS-10-E (Rivas-Vazquez et al., Citation2001). Data was collected with measures indicated in the last section. The PPDAC Analyses and Conclusions are expanded below.
Data analyses are presented first for the small qualitative acceptability and language check and then for the quantitative psychometric exploration. For the small qualitative study, we conducted a minimal template analysis organizing the responses of the participants and possible suggestions for changes to the items of the SOS-10-E. The first quantitative analysis was to determine if the measure was as acceptable as the qualitative exploration suggested based omission rates per item. To address the issue of whether the SOS-10-E is best thought to have a single or a two dimensional structure, we conducted a confirmatory factor analysis (CFA) both for one-factor solution (Blais et al., Citation1999) and two-factor solution reported in Rivas-Vazquez et al. (Citation2001). In the latter structure items 1, 2, 3, 6, 9 and 10 loaded on the first factor and items 4, 5, 7 and 8 on the second. Although some simulation work (Rhemtulla et al., Citation2012) has suggested that maximum likelihood (ML) estimation for CFA models may be robust to the obvious departure from Gaussian distributions when short ordinal scales have five or more levels, other univariate and multivariate tests (Mardia, Citation1970) for Gaussian distributions showed highly significant misfit, and the use of a diagonally weighted least squares (DWLS) estimator would therefore be more appropriate. Three fit indices were reported: Comparative Fit Index (CFI), Tucker- Lewis Index (TLI), and Root Mean Square Error of Approximation (RMSEA) as suggested by (Schreiber et al., Citation2006). Levels of TLI > 0.95, CFI > 0.95, and RMSEA < 0.06 were considered to indicate good fit between model and data (Hu & Bentler, Citation1999). Congruent with the use of DWLS estimation, scaled chi squared values and robust CFI, TLI and RMSE values are reported (Brosseau-Liard & Savalei, Citation2014). The factor structure was tested for each sample (clinical and non-clinical) and the scaled difference chi-square test statistic proposed by Satorra and Bentler (Citation2001) is presented to compare the models. These analysis were performed using the lavaan package version 0.6-7 (Rosseel, Citation2012) in R. Thirdly, following the decision about dimensionality, internal reliability was assessed using Cronbach’s alpha (α; Cronbach, Citation1951) for comparability with previous studies, and with McDonald’s Omega (McDonald, Citation2013) respecting the arguments that it is a better estimator of internal reliability. In addition, item fit was calculated from the correlation of each item with the total score of the SOS-10-E minus the target item. Test-retest reliability was explored more extensively than in Rivas-Vazquez et al. (Citation2001) reporting both stability correlations and mean shift, and their 95% confidence intervals for three rather than just two assessment points. Fourthly, convergent validity was assessed calculating the correlation of the SOS-10-E total score and total scores of the OQ-45.2 and the CORE-OM. Fifthly, the influence of age and gender on the SOS-10-E total scores was tested using the correlation of total score with age and the mean difference between male and female scores reporting bootstrapped 95% CIs for the difference of means. Finally, the cutoff score between the clinical and non-clinical population was calculated using the criterion c proposed by Jacobson and Truax (Citation1991). This criterion was adopted because it is commonly used in psychotherapy treatments to identify clinically significant changes. Referential data for SOS-10-E total scores are presented by sample and gender. Analysis were conducted using R statistical software version 4.0.2 (R Core Team, Citation2019).
Results
Qualitative exploration of acceptability of the SOS-10-E in the ecuadorian context
The qualitative exploration was unanimous and unambiguous with all 11 interviewed participants finding the measure easy to understand and envisaging no challenges for people with significant distress to respond to it. Also, they indicated that the words are commonly used in their contexts. They suggested no modifications or improvements.
Acceptability
In the non-clinical sample, 869 (98.1% of the 886) participants answered all the 10 items and further five participants completed at least eight items, leaving 874 (98.6%) whose data could be prorated to obtain the total score following the designers’ recommendations of prorating up to two missing items. Item one was the most omitted item (0.05%), while item two was the least omitted item (0.04%). In the clinical sample, 158 patients of 172 (91.9%) completed all the 10 items and seven participants completed at least eight items leaving 165 (95.9%) with proratable data. Items one and seven were the most omitted items (0.08%), followed by item two (0.07%), all the other items were omitted in the same proportion (0.06%).
There were no serious range restrictions by floor or ceiling effects in either the non-clinical or clinical samples with the highest proportion of responses of six (the maximum) of .46 for item 5, “I am able to have fun” in the non-clinical sample and the highest proportion of responses of zero being .10 for item 10, “I have peace of mind” in the clinical sample.
Confirmatory factor analysis for each sample
Pearson correlation matrixes of all the 10 items for clinical and non-clinical sample are available as supplemental materials (S1. Pearson correlations with confidence intervals for SOS-10-E items of the clinical sample and S2. Pearson correlations with confidence intervals for SOS-10-E items of the non-clinical sample).
Mardia’s test of multivariate normality (Mardia, Citation1970) showed significant misfit to multivariate normality within the data for the clinical sample (Mardia Skewness: 425.38, p < .001; Mardia Kurtosis = 9.22, p < .001), and for the non-clinical sample (Mardia Skewness: 2977.72, p < .001; Mardia Kurtosis = 84.01, p < .001). Consequently, DWLS estimation results are reported (Koetse et al., Citation2010; Nalbantoğlu Yılmaz, Citation2019).
Fit was statistically imperfect as indicated by the scaled chi squared values for clinical and non-clinical samples and for both single factor and two factor models (). However, goodness of fit statistics were excellent considering Hu and Bentler (Citation1999) indications. TLI values, which penalize model complexity more than CFI, were better for the one-factor solution than for the two-factor solution in both samples and the models were not statistically different in either the clinical (scaled Δχ2 = .048, Δdf = 1, p = 0.49) and in the non-clinical sample (scaled Δχ2 = 2.12, Δdf = 1, p = 0.15). Factor loadings () showed negligible differences between models and loadings for each model within samples but quite marked differences between samples.
Table 1. Goodness of fit indices for the one and two-factor solutions.
Table 2. Standardized factor loadings for the one-factor solution and for the two-factor solution by sample.
Reliability
Cronbach’s alpha was excellent for the clinical (α =.93 [.91, .95]; Omega = .91 [.91, .93]) and the non-clinical samples (α =.92 [.91, .93]; Omega = .86 [.82, .91]). The consistency was also excellent considering the two non-clinical subsamples separately: community (α =.92 [.90, .93]; Omega = .88 [.82, .91]) and students (α =.93 [.91, .95]; Omega = .87 [.82, .91]). Corrected item-to-scale correlations ranged from .62 for item one to .70 for item four in the non-clinical sample. In the clinical sample the corrected item-to-scale correlations ranged from .62 for item nine to .84 for item four.
Students completed the SOS-10-E three times, each two weeks apart. The number of participants with valid total scores was 530 in Time 1 (T1), 415 in Time 2 (T2), and 166 in Time (T3). Pearson correlation between T1 and T2 was .87 [.84, .89], between T2 and T3 .84 [.78, .89], and between T1 and T3 was .79 [.73, .84]. Mean shift stability was assessed from the difference in the means of the three possible comparisons between the assessment points: T2 - T1 = −0.11 [-0.59, 0.37]; T3-T2 = 0.21 [-0.81, 1.24]; T3-T1=-0.05 [-1.03, 1.13].
Convergent validity
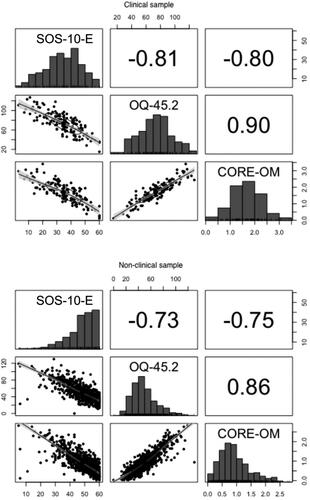
Convergent validity was assessed, first checking the linearity of the relationship between the scores and then calculating the Pearson correlation of the SOS-10-E total score and the CORE-OM and OQ-45-2. shows the scatterplot matrix and correlations between the scores by sample. The scatterplots indicated that there is a clear and essentially linear relationship between the variables in both samples. In the non-clinical sample the correlations were strong and negative for the CORE-OM (rp = −.75 [-.78, −.77]), and for the OQ-45.2 (rp = −.73 [-.76 to −.69] with similar results in the clinical sample: correlation with the CORE-OM (rp = −.80 [-.83 to −.71]) and the OQ-45.2 (rp = −.81 [-.86 to −.73]).
Figure 2. Scatterplot matrix and Pearson’s correlation of SOS-10-E with OQ-45.2 and CORE-OM by sample.
Note. SOS-10 = Schwartz Outcome Scale, OQ-45.2 = Outcome Questionnaire 45.2, CORE-OM = Clinical Outcomes in Routine Evaluation-Outcome Measure.
Age and gender effects
In the non-clinical sample SOS-10-E score presented a weak correlation with age in the whole sample (rp = .23 [.16, 29]), and in each of the subsamples: community (rp= .15 [.04, .25]) and students (rp = .19 [.11, .27]). No significant gender differences were found in relation to the whole non-clinical sample (mean difference between males and females = 0.53 [-0.7, 1.81]) nor in the subsamples: community (mean difference = −1.07 [-2.98, 0.88]) and students (mean difference = 0.9 [-0.8, 2.45]). ANOVA showed a significant interaction of gender by sample (F (3, 867) = 12.18. p < .001). Post hoc comparisons using the Tukey HSD test showed that the only significant difference was between the mean score of females from the community and females from the student sample (difference =- 4.69 [-7.0, −2.38].
In the clinical sample the correlation between the total score and the age was weak (rp = 0.20 [0.05, 0.34]). No significant gender differences were found (difference = −0.8 [-4.51, 3.15]). shows referential data for the total SOS-10-E score by sample and gender.
Table 3. Referential data for SOS-10 scores by sample and gender.
Cutoff score between the clinical and non-clinical sample
There is a significant difference between the clinical (34.98, SD = 12.48) and the non-clinical (48.19, SD = 9.44) sample (difference =-13.21 [-15.27, −11.2]). The effect size was large (Hedge’s g = 1.07 [0.91, 1.24]).
The cutoff score to differentiate between the clinical and non-clinical sample was calculated using the c criterion proposed by Jacobson and Truax (Citation1991). For the whole sample, the cutoff score was 42.51 [41.5, 43.4]). Considered by gender the cutoff score for women was 42.41 [41.0, 43.6] and for men was 42.71 [41.1, 44.1].
Discussion
This investigation was the first to examine the adequacy of the SOS-10-E in a Latin American country, extending and replicating the study of psychometric properties of non-clinical data by Rivas-Vazquez et al. (Citation2001), recognizing that reliability might change in different populations, even within one language (Evans et al., Citation1997; Vacha-Haase, Citation1998; Vacha-Haase & Thompson, Citation2011).
As Spanish varies considerably between and within continents and even within countries the acceptability of the SOS-10-E in Ecuador was first checked qualitatively and we were pleasantly surprised to find complete agreement in our sample, with no criticisms or suggestions for improvement. This was congruent with very low omission rates in the quantative arm of the study.
With acceptability supported, we explored psychometric properties. The factor structure showed no advantage to the two-factor solution of Rivas-Vazquez et al. (Citation2001) and congruent with findings supporting a single factor structure in the original English language SOS-10 as well as Arabic (Mohammed, Citation2008), Farsi (Jamil et al., Citation2019), Czech (Dragomirecka et al., Citation2006), and French (Laux et al., Citation2006) translations.
The single score for the measure showed excellent internal consistency in both samples, slightly higher than that in the US SOS-10-E data (α = .88 [.84, .91]) and slightly lower than that found in the clinical sample in the English version (α =.96 [.94, .97]). This is consistent with the reliability generalization literature showing that reliability can vary across populations underlining that testing psychometric properties in the targeted population is vital. We computed McDonald’s omega as well as Cronbach’s alpha as alpha overestimates internal reliability where item variances vary and item covariance is not entirely unifactorial (which it never is in real life questionnaire data). As expected, omega was lower than alpha and researchers may want to use the omega values if correcting for attenuation of making sample size/power/precision estimates, though the differences will not matter for clinical use of aggregate or individual client data.
We assessed test-retest reliability across three assessment points rather than two in order to test the effect, reviewed in Durham et al. (Citation2002), in which from the first to the second administration of a test there is a significant difference in scores often not found in the following assessments. This “test-retest” effect was not evident in our study. Correlations across the three two-week time intervals (T2-T1, T3-T2 and T3-T1) were high and there were no statistically significant mean shifts week on week. Test-retest reliability was assessed only for the student subsample as we expected that the clinical sample would be experiencing substantial changes with time and as logistics prevented any short test-retest interval with this sample. Results for the T3 must be considered cautiously since only 31% of the participants completed the assessment at that time. This attrition is the result of the time of the year in which the study took place, T3 was close the end of the academic term, so it was not possible to contact some of the participant students.
Convergent validity correlations with measures designed for similar purposes (CORE-OM and OQ-45.2) were over .70. The correlation of the OQ-45.2 and the SOS-10 is similar (rp = −.81 [-.86, −.73]) to, and not different of that found by Young et al. (2003) (r = −.84 [-.90, −.72]) with the English version of the measures in a similar population of clients of counseling services. Also, it is notable that SOS-10-E with only 10 items attained such high and significant correlations in the expected direction with measures that have a greater number of items. SOS-10-E has less than one third of the CORE-OM items and one quarter of the OQ-45.2. Having a measure with fewer items may ease respondent burden and increase compliance.
Our findings of very weak relationships between SOS-10-E scores and age were similar to Rivas-Vazquez et al. (Citation2001). We found no statistically significant gender effects in any of the samples. In the previous study gender differences were only tested in a non-clinical sample and no significant differences found. However, mean scores of the non-clinical sample in Ecuador are lower than in the USA sample. For men the USA mean lay outside the Ecuador 95% CI though this was not true for the women. However, these differences could be due to age differences given the weak but significant age effects. Larger samples from both countries are clearly desirable but this indicates that there may be country and gender differences and possibly statistically significant gender/country interactions.
Given the strong and statistically significant differences between the clinical and the non-clinical samples, cut off scores were calculated. The value of 42 was similar to that of 41 found for the English language SOS-10 in North America (Blais et al., Citation2012, Citation2013). It is worth noting that in those studies the clinical samples were psychiatric outpatients undergoing treatment, whereas ours were clients assessed for potential psychological therapy services.
One particular finding that surprised us concerned the exclusion rates. We were pleasantly surprised by the realistic but low refusal rates, but surprised by the exclusion rates arising from engagement in either psychological therapies or use of psychotropic medication. The rates of 8.7% and 14.2% respectively in the student and community samples were both higher than we had anticipated and the higher rate in the community than the student sample, a statistically significant difference, was also not what we had expected. These findings suggest that the prevalence of psychological distress in the general Ecuadorean population may be higher than widely thought and underlines the need for good and usable measures.
Limitations of the present study include that the studied population is from only one country of the 19 countries that speak Spanish in Latin America, that the student and community samples are samples of convenience and that the clinical sample was of clients attending for psychological therapies not for psychiatric treatments nor for community psychology interventions, a common type of intervention in Latin America (Montero, Citation2018). The size of the clinical sample is relatively small for CFA analysis and for determining cutoff scores and interpretation of both the CFA and the cutoff scores should be considered preliminary until findings from larger samples become available.
Future studies might test the acceptability and psychometric properties of the SOS-10-E in other countries of the region and might include different clinical populations and aggregate larger samples to gain greater precision on some parameters of interest, particular the cutting points; and could replicate the comparison of a single factor over a two-factor structure. Clinical change data collection is ongoing in Ecuador and a Latin American research network is exploring wider collaborative studies of the SOS-10-E and other measures.
These limitations do not prevent the conclusion that the SOS-10-E is an acceptable, unidimensional, reliable measure for use in the region and we provide initial cutting points and referential score data, with confidence intervals, supporting interpretation of findings arising from use of the measure. Researchers and clinicians of the region might benefit of using SOS-10-E as routine outcome monitoring measure to assess the effectiveness of provided services or to propose research questions related to psychological well-being and change after application of mental health interventions.
Open Scholarship
The data that support the findings of this study are openly available in Mendeley Data at http://doi.org/10.17632/ckdd39bst2.2
Supplemental Material
Download Zip (28.4 KB)Additional information
Funding
References
- Abelson, R. P. (1995). Statistics as principled argument. Lawrence Erlbaum Associates.
- Barkham, M., Bewick, B., Mullin, T., Gilbody, S., Connell, J., Cahill, J., Mellor-Clark, J., Richards, D., Unsworth, G., & Evans, C. (2013). The CORE-10: A short measure of psychological distress for routine use in the psychological therapies. Counselling and Psychotherapy Research, 13(1), 3–13. https://doi.org/https://doi.org/10.1080/14733145.2012.729069
- Blais, M. A. (2012). The Schwartz Outcome Scale – 10. Integrating Science and Practice, 2(2), 40–42.
- Blais, M. A., Lenderking, W. R., Baer, L., DeLorell, A., Peets, K., Leahy, L., & Burns, C. (1999). Development and initial validation of a brief mental health outcome measure. Journal of Personality Assessment, 73(3), 359–373. https://doi.org/https://doi.org/10.1016/S1098-3015(11)70926-3
- Blais, M. A., Malone, J. C., Stein, M. B., Slavin-Mulford, J., O'Keefe, S. M., Renna, M., & Sinclair, S. J. (2013). Treatment as usual (TAU) for depression: A comparison of psychotherapy, pharmacotherapy, and combined treatment at a large academic medical center. Psychotherapy (Chicago, Ill.). 50(1), 110–118. https://doi.org/https://doi.org/10.1037/a0031385
- Blais, M. A., Sinclair, S. J., Baity, M. R., Worth, J., Weiss, A. P., Ball, L. A., & Herman, J. (2012). Measuring outcomes in adult outpatient psychiatry. Clinical Psychology & Psychotherapy, 19(3), 203–213. https://doi.org/https://doi.org/10.1002/cpp.749
- Brosseau-Liard, P. E., & Savalei, V. (2014). Adjusting incremental fit indices for nonnormality. Multivariate Behavioral Research, 49(5), 460–470. https://doi.org/https://doi.org/10.1080/00273171.2014.933697
- Cronbach, L. J. (1951). Coefficient alpha and the internal structure of tests. Psychometrika, 16(3), 297–334. https://doi.org/https://doi.org/10.1007/BF02310555
- Dragomirecka, E., Lenderking, W. R., Motlova, L., Goppoldova, E., & Šelepova, P. (2006). A brief mental health outcomes measure: Translation and validation of the Czech version of the Schwartz Outcomes Scale-10. Quality of Life Research: An International Journal of Quality of Life Aspects of Treatment, Care and Rehabilitation, 15(2), 307–312. https://doi.org/https://doi.org/10.1007/s11136-005-1389-y
- Durham, C. J., McGrath, L. D., Burlingame, G. M., Schaalje, G. B., Lambert, M. J., & Davies, D. R. (2002). The effects of repeated administrations on self-report and parent-report scales. Journal of Psychoeducational Assessment, 20(3), 240–257. https://doi.org/https://doi.org/10.1177/073428290202000302
- Evans, C., Connell, J., Barkham, M., Margison, F., McGrath, G., Mellor-Clark, J., & Audin, K. (2002). Towards a standardised brief outcome measure: Psychometric properties and utility of the CORE-OM. The British Journal of Psychiatry: The Journal of Mental Science, 180(01), 51–60. https://doi.org/https://doi.org/10.1192/bjp.180.1.51
- Evans, C., Dolan, B., & Toriola, A. (1997). Detection of intra- and cross-cultural non-equivalence by simple methods in cross-cultural research: Evidence from a study of eating attitudes in Nigeria and Britain. Eating and Weight Disorders: EWD, 2(2), 67–78. https://doi.org/https://doi.org/10.1007/BF03397154
- Guyon, H., Kop, J.-L., Juhel, J., & Falissard, B. (2018). Measurement, ontology, and epistemology: Psychology needs pragmatism-realism. Theory & Psychology, 28(2), 149–171. https://doi.org/https://doi.org/10.1177/0959354318761606
- Haggerty, G., Blake, M., Naraine, M., Siefert, C., & Blais, M. A. (2010). Construct validity of the Schwartz Outcome Scale-10: Comparisons to interpersonal distress, Adult attachment, Alexithymia, the Five-Factor Model, Romantic Relationship length and ratings of childhood memories. Clinical Psychology & Psychotherapy, 17(1), 44–50. https://doi.org/https://doi.org/10.1002/cpp.643
- Hu, L., & Bentler, P. M. (1999). Cutoff criteria for fit indexes in covariance structure analysis: Conventional criteria versus new alternatives. Structural Equation Modeling: A Multidisciplinary Journal, 6(1), 1–55. https://doi.org/https://doi.org/10.1080/10705519909540118
- Jacobson, N., & Truax, P. (1991). Clinical significance: a statistical approach to defining meaningful change in psychotherapy research. Journal of Consulting and Clinical Psychology, 59(1), 12–19. https://doi.org/https://doi.org/10.1037/0022-006X.59.1.12
- Jamil, L., Dehghani, M., Fathali Lavasani, F., & Mahaki, B. (2019). Psychometric properties of the Farsi version of the Schwartz Outcome Scale. Iranian Journal of Psychiatry and Behavioral Sciences. https://doi.org/https://doi.org/10.5812/ijpbs.90863
- Koetse, M. J., Florax, R. J. G. M., & de Groot, H. L. F. (2010). Consequences of effect size heterogeneity for meta-analysis: A Monte Carlo study. Statistical Methods and Applications, 19(2), 217–236. https://doi.org/https://doi.org/10.1007/s10260-009-0125-0
- Lambert, M., Hansen, N., & Harmon, S. (2010). Outcome Questionnaire System (The OQ System): Development and practical applications in healthcare settings. In M. Barkham, G. E. Hardy, & J. Mellor-Clark (Eds.), Developing and delivering practice-based evidence: A guide for the psyhological therapies (pp. 141–155). Wiley-Blackwell.
- Lambert, M. J., Hansen, N., Umphress, V., Lunnen, K., Okiishi, J., Burlingamen, G., & Reisinger, C. (1996). Administration and scoring manual for the OQ-45.2. American Professional Credentialing Services.
- Laux, J. M., & Ahern, B. (2003). Concurrent validity of the Schwartz Outcome Scale with a chemically dependent population. Journal of Addictions & Offender Counseling, 24(1), 2–10. https://doi.org/https://doi.org/10.1002/j.2161-1874.2003.tb00177.x
- Laux, J. M., Young, J. L., McLaughlin, L. P., & Perera-Diltz, D. (2006). The development and evaluation of the French version of the Schwartz Outcome Scale-10 (SOS-10-F). Canadian Journal of Counselling, 40(4), 195–208.
- Mardia, K. V. (1970). Measures of multivariate skewness and kurtosis with applications. Biometrika, 57(3), 519–530. https://doi.org/https://doi.org/10.1093/biomet/57.3.519
- McDonald, R. P. (2013). Test theory. Psychology Press. https://doi.org/https://doi.org/10.4324/9781410601087
- Mohammed, H. R. (2008). Development of an Arabic version of the Schwartz Outcome Scale-10: A brief mental health outcome measure. Journal of Educational & Psychological Sciences, 9(3), 11–24. https://doi.org/https://doi.org/10.12785/JEPS/090311
- Montero, M. (2018). Community psychology: A Latin American creation. In R. Ardila (Ed.), Psychology in Latin America (pp. 195–219). Springer International Publishing. https://doi.org/https://doi.org/10.1007/978-3-319-93569-0_9
- Nalbantoğlu Yılmaz, F. (2019). Comparison of different estimation methods used in confirmatory factor analyses in non-normal data: A Monte Carlo study. International Online Journal of Educational Sciences, 11(4), 131–140. https://doi.org/https://doi.org/10.15345/iojes.2019.04.010
- Ogles, B. M., Lambert, M. J., & Fields, S. A. (2002). Essentials of outcome assessment. John Wiley & Sons Inc.
- Oldford, R. W., & MacKay, R. J. (2000). Scientific method, statistical method and the speed of light. Statistical Science, 15(3), 254–278. https://doi.org/https://doi.org/10.1214/ss/1009212817
- Paz, C., Mascialino, G., Proaño, K., & Evans, C. (2020). Psychological intervention change measurement in Latin America: Where from? Where to? Psychotherapy Research, 1–10. https://doi.org/https://doi.org/10.1080/10503307.2020.1750728
- Pew Research Center. (2017). Use of Spanish declines among Latinos in major U.S. metros. http://pewrsr.ch/2yhit5k
- R Core Team. (2019). R: A language and environment for statistical computing. R Foundation for Statistical Computing.
- Rhemtulla, M., Brosseau-Liard, P. É., & Savalei, V. (2012). When can categorical variables be treated as continuous? A comparison of robust continuous and categorical SEM estimation methods under suboptimal conditions. Psychological Methods, 17(3), 354–373. https://doi.org/https://doi.org/10.1037/a0029315
- Rivas-Vazquez, R. A., Rivas-Vazquez, A., Blais, M. A., Rey, G. J., Rivas-Vazquez, F., Jacobo, M., & Carrazana, E. J. (2001). Development of a Spanish version of the Schwartz Outcome Scale-10: A brief mental health outcome measure. Journal of Personality Assessment, 77(3), 436–446. https://doi.org/https://doi.org/10.1207/S15327752JPA7703_05
- Rodríguez, J. J. (2010). Mental health care systems in Latin America and the Caribbean. International Review of Psychiatry (Abingdon, England), 22(4), 317–324. https://doi.org/https://doi.org/10.3109/09540261.2010.500863
- Rosseel, Y. (2012). lavaan: An R package for structural equation modeling. Journal of Statistical Software, 48(2), 1–93. https://doi.org/https://doi.org/10.18637/jss.v048.i02
- Rouse, S. V. (2007). Using reliability generalization methods to explore measurement error: An illustration using the MMPI-2 PSY-5 scales. Journal of Personality Assessment, 88(3), 264–275. https://doi.org/https://doi.org/10.1080/00223890701293908
- Rubio-Aparicio, M., Núñez-Núñez, R. M., Sánchez-Meca, J., López-Pina, J. A., Marín-Martínez, F., & López-López, J. A. (2020). The Padua Inventory-Washington State University revision of obsessions and compulsions: A reliability generalization meta-analysis. Journal of Personality Assessment, 102(1), 113–123. https://doi.org/https://doi.org/10.1080/00223891.2018.1483378
- Satorra, A., & Bentler, P. M. (2001). A scaled difference chi-square test statistic for moment structure analysis. Psychometrika, 66(4), 507–514. https://doi.org/https://doi.org/10.1007/BF02296192
- Schreiber, J. B., Nora, A., Stage, F. K., Barlow, E. A., & King, J. (2006). Reporting structural equation modeling and confirmatory factor analysis results: A review. The Journal of Educational Research, 99(6), 323–338. https://doi.org/https://doi.org/10.3200/JOER.99.6.323-338
- Spiegelhalter, D. (2019). Art of statistics: Learning from data. Penguin Books, Limited.
- Tarescavage, A. M., & Ben-Porath, Y. S. (2014). Psychotherapeutic outcomes measures: A critical review for practitioners. Journal of Clinical Psychology, 70(9), 808–830. https://doi.org/https://doi.org/10.1002/jclp.22080
- Tebes, J. K. (2005). Community science, philosophy of science, and the practice of research. American Journal of Community Psychology, 35(3–4), 213–230. https://doi.org/https://doi.org/10.1007/s10464-005-3399-x
- Trujillo, A., Feixas, G., Bados, A., Garcia-Grau, E., Salla, M., Medina, J. C., Montesano, A., Soriano, J., Medeiros-Ferreira, L., Canete, J., Corbella, S., Grau, A., Lana, F., & Evans, C. (2016). Psychometric properties of the Spanish version of the clinical outcomes in routine evaluation–Outcome measure. Neuropsychiatric Disease and Treatment, 12, 1457–1466. https://doi.org/https://doi.org/10.2147/NDT.S103079
- Vacha-Haase, T. (1998). Reliability generalization: Exploring variance in measurement error affecting score reliability across studies. Educational and Psychological Measurement, 58(1), 6–20. https://doi.org/https://doi.org/10.1177/0013164498058001002
- Vacha-Haase, T., & Thompson, B. (2011). Score reliability: A retrospective look back at 12 years of reliability generalization studies. Measurement and Evaluation in Counseling and Development, 44(3), 159–168. https://doi.org/https://doi.org/10.1177/0748175611409845
- von Bergen, A., & de la Parra, G. (2002). OQ-45.2, Cuestionario para evaluación de resultados y evolución en psicoterapia: Adaptación, validación e indicaciones para su aplicación e interpretación. Terapia Psicológica, 20(2), 161–176.
- Wilkinson, L., & Task Force on Statistical Inference, American Psychological Association, S. D. (1999). Statistical methods in psychology journals: Guidelines and explanations. American Psychologist, 54(8), 594–604. https://doi.org/https://doi.org/10.1037/0003-066X.54.8.594
- Young, J. L., Waehler, C. A., Laux, J. M., McDaniel, P. S., & Hilsenroth, M. J. (2003). Four studies extending the utility of the Schwartz Outcome Scale (SOS-10). Journal of Personality Assessment, 80(2), 130–138. https://doi.org/https://doi.org/10.1207/S15327752JPA8002_02