
Abstract
Character strengths are assessed in adults and adolescents using different measurements. However, a comparison of character strengths across age groups requires the equivalence of these measurements. The present study examined the comparability of the two questionnaires most frequently used in research: The VIA Inventory of Strengths (VIA-IS) for adults and the VIA Inventory of Strengths for Youth (VIA-Youth). A sample of N = 170 high-school students in the age of about 18 years and up to two informants (N = 164 mostly parents; N = 156 mostly friends and partners) completed both character strengths questionnaires and several well-being questionnaires. The psychometric characteristics and the correlations with well-being scales were examined once exclusively on the basis of self-rating and once on the basis of combined self- and informant-ratings. Substantial differences between the questionnaires were found in each of the criteria examined (e.g., identification of signature strengths, or largest associations with well-being). The results indicate that VIA-IS and VIA-Youth measure character strengths differently, so that a comparison across age groups may lead to biased conclusions. Therefore, differences in character strengths between adults and adolescents should not be exclusively interpreted in terms of differences on the trait level as these differences may be caused by nonequivalent questionnaires.
The study of character strengths originated more than 20 years ago from the cross talk between the emerging fields of positive youth developmentFootnote1 and positive psychology (Peterson & Seligman, Citation2004). At the beginning of this research, it soon became clear that two questions needed to be answered, namely “how can one define the concepts of ‘strength’ and ‘highest potential’ and how can one tell that a positive youth development program has succeeded in meeting its goals?” (Peterson & Seligman, Citation2004, p. v).
The first question was answered though the development of the Values in Action (VIA) classification of character strength of virtues (Peterson & Seligman, Citation2004). The VIA classification of strengths distinguished 24 strengths, which were assigned to one of six core virtues (i.e., wisdom and knowledge, courage, humanity, justice, temperance, and transcendence). To answer the second question, self-report scales for each of the 24 strengths were developed based on the VIA classification. In the beginning, different versions of the survey for adults (i.e., 18 years and above)—the VIA Inventory of Strengths (VIA-IS)—were designed and evaluated. The final version of the VIA-IS consisted of 240 items, the scales correlated with self-nominations substantially (<.50), were stable over a 4-month period (>.70), and only few scales had a marginal correlation with social desirability (Peterson et al., Citation2005a). Meanwhile many translations into other languages were undertaken, more than a million people filled in the scale, and more than 350 journal articles were published using the scale (Ruch & Stahlmann, Citation2020). In many of these studies, the criterion-related validity (e.g., well-being; Bruna et al., Citation2019; health; Proyer et al., Citation2013) and evidence for measurement invariance (e.g., with regard to different cultures; McGrath, Citation2016) of the VIA-IS could be demonstrated, whereas studies on the factorial validity provided mixed results (for an overview, see Feraco et al., Citation2021).
As the VIA project focused on building a bridge between the emerging positive psychology field and its application in youth development, it is not surprising that an inventory for young people (aged 10–17) followed soon after, the VIA Inventory of Strengths for Youth (VIA-Youth; Park & Peterson, Citation2006). Initially, separate inventories for preadolescents and adolescents were created by adapting items from the adult survey and phrasing them in a developmentally appropriate way, but later they were merged into one. The final inventory for adolescents presented by Park and Peterson (Citation2006) contained 198 items. Park and Peterson (Citation2006) presented results from different US samples and reported reliability estimations of α > .70 for all 24 scales, and six-month test-retest correlations between .46 and .71. In addition, several studies provided evidence for the criterion-related validity (e.g., well-being; Ruch et al., Citation2014; academic achievement; Wagner et al., Citation2020) and the measurement invariance (e.g., with regard to different cultures; McGrath & Walker, Citation2016) of the VIA-Youth, whereas the factorial validity seems to be different with regard to the VIA-IS (e.g., McGrath & Walker, Citation2016).
In general, with the VIA-IS and the VIA-Youth, two psychometrically sound and valid measurements of character strengths are available to research as well as to practice. Although both measurements have their different domains of applicability (i.e., adolescents vs. adults), they are implicitly expected to yield comparable results to generalize findings across the entire life span. However, and in contrast to other personality measures (for a comparison of different personality measures for adults, see Pace & Brannick, Citation2010), no comparison of the two was undertaken conceptually or empirically, although discrepancies in results have become more apparent over time, as will be discussed below, calling into question the assumed equivalency of the questionnaires.
Comparison of the VIS-IS and the VIA-Youth
Indications on conceptual level for the equivalence and nonequivalence
From a conceptual perspective, there are several factors that allow suggesting that the VIA-IS and the VIA-Youth will yield similar results whereas other factors will help making them different. First, both inventories are based on the same 24 strength classification (Peterson & Seligman, Citation2004). Second, there is some overlap in the item substance; Peterson and Seligman (Citation2004) wrote that they "created separate inventories for preadolescents and adolescents by adapting items from the adult survey and phrasing them in what [they] thought were developmentally appropriate ways" (p. 634). If the item substance of many items was preserved when reformulating the items, then one expects them to make the two versions more similar. Third, both versions apply the same answer format (5-point Likert scale) and word the items in extreme fashion (“I always …”), thereby anchoring the upper end of the scale. This then also is seen as a prerequisite to be able to compare across strengths; that means to rank order strengths from top to bottom in an individual.
There are factors that will make the two inventories different. First, the three points above that can make the inventories similar, also have the potential to make them dissimilar if they fail. Second, contrary to the VIA-IS, the VIA-Youth has inverted items, which might increase the variability between the two measures because of reduced acquiescence effects. Also, impulsive individuals, lower reading level and time urgency might make people overlook the negation in the VIA-Youth items. Similar issues can occur with the polarity of the response scales. While the scale in VIA-IS ranges from 1 = very much unlike me to 5 = very much like me, the opposite is true for VIA-Youth (i.e., 1 = very much like me to 5 = very much unlike me). Third, the number of items and thus the time required to complete the questionnaires varies slightly: the VIA-IS contains 240 items, whereas the VIA-Youth contains only 198 items.
Empirical indications for the nonequivalence
The authors of the character strengths questionnaires never claimed that the two versions are strictly parallel, and it appears as if these are from different domains in the literature. Although differences, for example, in the expression of character strengths between adults and adolescents were discussed in the article that introduced the VIA-Youth (Park & Peterson, Citation2006), no reference to measurements’ specifics of the VIA-IS were made in this article; and to our knowledge no study exists that tests the same hypothesis with the VIA-Youth (i.e., among adolescents) and the VIA-IS (i.e., among adults). Nevertheless, findings based on adolescents and adults — and especially discrepancies between these two groups — are repeatedly discussed comparatively in the literature.
For example, the first criterion defining character strength states that that a strength "contributes to various fulfillments that constitute the good life, for oneself and for others" (Peterson & Seligman, Citation2004, p. 17). Therefore, the 24 strengths of the VIA-Youth should predict well-being during childhood and adolescence, and the VIA-IS during adulthood, using a life satisfaction scale for students (e.g., SLSS; Huebner, Citation1991) and adults (e.g., SWLS; Diener et al., Citation1985), respectively. However, this criterion reveals a crucial discrepancy between the two questionnaires. Bruna et al. (Citation2019) included 28-30 studies in their meta-analysis regarding the relation between character strengths and well-being in adults. For the sake of comparison and as no such analysis exists for adolescents, we used Goh et al.’s (Citation2016) approach to meta-analyze the relation between character strengths and well-being across two published studies (Blanca et al., Citation2018; Ruch et al., Citation2014) and seven unpublished data sets from our own lab (see Supplement Table S7)Footnote2. According to Bruna et al. (Citation2019), the highest five correlations for the VIA-IS were hope (.56), zest (.52), love (.44), gratitude (.44), and curiosity (.40). According to our data, the highest five coefficients found for the VIA-Youth were love (.49), hope (.49), gratitude (.48), zest (.45), and social intelligence (.33). Despite some other discrepancies, curiosity was only weakly correlated with life satisfaction (.14) in our data. Thus, curiosity was not among the happiness strengths and actually ranked in the last places in contrast to Bruna et al. (Citation2019; see Supplement Table S7). This observation that VIA-IS curiosity correlated well with life satisfaction in adults (see also Park et al., Citation2004; Ruch et al., Citation2010), but VIA-Youth curiosity does not (see also Park & Peterson, Citation2006; Ruch et al., Citation2014), is often mentioned in the literature (e.g., Peterson & Park, Citation2009; Ruch et al., Citation2014) without a conclusive explanation. In fact, it is unclear whether this finding is caused by differences in the samples (adults vs. adolescents) or whether differences in the assessment of life satisfaction (SWLS; SLSS) or in the assessment of character strengths (VIA-IS, VIA-Youth) are the reasons. If this discrepancy is indeed due to differences in the samples, then this would not only have consequences for the validity of character strengths (i.e., a different correlation pattern indicates a different criterion-related validity of character strengths for adults and adolescents) but would also have an impact on the development of intervention programs for adolescents in educational contexts (i.e., interventions usually target those character strengths associated with well-being, which would mean that programs for adults but not for adolescents should include curiosity).
Furthermore, Park and Peterson (Citation2006) reported different highest strengths for adults and adolescents. In detail, they found a rank correlation of .53 between the order of character strengths elevation of adults (based on Park et al., Citation2004) and adolescents. In addition, they emphasized that appreciation of beauty and excellence, honesty, leadership, and open-mindednessFootnote3 were higher elevated among adults than adolescents, whereas hope, teamwork, and zest were higher elevated among adolescents than adults. Likewise, Heintz and Ruch (Citation2021) presented a meta-analysis (47 samples with a total N of 1,098,748) that investigates cross-sectional age differences in the 24 character strengths. Although they did not compare age differences between adolescents and adults because of the different questionnaires used in the respective age groups (i.e., VIA-Youth for adolescents and VIA-IS for adults), a closer inspection of the relative elevation reveals some unusually large gaps exactly between the age range in which the questionnaire for adolescents (up to 17 years) is changed to the questionnaire for adults (from 18 years). This gap indicated sometimes a higher (e.g., curiosity, leadership, fairness) and sometimes a lower (e.g., bravery, teamwork, gratitude) relative elevation among adults compared to adolescents (see Figure 2 in Heintz & Ruch, Citation2021). However, as Heintz and Ruch (Citation2021) correctly emphasized, in order to interpret these differences in terms of developmental trajectories, comparable questionnaires are required, as it cannot be ruled out that the questionnaires measure character strengths differently. This issue is especially important for the assessment of the signature strengths (i.e., the character strengths that represents the core of a person’s identity; Peterson & Seligman, Citation2004), which are used, for example, for vocational and career counseling. If both questionnaires measure character strengths differently, then in the worst case — albeit somewhat constructed — scenario, a person whose character strengths were assessed shortly before the 18th birthday could receive a different career recommendation than if the character strengths were assessed shortly after the 18th birthday.
In summary, the adult and adolescent versions of the VIA questionnaires are expected to yield comparable results, but there are several findings in the literature that indicate either true differences in character strengths between adults and adolescents or non-comparable measures. As age span and test forms (VIA-IS vs. YIA-Youth) were confounded in previous studies, it is not clear whether age differences or nonequivalent test forms are the reason for these differences. In addition, it should be noted that one of the most important comparison with regard to the construct validity of both questionnaires has not been done so far, namely how high the homologous scales of the character strengths questionnaires do indeed intercorrelate (i.e., whether they measure the same construct). For example, a meta-analysis comparing the convergent validity of questionnaires for adults regarding the Five Factor model of personality demonstrated only a moderate correlation (rmean ∼ .60), which was interpreted as insufficient (Pace & Brannick, Citation2010). Extending these findings to character strengths questionnaires in the present study and, thus, to determine the extent to which the results found for one questionnaire would also be valid for the other, both character strength questionnaires and the same life satisfaction measures were assessed in the same sample; that means a sample where both instruments are applicable (e.g., 18-year-olds). If the difference still emerges, then it is, at least in part, due to the forms of character strengths questionnaires.
The present study
The present study aims at empirically comparing the assessment of 24 character strengths with the VIA-IS and the VIA-Youth based on the same sample. Thus, we want to shed light on whether potential differences in the assessment of character strengths are small enough to allow the results to be compared across questionnaires and, thus, across age groups. If the VIA-IS and the VIA-Youth are sufficiently equivalent, then only negligible differences should be observed.
We have considered the following criteria regarding the equivalence of the questionnaires based on commonly used criteria of test construction and validation (e.g., Flake et al., Citation2017; Ziegler, Citation2014)Footnote4. First, we examined the descriptive statistics of both questionnaires (i.e., mean scale scores, internal consistency, and signature strengths), in particular with regard to whether the differences between adolescents and adults (e.g., Heintz & Ruch, Citation2021) are due to the questionnaires used in the respective age group. Second, and for the first time in character strength research, we examined the construct validity in terms of convergent and discriminant correlations of the character strengths scales from both questionnaires. Third, we compared the associations between character strengths and well-being with regard to the potentially different criterion-related validity of character strengths in adolescents and adults (e.g., Peterson & Park, Citation2009).
In order to draw conclusions about the equivalence of the VIA-IS and the VIA-Youth, age effects and the effects of the measurements of well-being have to be ruled out. Therefore, and with regard to the former, participants in the age of about 18 years participated in the present study as this is an age at which both characters strengths questionnaires can be applied. In addition, the homogenous age means that no developmental trends can be present in the data. Regarding the influence of well-being measurements, different questionnaires were considered, which are commonly used in the research field of character strengths and which were developed either specifically for adults or for adolescents. This approach makes it possible to investigate whether the differences between character strengths and well-being reported in the literature are due to different and age-specific measurements of well-being.
The present study focuses on self-reported measurements of character strengths and well-being. Self-reports are the most common assessment method within the research field of character strengths. Therefore, the findings obtained in the present study can be related to those of previous studies. However, self-reports are prone to several biases (e.g., socially desirable answers, answer tendencies, response styles), which could influence the association between character strengths and well-being (McCrae, Citation1982). Therefore, we also have included informant-reports in our study and additionally present analyses based on both forms to investigate whether the results change when information from different sources is considered. Furthermore, as this is the first study in which a comparison of both questionnaires is conducted, we did not formulate specific expectations regarding differences, but consider the present study as exploratory (see also de Groot, Citation2014).
Materials and methods
Participants
Self-rating sample
We asked 175 students to participate in our study. Three participants did not provide permission of their parents and, thus, were excluded from the study. Furthermore, two participants did not complete the character strengths questionnaires and were excluded as well. The final size of the self-rating sample was N = 170. Participants were primarily high school students (97.60%). The average age was 18.30 years (SD = 0.68, Min = 17, Max = 20) and 77.60% of the participants were female.
Informant-rating sample
The first informant-rating sample consisted of N = 164 relatives (74.70% female), of which 89.40% were the self-raters’ parents. The average age was 47.40 years (SD = 8.52, Min = 17, Max = 74).
The second informant-rating sample consisted of N = 156 peers (60% female), of which 69.40% were a self-rater’s friend and 16.50% the self-raters’ partner. The average age was 19.50 years (SD = 4.49, Min = 16, Max = 58).
Material
Character strengths
The VIA Inventory of Strengths (VIA-IS; Peterson et al., Citation2005a) consists of 240 items for the self-report assessment of the 24 character strengths (10 items per strength) in adults (18 years and above). All items of the VIA-IS are positively worded and have to be answered using a 5-point Likert-style format (i.e., 1 = very much unlike me; 5 = very much like me). Scale scores were computed by calculating the means of the respective items. We used the German version of the VIA-IS (Ruch et al., Citation2010), which showed good reliabilities for all 24 scales (i.e., Cronbach’s ⍺Mdn = .77; test-retest reliability for 3 months: rMdn = .85).
The German version (Ruch et al., Citation2014) of the VIA Inventory of Strengths for Youth (VIA-Youth; Park & Peterson, Citation2006) was additionally applied. The VIA-Youth was developed to assess the 24 character strengths in adolescents (10 to 17 years). It consists of 198 items (i.e., 7-9 items per strength) and about one third of the items are negatively worded. All items have to be answered using a 5-point Likert-style format (i.e., 1 = very much like me; 5 = very much unlike me). For the present study, the response scale of the VIA-Youth was reversed coded in order to have the same orientation as the VIA-IS. Scale scores were computed by calculating the means of the respective items after inverting the negatively worded items. Ruch et al. (Citation2014) reported good reliabilities of the German version of the VIA-Youth (i.e., Cronbach’s ⍺Mdn = .77; test-retest reliability for 4 months: rMdn = .72).
In addition to the self-rating form, an informant-rating form for both measurements were applied. The informant-rating forms were identical to the self-rating questionnaires, but all items were rephrased for informant-evaluations. The same answer format was used but with rephrased categories (e.g., 1 = very much unlike him/her). The informant-rating version of the measurement demonstrated good reliabilities in previous studies: Cronbach’s ⍺Mdn = .81 (Ruch et al., Citation2010) and .80 (Ruch et al., Citation2014) for the VIA-IS and the VIA-Youth, respectively.
Well-Being
The Satisfaction with Life Scale (SWLS; Diener et al., Citation1985) in the German version (Ruch et al., Citation2010) is a global measure of satisfaction of life in adults. The scale consists of 5 positively worded items which have to be answered using 7-point Likert-style format (i.e., 1 = strongly disagree, 7 = strongly agree). All items were averaged to calculate a scale score. Previous studies demonstrated a high reliability of the German version of the SWLS (e.g., Cronbach’s ⍺ = .86; Ruch et al., Citation2010).
The Students’ Life Satisfaction Scale (SLSS; Huebner, Citation1991) adapted to German by Weber et al. (Citation2013) is a seven-item measure of global satisfaction with life in youth. Its items are positively worded and it uses a 6-point Likert-style format (i.e., 1 = strongly disagree, 6 = strongly agree). All items were averaged to calculate a global score. The German version of the SLSS showed good reliabilities in previous studies (e.g., Cronbach’s ⍺ = .88; test-retest reliability for 4 months r = .55; Weber et al., Citation2013).
The German version (e.g., Weber et al., Citation2013) of the Brief Multidimensional Students’ Life Satisfaction Scale (BMSLSS; Seligson et al., Citation2003) was applied to measure adolescents’ satisfaction with five specific topics (i.e., family, relationships, school experiences, self, and living environment) as well as overall life satisfaction. The six items (i.e., the original five topic-specific items and the additional overall item) are positively worded and use a 7-point Likert-style format (i.e., 1 = extremely unsatisfied, 7 = extremely satisfied). All items were averaged in order to calculate a general satisfaction with life score. Reliabilities of the German version of the BMSLSS (i.e., without the overall life satisfaction item) can be considered as good (Cronbach’s ⍺ = .75; Weber et al., Citation2013).
The Orientation to Happiness scale (OTH; Peterson et al., Citation2005b) in the German version (Ruch et al., Citation2010) was applied. The OTH scale is an 18-item questionnaire for the subjective assessment in adults of life of pleasure, life of engagement, and life of meaning (six items each). All items are positively worded and have to be answered using a 5-point Likert-style format (i.e., 1 = very much like me; 5 = very much unlike me). The reliability of the German version was acceptable in previous studies: Cronbach’s ⍺ ≥ .63, test-retest reliability for 3 months r ≥ .63 (Ruch et al., Citation2010).
Furthermore, informant-report forms of these four questionnaires were applied. The informant-report forms were identical to the self-report forms except the items and response scales were formulated in third person singular. Previous studies provided evidence regarding reliability and validity of some of these informant-report forms in German or English (e.g., SWLS: Pavot & Diener, Citation2009; OTH: Wagner et al., Citation2019).
Procedure
Data were collected in schools in Switzerland and in Germany. An informed instructor introduced all participants directly in the classrooms. Participants completed the questionnaires at home and within one week. The questionnaires were divided into two sessions, each lasting about 30-45 minutes. The order of presentation of the VIA questionnaires were randomized (i.e., half of the participants first completed the VIA-IS and then the VIA-Youth, and the other half first completed the VIA-Youth and then the VIA-IS). All received written individualized feedback on their character strengths and additional information on the meaning of each of the strengths and the VIA classification. All participants attended voluntarily and without remuneration. Additionally, all participants younger than 18 years provided the permission of their parents or legal guardians. According to the local university guidelines, no ethics approval was required for this study.
Statistical analysis
All analyses were performed once with the self-rating sample (N = 170) and once with the combined sample of self-rating and informant-ratings. With regard to the latter, all participants were considered from whom self-rating data and at least the data from one informant-rating were present (N = 166). The self-ratings and informant-ratings were aggregated into one global score (see Supplement Table S2 and Supplement Table S4 for the correlations between self-ratings and informant-ratings for the VIA questionnaires and the well-being measures, respectively). As averaging across multiple raters increases trait variances and decreases methods variance (e.g., Chang et al., Citation2012), the findings based on the combined scores provide potentially less biased insights in particular regarding the association with well-being.Footnote5
Table 2. Correlations between character strengths and well-being (self-rating sample).
In the first step, we inspected the descriptive statistics of both character strengths questionnaires. In detail, we examined whether the average scale score for each character strength was similar between the VIA-IS and the VIA-Youth. We considered a mean difference (i.e., Cohen’s |dz| for correlated measurements; see, e.g., formula 6 in Lakens, Citation2013) of 0.22 as substantial as it approximately correspondents to a small effect according to Gignac and Szodorai (Citation2016)Footnote6. Following an equivalence testing approach with regard to mean differences (Lakens, Citation2017), we deemed a difference as statistically significant if the 90% confidence interval included the critical effect size and the 95% confidence interval did not include zero. An undetermined difference implies that the sample size was not large enough to determine whether the mean difference was statistically different or not. Given the sample size, the critical difference of |dz| = .22, and α = .05, a sensitivity analysis revealed a statistical power for each equivalence test of 0.80 for the self-rating sample and 0.79 for the combined sample. Furthermore, McDonald’s ω was calculated as a reliability measure of the scale scores (see Kelley & Pornprasertmanit, Citation2016).
In addition to the comparison of the average scale scores, we investigated the signature strengths (i.e., the character strengths with the highest scale sore; e.g., McGrath & Wallace, Citation2021; Peterson & Seligman, Citation2004) of both character strengths questionnaires. As tied scale scores can be a challenge in identifying a person’s signature strengths (e.g., Blanchard et al., Citation2019), we applied a more liberal approach and classified all character strengths with the fiveFootnote7 highest scale scores as signature strengths. We then counted how often each character strength was a signature strength across all participants based on bootstrapped rank order positions. Differences regarding signature strengths between the questionnaires were examined based on bootstrapped 95% confidence intervals. In addition, we compared per person how often the signature strengths in the VIA-IS were also signature strengths in the VIA-Youth.
In the second step, we examined the construct validity of the character strengths by the means of a classical multitrait-multimethod (MTMM) analysis (Campbell & Fiske, Citation1959). As a strict test for construct validity, the lowest convergent validity coefficient (i.e., monotrait-heteromethod correlations) should be higher in value than the highest discriminant validity coefficient (i.e., heterotrait-heteromethod correlations). Furthermore, none of the correlations between the character strengths within each measurement (i.e., heterotrait-monomethod correlations) should be higher than the lowest convergent validity coefficient. In addition to this global test, the convergent and discriminant correlations were separately examined for each character strength.
In the final step, we investigated the association between character strengths and well-being in terms of criterion validity. As the different well-being measurements had different scales (i.e., 5-point vs. 7-point Likert-style format), all scale scores were transformed into percent of maximum possible (POMP) scores (Cohen et al., Citation1999) to facilitate comparability of the descriptive statistics. McDonald’s ω was calculated to estimate the reliability after examining the structural validity (i.e., unidimensionality) of the well-being measures (not presented in detail). The correlations between character strengths scales and the well-being scales were evaluated based on Pearson’s correlation coefficients. With regard to the difference of correlations between well-being and character strengths measured either with the VIA-IS or with the VIA-Youth, we calculated for each character strength difference scores of correlations (based on the Fisher z-transformation) and their confidence intervals based on Wilcox’ (Citation2016) bootstrap approach. Following an equivalence testing approach with regard to differences in correlations (Lakens, Citation2017), we deemed a difference as significant if the 90% confidence interval included the critical effect size and the 95% confidence interval did not include zero. We considered a difference of the correlations of |Δr| = .22 to be significant. This effect size, which approximately corresponds to a medium effect according to Gignac and Szodorai (Citation2016), allows to statistically examine the differences with a statistical power of 0.80 for both samples (based on a sensitivity analysis given the sample size, the critical difference |Δr|, and α = .05). As a smaller effect size would result in less statistical power for the given sample size, we considered this effect size to be appropriate.
The maximum percentage of missing data (i.e., across all items per person) was 4.1% and 8.4% for the self-rating sample and the informant-rating sample, respectively. Missing data were imputed on item level based on polytomous regression. In order to control for measurement error, all correlation coefficients including the confidence intervals (see Padilla & Veprinsky, Citation2012) were corrected for attenuation based on Spearman’s (Citation1904) formula. Bootstrapped analyses were conducted with 10,000 draws. For all analyses, we used the software R (Version 3.6.2; R Core Team, Citation2019)Footnote8.
Results
Descriptive statistics
Self-rating sample
Supplement Table S1 displays the descriptive statistics of each character strength, the mean differences of the scale scores of the VIA-IS and the VIA-Youth, and the reliability estimations. According to the equivalence testing approach, 18 of the 24 scales had a different average scale score.
Table 1. Summary of the multitrait-multimethod (MTMM) matrix (self-rating sample).
The median reliability (ωMdn) of the VIA-IS and the VIA-Youth scales was .82 (ωMin = .60, ωMax = .92) and .72 (ωMin = .60, ωMax = .90), respectively. Reliability was comparable for most of the scales (i.e., ΔωMdn = .03).
Combined self- and informant-rating sample
Descriptive statistics and the reliability estimations are displayed in Supplement Table S2. Similar to the self-rating sample, 19 of the 24 VIA-IS scales had a substantially different mean scale score compared to the VIA-Youth scales.
The reliabilities were higher compared to the self-rating sample. The median reliability of the VIA-IS and the VIA-Youth scales was .85 (ωMin = .72, ωMax = .96) and .82 (ωMin = .75, ωMax = .94), respectively. Reliabilities were slightly more similar between the VIA-IS and the VIA-Youth scales compared to the self-rating sample (i.e., ΔωMdn = .02).
Signature strengths
Self-rating sample
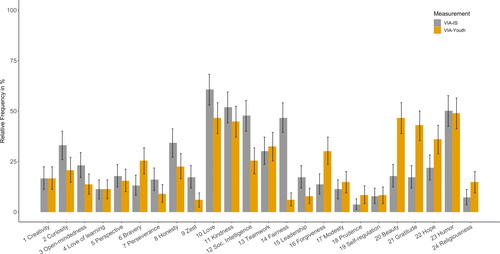
In the next step, we investigated the signature strengths (i.e., the five character strengths with the highest scale sores) in both questionnaires. displays the relative frequency for each character strength separately for the VIA-IS and VIA-Youth. As can be seen, there are substantial differences: The character strengths of zest, social intelligence, fairness, and leadership were more often a signature strength in the VIA-IS than in the VIA-Youth. It was the other way around with bravery, forgiveness, appreciation of beauty and excellence, gratitude, and hope, which were more often a signature strength in the VIA-Youth than in the VIA-IS. Furthermore, we examined how often the same five signature strengths were identified in the VIA-IS and the VIA-Youth. Only for 5.29% of the participants were the signature strengths in the VIA-IS the same as in the VIA-Youth. If one or two discrepancies were allowed, then the percentage increased to 31.18% and 73.53%, respectively.
Figure 1. Relative frequency of each character strength to be a signature strength for the VIA-IS and the VIA Youth (self-rating sample).
Note. Soc. Intelligence = Social Intelligence; Beauty = Appreciation of Beauty and Excellence. Error bars represent 95% confidence interval.
Combined self- and informant-rating sample
The character strengths of curiosity, open-mindedness, social-intelligence, and fairness were more often identified as signature strengths in the VIA-IS than in the VIA-Youth (i.e., the previously discovered difference with regard to zest and leadership was not found here, but a difference regarding curiosity and open-mindedness). Similar to the findings based on the self-rating sample, the character strengths of forgiveness, appreciation of beauty and excellence, gratitude, and hope were more often identified as signature strengths in the VIA-Youth than in the VIA-IS (i.e., the previously discovered difference with regard to bravery was not found here). Finally, the signature strengths of the VIA-IS were the same as in the VIA-Youth only in 1.81% of cases. Allowing for one or two discrepancies increased the percentage to 27.71% and 64.46%, respectively.
Multitrait-Multimethod (MTMM) analysis
The complete 48 × 48 MTMM matrices among the 24 character strengths from the VIA-IS and the VIA-Youth for both samples can be found as an online supplement: https://osf.io/m7xg9/.
Self-rating sample
The median convergent correlation (monotrait-heteromethod correlations) across all character strengths was substantial with rMdn = .89 (rMax = .63 for self-regulation, rMax = .97 for fairness). The median discriminant correlation (heterotrait-heteromethod correlations) was substantially lower with rMdn = .21 (rMax = −.34, rMax = .80). As 16 discriminant correlations were numerically higher than the lowest convergent validity correlation, the strict test of construct validity failed.
summarizes the convergent and discriminant correlations per character strength. Most of the character strengths showed evidence with regard to their construct validity (i.e., convergent validity coefficients were substantially higher than discriminant validity coefficients). However, for seven character strengths this was not the case: curiosity, perspective, zest, teamwork, leadership, self-regulation, and hope. They showed a higher discriminant correlation with character strengths either from the other measurement (heterotrait-heteromethod correlations) or within the same measurement (heterotrait-monomethod correlations) compared to the convergent correlation (monotrait-heteromethod correlation). For example, the leadership scale of the VIA-IS and the VIA-Youth had a convergent correlation of r =.66. The highest heterotrait-heteromethod correlation for the VIA-IS leadership scale was found for the VIA-Youth fairness scale (r =.75), and for the VIA-Youth leadership scale it was the VIA-IS social intelligence scale (r =.74). Furthermore, the highest heterotrait-monomethod correlation for the VIA-IS leadership scale was found for the VIA-IS fairness scale (r =.92), and for the VIA-Youth leadership scale it was the VIA-Youth perspective scale (r = .69). Thus, the leadership scale showed several discriminant correlations that were higher than the convergent correlation.
Combined self- and informant-rating sample
The median convergent correlation across all character strengths was similar to the self-rating sample (rMdn = .89, rMin = .71 for self-regulation, rMax = 1.00 for perseverance). Although the median discriminant correlation was slightly higher compared to the self-rating sample (rMdn = .31, rMin = −.37, rMax = .84), only 12 discriminant correlations were numerically higher than the lowest convergent validity correlation.
Supplement Table S3 summarizes the convergent and discriminant correlations per character strength. Except for three (i.e., curiosity, leadership, and self-regulation), all character strengths provided evidence with regard to their construct validity (i.e., convergent validity coefficients were lower than discriminant validity coefficients).
Although the strict test of construct validity also failed in the self- and informant-rating sample, the aggregation across multiple raters led to better findings regarding the construct validity compared to the self-rating sample.
Character strengths and well-being
Preliminary analyses
Self-rating sample
Supplement Table S4 displays the descriptive statistics, reliability estimates, and correlations for the well-being scales. The three life satisfaction scales (i.e., SWLS, SLSS, BMSLSS) showed good or very good reliability estimates (ω ≥ .76). As mentioned in the introduction, potential differences with regard to the association between character strengths and well-being can also be caused by different measurements of well-being. However, the very high inter-scale correlation between the well-being measurements (r ≥ .94) as well as the findings of additional analyses following the approach proposed by Gignac and Kretzschmar (Citation2017; not presented in detail) indicate that there was no evidence for unique variances of the specific well-being scales. Moreover, there was also no evidence that the association between character strengths (measured via VIA-IS or VIA-Youth) and well-being differs depending on the questionnaire used to measure life satisfaction (i.e., SWLS, SLSS, BMSLSS).Footnote9 In summary, there were no significant differences between the life satisfaction questionnaires that could influence the association between character strengths and life satisfaction. Therefore, we present only the results regarding a single, aggregated score for life satisfaction based on the three life satisfaction scales for all further analyses.
The Orientation to Happiness (OTH) scales showed relatively low reliabilities (ω ≥ .63), which, however, are comparable to previous studies (e.g., Ruch et al., Citation2010). The correlations between the OTH subscales themselves (.00 ≤ r ≤ .34) as well as between the OTH subscales and the life satisfaction scales (.06 ≤ r ≤ .43) were low to medium. We interpret these findings in such a way that the OTH subscales capture heterogeneous and distinct aspects of well-being (Peterson et al., Citation2005b) and, thus, should be considered separately.
Combined self- and informant-rating sample
As can be seen in Supplement Table S5, reliability estimates were higher than in the self-rating sample (ω ≥ .83). The associations between the three life satisfaction scales (i.e., SWLS, SLSS, BMSLSS) also implied the use of an aggregated life satisfaction score (r ≥ .95). The Orientation to Happiness (OTH) scales showed higher reliability estimates (ω ≥ .68) and correlations with each other (.19 ≤ r ≤ .58) compared to the self-rating sample. The associations between the OTH scales and the life satisfactions scales (.04 ≤ r ≤ .39) were similar to those in the self-rating sample.
Association between character strengths and well-being
Self-rating sample
The correlations between the well-being scales and the character strengths are displayed in . With regard to life satisfaction and from a descriptive perspective, there were several correlations that differed between the VIA-IS and the VIA-Youth (i.e., |Δr|Mdn = .08; .01 ≤ |Δr| ≤ .34). However, the equivalence testing approach revealed that only seven character strengths showed a substantially different association with life satisfaction: creativity, curiosity, love of learning, bravery, zest, love, and gratitude.
The median difference of the correlations between the character strengths and the OTH scales was |Δr|Mdn = .08 (.01 ≤ |Δr| ≤ .31). Based on the equivalence testing approach, there were ten character strengths that showed a substantially different correlation for a least one OTH subscale: creativity, curiosity, love of learning, bravery, kindness, fairness, forgiveness, prudence, humor, and religiousness.
In summary, 13 character strengths demonstrated a different association with at least one well-being scale depending on whether they were measured with the VIA-IS or VIA-Youth.
Combined self- and informant-rating sample
Supplement Table S6 displays the correlations between character strengths and well-being scales based on the combined sample. In general, the differences between the VIA-IS and the VIA-Youth regarding the association with life satisfaction were similar to those of the self-rating sample (i.e., |Δr|Mdn = .07; .00 ≤ |Δr| ≤ .27). However, there was only a partial overlap with the self-rating sample with regard to the results of the equivalence testing approach. Whereas no substantially different association was found for creativity and bravery, in addition to the other five character strengths mentioned above, a significantly different correlation was also found for kindness in the self- and informant-rating sample.
With regard to the OTH scales, the median difference of the correlations was |Δr|Mdn = .11 (.00 ≤ |Δr| ≤ .33). In addition to the ten character strengths described in the self-rating sample, honesty, social intelligence, teamwork, self-regulation, gratitude, and hope were also identified as a character strength that showed a different correlation pattern depending on the measurement instrument.
In summary, 18 character strengths had substantially different associations with at least one well-being measure depending on whether the character strength was measured with the VIA-IS or the VIA-Youth.
Discussion
The present study aimed to answer the question of whether it is justified to compare the character strengths of adults and adolescent across the two questionnaires VIA-IS (Peterson et al., Citation2005a) and VIA-Youth (Park & Peterson, Citation2006). Based on a self-report sample and a combined self- and informant-report sample, we observed many similarities between the questionnaires, but also several discrepancies regarding the psychometric characteristics of the questionnaires and the relations to well-being. As self-reports have been used in the vast majority of research, the following discussions refer only to the self-report sample, while the results of the combined self- and informant-report are addressed later.
(Non-)equivalence of the VIA-IS and the VIA-Youth
Descriptive statistics
About three-quarters of the character strengths scales showed different average scale scores. These findings provide evidence that a direct comparison of the relative elevation of character strengths of adults and adolescents (e.g., Park & Peterson, Citation2006) based on the two questionnaires is not justified. These results also provide insights into the age differences presented in the meta-analyses of Heintz and Ruch (Citation2021). As age and measurement were necessarily confounded in their analyses, it can be concluded that potential differences between the age groups of 16–17 (i.e., using the VIA-Youth) and 18–20 (i.e., using the VIA-IS) are not only based on developmental changes, but may also be significantly caused by different measurements per age group. As a consequence of the different average scale scores, nine character strengths were in average more often identified as a signature strength either in the VIA-IS or in the VIA-Youth. Furthermore, the exact same five signature strengths were identified in VIA-IS and VIA-Youth in about 5% of cases. Although the percentage could be increased up to almost 75% if up to two deviations were taken into account, the results indicate that the identification of signature strengths varies considerably depending on the questionnaires used.
The implications of these differences have to be considered from a methodological, conceptual and practical perspective. With regard to the latter, the implications can be described by following the illustrative example from the introduction. If a person were to go to career counseling shortly before their 18th birthday, then based on the VIA-Youth, they would most likely receive a different strengths profile and, thus, a different career choice recommendation than if the person went to counseling shortly after their birthday and, thus, had completed the VIA-IS. Strictly speaking, therefore, it does not seem reasonable for only one or the other questionnaire to be used in this age range. As long as no questionnaires are available that provide comparable results across the lifespan, it would at least be a possibility to combine the information from both questionnaires in applied contexts.
From a conceptual point of view, an evaluation of the longitudinal development of character strengths during the transition from adolescence to adulthood as well as a cross-sectional comparison of the manifestation of character strengths between adolescents and adults is not appropriate as emphasized by Heintz and Ruch (Citation2021). To solve this problem, it would be possible to empirically determine correction factors based on representative samples. That is, for example, to what extent does an expression in a character strengths scale of the VIA-Youth correspond to an expression of the scale in the VIA-IS. From our point of view, however, it is unclear whether this effort is justified compared to a new development of equivalent questionnaires (see below).
The methodological perspective is especially relevant for the identification of the signature strengths. In the present study, we used the simplest and commonly used approach, identifying character strengths via the highest scale scores of the VIA-IS or VIA-Youth (e.g., Gander et al., Citation2013; Littman-Ovadia et al., Citation2017). However, as pointed out by McGrath and Wallace (Citation2021) and others, this approach is not optimal due to tied scale scores. For example, we only classified the five highest scale scores as signature strengths, even though the difference between the lowest signature strength and the highest non-signature strength was relatively small. Our recommendation is therefore that caution is advised in using this approach to identify character strengths based on these two questionnaires. Future research has to demonstrate whether standardized norm data based on representative samples per questionnaire, different algorithms to identify signature strengths (McGrath & Wallace, Citation2021), or specific questionnaires aiming to assess signature strengths (e.g., Signature Strengths Survey; McGrath, Citation2019) can minimize or even eliminate the differences found in the present study.
Construct and criterion validity
The multitrait-multimethod analysis revealed that convergent validity (rMdn = .89) between the two character strengths questionnaires is higher than the typical overlap between other personality questionnaires (see, e.g., Pace & Brannick, Citation2010). However, seven character strengths scales showed a lower convergent correlation compared to discriminant correlations. Furthermore, seven character strengths showed a different association with at least one of the well-being measures in terms of criterion validity. These results demonstrate that the two character strengths questionnaires do indeed come from different domains and are not comparable in terms of construct and criterion validity of character strengths.
One of the key findings from the present study is the striking fact that curiosity is one of the character strengths most strongly associated with life satisfaction among adults, but not among adolescents. Our results demonstrate that – for the same people (i.e., with the same trait level of curiosity) – the correlation between curiosity and life satisfaction differs significantly depending on whether one uses the VIA-IS or the VIA-Youth questionnaire. Therefore, we can conclude that comparative interpretations regarding the role of curiosity for life satisfaction in the different age groups are not appropriate based on the two different questionnaires. Of course, the question inevitably arises as how these differences originate. From an explorative perspective, we therefore took a closer look at the items for curiosity in both questionnaires and their correlations with life satisfaction. In the VIA-IS it was interesting that the item "I think my life is extremely interesting" showed a particularly high correlation with life satisfaction (r = .58), while the correlations of the other six items were much lower (rMdn = .19; .04 ≤ r ≤ .28). In the VIA-Youth it is worth noting that the two inverted items ("I don't have many questions about things" and "I am not curious about things") had the lowest correlations with life satisfaction (r = −.03 and .04; re-coded) compared to the other six non-inverted items (rMdn = .20; .05 ≤ r ≤ .26). If one excludes these three items from the curiosity scale score of the VIA-IS and the VIA-Youth, respectively, the correlations between curiosity and life satisfaction are much more similar (.33 vs. .26; compared to .40 vs. .21 based on all items). However, whereas the convergent correlation between the two modified curiosity scale scores remained similarly high (.72; compared to .79 based on all items), there was a significant difference in the means of the scales (dz = 0.29; compared to 0.08 based on all items). The example is intended to illustrate that while it is indeed possible to optimize equivalence for certain criteria by selectively excluding items, unforeseen side effects are likely to occur at the same time. The most serious threat of such a data-driven approach is to content validity, so that in the end abbreviated measurements are created (see, e.g., Ng et al., Citation2017) that have to be critically questioned with regard to an appropriate representation of the constructs.
In summary, what becomes clear in the overview is that there is not a problem with a few specific scales, but that different scales are problematic depending on the research question.
Limitations and implications for future research
The findings presented here need to be interpreted in light of some limitations and specific features of the study. First, the sample was not representative of the population. Thus, the differences between the questionnaires should not be interpreted in terms of absolute values or to determine correction factors (e.g., a mean scale score in the VIA-IS corresponds to a mean scale score in the VIA-Youth) but rather indicate that a comparison of character strengths across the questionnaires (e.g., the most common signature strengths of adults and adolescents) is generally not appropriate. Furthermore, the results of the study should be interpreted as rather conservative and, therefore, an absent effect on a particular scale in our study does not necessarily mean that there is no difference. Although the analysis strategy was chosen to ensure a statistical power of .80 for all analyses, only differences of at least medium effect size could be tested by inferential statistics. Therefore, a replication of the present study should be carried out with a larger sample size (see Kretzschmar & Gignac, Citation2019), so that even smaller differences, which were also descriptively observed in the present study, can be investigated by inferential statistics. Nevertheless, one could also argue that the small effect sizes in the present study have little practical relevance. However, since the comparability of measures for adolescent and adult is important especially in the context of personality development, we follow Roberts et al.’s (Citation2006; see also Funder & Ozer, Citation2019) perspective that even very small effect sizes are relevant. Indeed, interpreting the small effect sizes typically reported in the personality development literature is only valid if the differences are not due to nonequivalent measurement instruments. In addition, further criteria should also be taken into account to evaluate the equivalence of the questionnaires. For example, a more gender-balanced sample than the present one could be used to examine whether the gender differences, which are more pronounced in adults than in adolescents (see Heintz et al., Citation2019), are also due to the different questionnaires used in the respective age groups. Moreover, an increasing body of work is concerned with the hierarchical conceptualization of character strengths and virtues (for an overview, see e.g., Feraco et al., Citation2021). Much larger sample sizes as used in the present study (see, e.g., Hirschfeld et al., Citation2014; Ng et al., Citation2017), different methodological approaches (e.g., Partsch et al., Citation2021), and various cultural contexts (e.g., Duan et al., Citation2012; Khumalo et al., Citation2008) should be considered in future studies to investigate whether, for example, adolescents might have a different structure of character than adults (McGrath & Walker, Citation2016) or whether this is the result of different character strengths measurements.
The second important limitation relates to the measurements used in the study. The VIA-IS (Peterson et al., Citation2005a) was recently revised (VIA-IS-R; McGrath & Wallace, Citation2021) with the aim of correcting some shortcomings of the previous version. It is unclear to what extent the findings presented here also apply to a comparison of the VIA-IS-R and the VIA-Youth. However, if we look at the criteria concerning the development of the VIA-IS-R (e.g., unambiguous and more appropriate wording, factorial validity, number of items; McGrath, Citation2019), it becomes clear that the convergence of the VIA-IS-R and the VIA-Youth was not considered. In fact, the item "I think my life is extremely interesting" that significantly enhanced the correlation between the VIA-IS curiosity scale and life satisfaction is also included in the revised version VIA-IS-R. In addition, a recent study provided evidence for the equivalence for the VIA-IS and the VIA-IS-R (Vylobkova et al., Citation2021). Therefore, it is necessary that future studies also examine the equivalence of the VIA-IS-R and the VIA-Youth before character strengths in adults and adolescent will be compared based on these questionnaires. Ideally, the equivalence of the questionnaires should also be a criterion to be considered in future revisions, especially when the VIA-Youth will be revised.
A specific feature of the present study is the consideration of self-reports and informant-reports. Although most of the studies in positive or personality psychology are based on self-reports, they are prone to several biases due to mono-method variance (e.g., response styles). As demonstrated in this study, findings based on self-reports or combined self- and informant-reports can differ substantially. Whereas the differences in descriptive statistics were relatively comparable, the combined self- and informant-report sample showed fewer violations of construct validity in the multitrait-multimethod analysis. In fact, there were only three scales in the combined sample for which there were issues regarding construct validity. It should be noted that some of these scales were also identified as problematic in previous research (i.e., the leadership scale in particular), so these scales were revised in the new version of the VIA-IS (see McGrath & Wallace, Citation2021). However, there was a tendency for more differences between the questionnaires in terms of the association with well-being in the combined sample. Given the finding that trait variance is increased by aggregation across different raters (Chang et al., Citation2012), it can be assumed that the results of the combined self- and informant-report sample better reflect the potential differences and similarities in character strengths assessment. Future research should further investigate whether aggregation across raters actually provides more valid results when examining the construct validity of personality traits across different age groups and/or measurements.
Conclusion
The VIA-IS and VIA-Youth questionnaires can be considered as reliable and valid in the specific age group indicated for them. However, the present study provides evidence that the differences between the VIA-IS and the VIA-Youth are not small enough to allow a comparison across age groups (i.e., adolescents vs. adults). Therefore, differences in character strengths between adults and adolescents should not be interpreted in terms of differences on the trait level (e.g., different signature strengths, different importance of character strengths regarding well-being) based on these questionnaires. The present study, thus, also emphasizes the need for further developed measurements in positive psychology (e.g., to study the longitudinal development; Gander et al., Citation2019) and research on the equivalence of personality questionnaires, particularly with regard to adolescents and adults.
Supplemental Material
Download Zip (665.5 KB)Data availability statement
The data are not publicly available as the consent form excluded data sharing with third parties based on wording that was common at the time. The data that support the findings of this study are available on request from the corresponding author, AK.
Disclosure statement
WR is a Senior Scientist for the VIA Institute on Character, which holds the copyright to the VIA Inventory of Strengths
Notes
1 Positive youth development focuses on “desirable outcomes such as school achievement, vocational aspirations, community involvement, good interpersonal relations, and the like” (Peterson & Seligman, Citation2004, p. 82) compared to more common youth development programs that focus on “problems such as school dropout, juvenile crime, alcohol and drug use, and unwanted pregnancy” (Peterson & Seligman, Citation2004, p. 81).
2 Please note that a systematic literature review was outside the scope of the present study. The results presented here serve to illustrate the discrepancy often described in the literature regarding the relation between curiosity and life satisfaction. However, the results do not replace a systematic meta-analysis and should be interpreted with caution.
3 In the following we use the term open-mindness, which is sometimes referred to as judgment. Please also note that we use the term modesty in the present study, which is sometimes referred to as humility.
4 Measurement invariance (e.g., Meredith, Citation1993) is commonly used to test the assumption of constant measurement features of one questionnaire (or parallel questionnaires) in different groups (e.g., with respect to age or language). In the present study, however, two different questionnaires (i.e., different number of items, non-corresponding item contents, etc.) are investigated on a single sample with regard to their equivalence. Therefore, the traditional invariance approach (e.g., configural, metric, scalar equivalence) cannot be applied based on different measurements (Tyrell et al., 2019). Alternative approaches to investigate measurement invariance based on different measurements rely on scale scores instead of single items (McGrath & Walker, Citation2016) or item parcels (e.g., Tyrell et al., 2019), which in turn are themselves subject to criticism (e.g., Marsh et al., Citation2013; Meade & Kroustalis, Citation2006). This is especially relevant for the questionnaires used here, as previous research has emphasized challenges with the measurement models of the respective questionnaires (e.g., Ng et al., Citation2017). With this in mind, these alternative approaches to testing measurement invariance based on different questionnaires have not been considered in the present study.
5 Although it is interesting to investigate the informant-report form separately (e.g., Buschor et al., Citation2013), we have decided to use the aggregation approach. In our view, this approach is more suitable for answering our research question (i.e., reducing shared method variance due to aggregation instead of relying on another source of shared method variance; see also Wittmann, Citation1988).
6 Due to a lack of standards for interpreting effect sizes in the context of comparability of measurement instruments, we used Gignac and Szodorai (Citation2016) effect size classification for individual difference research as a guideline. Gignac and Szodorai (Citation2016; see also Funder & Ozer, Citation2019) interpreted r = .11 (equal to d = .22) as a small effect size, which corresponds to a small effect of d = .20 as reported in Cohen (Citation1992).
7 The pattern of findings reported here does not change when a different number of signature strengths (i.e., 3 or 7) was considered. With regard to the tied scale scores, it should be noted that more than 5 signature strengths could be identified per person. For example, if the fifth and sixth highest character strength had the same scale score, then 6 signature strengths were identified for this person.
8 We, furthermore, used the R-packages boot (Version 1.3.23; Davison & Hinkley, Citation1997), dplyr (Version 0.8.5; Wickham et al., Citation2020), ggplot2 (Version 3.2.1; Wickham, Citation2009), lavaan (Version 0.6.5; Rosseel, Citation2012), MBESS (Version 4.6.0; Kelley, Citation2019), mice (Version 3.7.0; Buuren & Groothuis-Oudshoorn, Citation2011), papaja (Version 0.1.0.9942; Aust & Barth, Citation2020), psych (Version 1.9.12.31; Revelle, Citation2019), and TOSTER (Version 0.3.4; Lakens, Citation2017).
9 In detail, we examined whether questionnaires for the same age group (e.g., adults: VIA-IS and SWLS; adolescents: VIA-Youth and SLSS, BMSLSS) show different relations compared to questionnaires for different age groups (e.g., VIA-IS and SLSS, BMSLSS; VIA-Youth and SWLS) based on an equivalence testing approach similar to that used for the main analyses.
References
- Aust, F., Barth, M. (2020). Papaja: Create AAPA manuscripts with R Markdown [Manual]. https://github.com/crsh/papaja
- Blanca, M. J., Ferragut, M., Ortiz-Tallo, M., & Bendayan, R. (2018). Life satisfaction and character strengths in Spanish early adolescents. Journal of Happiness Studies, 19(5), 1247–1260. https://doi.org/10.1007/s10902-017-9865-y
- Blanchard, T., Kerbeykian, T., & McGrath, R. E. (2019). Why are signature strengths and well-being related? Tests of multiple hypotheses. Journal of Happiness Studies, 21(6), 2095–2114. https://doi.org/10.1007/s10902-019-00170-2
- Bruna, M. O., Brabete, A. C., & Izquierdo, J. M. A. (2019). Reliability generalization as a seal of quality of substantive meta-analyses: The case of the VIA Inventory of Strengths (VIA-IS) and their relationships to life satisfaction. Psychological Reports, 122(3), 1167–1188. https://doi.org/10.1177/0033294118779198
- Buschor, C., Proyer, R. T., & Ruch, W. (2013). Self- and peer-rated character strengths: How do they relate to satisfaction with life and orientations to happiness? The Journal of Positive Psychology, 8(2), 116–127. https://doi.org/10.1080/17439760.2012.758305
- Buuren, S. v., & Groothuis-Oudshoorn, K. (2011). mice: Multivariate imputation by chained equations in R. Journal of Statistical Software, 45(3), 1–67. https://doi.org/10.18637/jss.v045.i03
- Campbell, D. T., & Fiske, D. W. (1959). Convergent and discriminant validation by the multitrait multimethod matrix. Psychological Bulletin, 56(2), 81–105. https://doi.org/10.1037/h0046016
- Chang, L., Connelly, B. S., & Geeza, A. A. (2012). Separating method factors and higher order traits of the Big Five: A meta-analytic multitrait-multimethod approach. Journal of Personality and Social Psychology, 102(2), 408–426. https://doi.org/10.1037/a0025559
- Cohen, J. (1992). A power primer. Psychological Bulletin, 112(1), 155–159. https://doi.org/10.1037/0033-2909.112.1.155
- Cohen, P., Cohen, J., Aiken, L. S., & West, S. G. (1999). The problem of units and the circumstance for POMP. Multivariate Behavioral Research, 34(3), 315–346. https://doi.org/10.1207/S15327906MBR3403_2
- Core Team, R. (2019). R: A language and environment for statistical computing. R Foundation for Statistical Computing. https://www.R-project.org/
- Davison, A. C., & Hinkley, D. V. (1997). Bootstrap methods and their application. Cambridge University Press.
- de Groot, A. D. (2014). The meaning of “significance” for different types of research [translated and annotated by Eric-Jan Wagenmakers, Denny Borsboom, Josine Verhagen, Rogier Kievit, Marjan Bakker, Angelique Cramer, Dora Matzke, Don Mellenbergh, and Han L. J. van der Maas]. Acta Psychologica, 148, 188–194. https://doi.org/10.1016/j.actpsy.2014.02.001
- Diener, E., Emmons, R. A., Larsen, R. J., & Griffin, S. (1985). The satisfaction with life scale. Journal of Personality Assessment, 49(1), 71–75. https://doi.org/10.1207/s15327752jpa4901_13
- Duan, W., Ho, S. M. Y., Yu, B., Tang, X., Zhang, Y., Li, T., & Yuen, T. (2012). Factor structure of the chinese virtues questionnaire. Research on Social Work Practice, 22(6), 680–688. https://doi.org/10.1177/1049731512450074
- Feraco, T., Casali, N., & Meneghetti, C. (2021). Do strengths converge into virtues? an item-, virtue-, and scale-level analysis of the italian values in action inventory of strengths-120. Journal of Personality Assessment, 0(0), 1–13. https://doi.org/10.1080/00223891.2021.1934481
- Flake, J. K., Pek, J., & Hehman, E. (2017). Construct validation in social and personality research: Current practice and recommendations. Social Psychological and Personality Science, 8(4), 370–378. https://doi.org/10.1177/1948550617693063
- Funder, D. C., & Ozer, D. J. (2019). Evaluating effect size in psychological research: Sense and nonsense. Advances in Methods and Practices in Psychological Science, 2(2), 156–168. https://doi.org/10.1177/2515245919847202
- Gander, F., Hofmann, J., Proyer, R. T., & Ruch, W. (2019). Character strengths – Stability, change, and relationships with well-being changes. Applied Research in Quality of Life, 15(2), 349–367. https://doi.org/10.1007/s11482-018-9690-4
- Gander, F., Proyer, R. T., Ruch, W., & Wyss, T. (2013). Strength-based positive interventions: Further evidence for their potential in enhancing well-being and alleviating depression. Journal of Happiness Studies, 14(4), 1241–1259. https://doi.org/10.1007/s10902-012-9380-0
- Gignac, G. E., & Kretzschmar, A. (2017). Evaluating dimensional distinctness with correlated-factor models: Limitations and suggestions. Intelligence, 62, 138–147. https://doi.org/10.1016/j.intell.2017.04.001
- Gignac, G. E., & Szodorai, E. T. (2016). Effect size guidelines for individual differences researchers. Personality and Individual Differences, 102, 74–78. https://doi.org/10.1016/j.paid.2016.06.069
- Goh, J. X., Hall, J. A., & Rosenthal, R. (2016). Mini meta-analysis of your own studies: Some arguments on why and a primer on how. Social and Personality Psychology Compass, 10(10), 535–549. https://doi.org/10.1111/spc3.12267
- Heintz, S., Kramm, C., & Ruch, W. (2019). A meta-analysis of gender differences in character strengths and age, nation, and measure as moderators. The Journal of Positive Psychology, 14(1), 103–112. https://doi.org/10.1080/17439760.2017.1414297
- Heintz, S., & Ruch, W. (2021). Cross-sectional age differences in 24 character strengths: Five meta-analyses from early adolescence to late adulthood. The Journal of Positive Psychology. https://doi.org/10.1080/17439760.2021.1871938
- Hirschfeld, G., Brachel, R. v., & Thielsch, M. (2014). Selecting items for Big Five questionnaires: At what sample size do factor loadings stabilize? Journal of Research in Personality, 53, 54–63. https://doi.org/10.1016/j.jrp.2014.08.003
- Huebner, E. S. (1991). Initial development of the student’s life satisfaction scale. School Psychology International, 12(3), 231–240. https://doi.org/10.1177/0143034391123010
- Kelley, K., & Pornprasertmanit, S. (2016). Confidence intervals for population reliability coefficients: Evaluation of methods, recommendations, and software for composite measures. Psychological Methods, 21(1), 69–92. https://doi.org/10.1037/a0040086
- Kelley, K. (2019). MBESS: The MBESS r package. https://CRAN.R-project.org/package=MBESS
- Khumalo, I. P., Wissing, M. P., & Temane, Q. M. (2008). Exploring the validity of the values-in-action inventory of strengths (VIA-IS) in an African context. Journal of Psychology in Africa, 18(1), 133–142. https://doi.org/10.1080/14330237.2008.10820180
- Kretzschmar, A., & Gignac, G. E. (2019). At what sample size do latent variable correlations stabilize? Journal of Research in Personality, 80, 17–22. https://doi.org/10.1016/j.jrp.2019.03.007
- Lakens, D. (2013). Calculating and reporting effect sizes to facilitate cumulative science: A practical primer for t-tests and ANOVAs. Frontiers in Psychology, 4, 863 https://doi.org/10.3389/fpsyg.2013.00863
- Lakens, D. (2017). Equivalence tests: A practical primer for t tests, correlations, and meta-analyses. Social Psychological and Personality Science, 8(4), 355–362. https://doi.org/10.1177/1948550617697177
- Littman-Ovadia, H., Lavy, S., & Boiman-Meshita, M. (2017). When theory and research collide: Examining correlates of signature strengths use at work. Journal of Happiness Studies, 18(2), 527–548. https://doi.org/10.1007/s10902-016-9739-8
- Marsh, H. W., Lüdtke, O., Nagengast, B., Morin, A. J. S., & Von Davier, M. (2013). Why item parcels are (almost) never appropriate: Two wrongs do not make a right-camouflaging misspecification with item parcels in CFA models. Psychological Methods, 18(3), 257–284. https://doi.org/10.1037/a0032773
- McCrae, R. R. (1982). Consensual validation of personality traits: Evidence from self-reports and ratings. Journal of Personality and Social Psychology, 43(2), 293–303. https://doi.org/10.1037/0022-3514.43.2.293
- McGrath, R. E. (2016). Measurement invariance in translations of the VIA inventory of strengths. European Journal of Psychological Assessment, 32(3), 187–194. https://doi.org/10.1027/1015-5759/a000248
- McGrath, R. E. (2019). Technical report: The VIA Assessment Suite for Adults: Development and initial evaluation. VIA Institute on Character.
- McGrath, R. E., & Walker, D. I. (2016). Factor structure of character strengths in youth: Consistency across ages and measures. Journal of Moral Education, 45(4), 400–418. https://doi.org/10.1080/03057240.2016.1213709
- McGrath, R. E., & Wallace, N. (2021 Jan-Feb). Cross-validation of the VIA inventory of strengths-revised and its short forms. Journal of Personality Assessment, 103(1), 120–131. https://doi.org/10.1080/00223891.2019.1705465
- Meade, A. W., & Kroustalis, C. M. (2006). Problems with item parceling for confirmatory factor analytic tests of measurement invariance. Organizational Research Methods, 9(3), 369–403. https://doi.org/10.1177/1094428105283384
- Meredith, W. (1993). Measurement invariance, factor analysis and factorial invariance. Psychometrika, 58(4), 525–543. https://doi.org/10.1007/BF02294825
- Ng, V., Cao, M., Marsh, H. W., Tay, L., & Seligman, M. E. P. (2017). The factor structure of the Values in Action Inventory of Strengths (VIA-IS): An item-level exploratory structural equation modeling (ESEM) bifactor analysis. Psychological Assessment, 29(8), 1053–1058. https://doi.org/10.1037/pas0000396
- Pace, V. L., & Brannick, M. T. (2010). How similar are personality scales of the “same” construct? A meta-analytic investigation. Personality and Individual Differences, 49(7), 669–676. https://doi.org/10.1016/j.paid.2010.06.014
- Padilla, M. A., & Veprinsky, A. (2012). Correlation attenuation due to measurement error: A new approach using the bootstrap procedure. Educational and Psychological Measurement, 72(5), 827–846. https://doi.org/10.1177/0013164412443963
- Park, N., & Peterson, C. (2006). Moral competence and character strengths among adolescents: The development and validation of the values in action inventory of strengths for youth. Journal of Adolescence, 29(6), 891–909. https://doi.org/10.1016/j.adolescence.2006.04.011
- Park, N., Peterson, C., & Seligman, M. E. P. (2004). Strengths of character and well-being. Journal of Social and Clinical Psychology, 23(5), 603–619. https://doi.org/10.1521/jscp.23.5.603.50748
- Partsch, M. V., Bluemke, M., & Lechner, C. M. (2021). Revisiting the hierarchical structure of the 24 VIA character strengths: Three global dimensions may suffice to capture their essence. European Journal of Personality. https://doi.org/10.1177/08902070211017760
- Pavot, W., & Diener, E. (2009). Review of the satisfaction with life scale. In E. Diener (Ed.), Assessing well-being: The collected works of Ed Diener (pp. 101–117). Springer. https://doi.org/10.1007/978-90-481-2354-4_5
- Peterson, C., & Park, N. (2009). Classifying and measuring strengths of character. In C. R. Snyder & S. J. Lopez (Eds.), Oxford handbook of positive psychology (2nd ed., pp. 25–33). Oxford University Press.
- Peterson, C., Park, N., & Seligman, M. E. P. (2005b). Orientations to happiness and life satisfaction: The full life versus the empty life. Journal of Happiness Studies, 6(1), 25–41. https://doi.org/10.1007/s10902-004-1278-z
- Peterson, C., Park, N., & Seligman, M. E., (2005a). Assessment of character strengths. In G. P. Koocher, J. C. Norcross, & S. S. Hill, III (Eds.), Psychologists’ desk reference (2nd ed., Vol. 3, pp. 93–98). Oxford University Press.
- Peterson, C., & Seligman, M. E. P. (2004). Character strengths and virtues: A handbook and classification. American Psychological Association; Oxford University Press.
- Proyer, R. T., Gander, F., Wellenzohn, S., & Ruch, W. (2013). What good are character strengths beyond subjective well-being? The contribution of the good character on self-reported health-oriented behavior, physical fitness, and the subjective health status. The Journal of Positive Psychology, 8(3), 222–232. https://doi.org/10.1080/17439760.2013.777767
- Revelle, W. (2019). psych: Procedures for Psychological, Psychometric, and Personality Research. https://CRAN.R-project.org/package=psych
- Roberts, B. W., Walton, K. E., & Viechtbauer, W. (2006). Patterns of mean-level change in personality traits across the life course: A meta-analysis of longitudinal studies. Psychological Bulletin, 132(1), 1–25. https://doi.org/10.1037/0033-2909.132.1.1
- Rosseel, Y. (2012). lavaan: An R package for structural equation modeling. Journal of Statistical Software, 48(2), 1–36. https://doi.org/10.18637/jss.v048.i02
- Ruch, W., Harzer, C., Proyer, R. T., Park, N., & Peterson, C. (2010). Ways to happiness in German-speaking countries. European Journal of Psychological Assessment, 26(3), 227–234. https://doi.org/10.1027/1015-5759/a000030
- Ruch, W., Proyer, R. T., Harzer, C., Park, N., Peterson, C., & Seligman, M. E. P. (2010). Values in Action Inventory of Strengths (VIA-IS): Adaptation and validation of the German version and the development of a peer-rating form. Journal of Individual Differences, 31(3), 138–149. https://doi.org/10.1027/1614-0001/a000022
- Ruch, W., & Stahlmann, A. (2020). 15 years after Peterson and Seligman (2004). A brief narrative review of the research on the 12 criteria for character strengths – The forgotten treasure of the VIA classification. In M. Brohm-Badry, C. Peifer, J. M. Greve, & B. Berend (Eds.), Zusammen wachsen –Förderung der positiv-psychologischen Entwicklung von Individuen, Organisationen und Gesellschaft (pp. 142–172). Pabst Science Publishers.
- Ruch, W., Weber, M., Park, N., & Peterson, C. (2014). Character strengths in children and adolescents: Reliability and initial validity of the german values in action inventory of strengths for youth (German VIA-Youth). European Journal of Psychological Assessment, 30(1), 57–64. https://doi.org/10.1027/1015-5759/a000169
- Seligson, J. L., Huebner, E. S., & Valois, R. F. (2003). Preliminary validation of the brief multidimensional students’ life satisfaction scale (BMSLSS). Social Indicators Research, 61(2), 121–145. https://doi.org/10.1023/A:1021326822957
- Spearman, C. (1904). The proof and measurement of association between two things. The American Journal of Psychology, 15(1), 72. https://doi.org/10.2307/1412159
- Tyrell, F. A., Yates, T. M., Widaman, K. F., Reynolds, C. A., & Fabricius, W. V. (2019). Data harmonization: Establishing measurement invariance across different assessments of the same construct across adolescence. Journal of Clinical Child and Adolescent Psychology: The Official Journal for the Society of Clinical Child and Adolescent Psychology, American Psychological Association, Division 53, 48(4), 555–567. https://doi.org/10.1080/15374416.2019.1622124
- Vylobkova, V., Heintz, S., Gander, F., Wagner, L., & Ruch, W. (2021). Convergence and psychometric properties of character strengths measures: The VIA-IS and the VIA-IS-R. Journal of Personality Assessment. https://doi.org/10.31234/osf.io/8zvjb
- Wagner, L., Gander, F., Proyer, R. T., & Ruch, W. (2019). Character Strengths and PERMA: Investigating the relationships of character strengths with a multidimensional framework of well-being. Applied Research in Quality of Life, 15(2), 307–328. https://doi.org/10.1007/s11482-018-9695-z
- Wagner, L., Holenstein, M., Wepf, H., & Ruch, W. (2020). Character strengths are related to students' achievement, flow experiences, and enjoyment in teacher-centered learning, individual, and group work beyond cognitive ability. Frontiers in Psychology, 11, 1324. https://doi.org/10.3389/fpsyg.2020.01324
- Weber, M., Ruch, W., & Huebner, E. S. (2013). Adaptation and initial validation of the German version of the students’ life satisfaction scale (German SLSS). European Journal of Psychological Assessment, 29(2), 105–112. https://doi.org/10.1027/1015-5759/a000133
- Wickham, H. (2009). ggplot2: Elegant graphics for data analysis. Springer-Verlag. http://ggplot2.org
- Wickham, H., François, R., Henry, L., Müller, K. (2020). dplyr: A grammar of data manipulation [Manual]. https://CRAN.R-project.org/package=dplyr
- Wilcox, R. R. (2016). Comparing dependent robust correlations. British Journal of Mathematical and Statistical Psychology, 69(3), 215–224. https://doi.org/10.1111/bmsp.12069
- Wittmann, W. W. (1988). Multivariate reliability theory: Principles of symmetry and successful validation strategies. In J. R. Nesselroade & R. B. Cattell (Eds.), Handbook of multivariate experimental psychology (2nd ed., pp. 505–560). Plenum Press.
- Ziegler, M. (2014). Stop and state your intentions!: Let’s not forget the ABC of test construction. European Journal of Psychological Assessment, 30(4), 239–242. https://doi.org/10.1027/1015-5759/a000228