
 ?Mathematical formulae have been encoded as MathML and are displayed in this HTML version using MathJax in order to improve their display. Uncheck the box to turn MathJax off. This feature requires Javascript. Click on a formula to zoom.
Abstract
The Self-Compassion Scale (SCS) is one of the several tools for measuring compassionate self-attitude. Despite its popularity, there is an ongoing controversy regarding its factor structure. Previous studies employing exploratory structural equation modeling (ESEM) found support for the single-bifactor (one general and six group factors) model over the competing two-bifactor (two general factors representing compassionate and uncompassionate self-responding and six group factors) model. Here, we replicated and extended previous ESEM studies through examining the validity and dimensionality of different bifactor models in a sample of UK adults. Model fit was examined across two estimators: maximum likelihood and weighted least square mean and variance adjusted. Finally, we investigated whether one or two observed scores of the SCS can better identify cases of depression, anxiety, and mental wellbeing. Both bifactor models showed good fit to the data irrespective of the estimators used, but only the single-bifactor model demonstrated satisfactory convergent and criterion validity and unidimensionality. The total observed SCS score detected depression, anxiety and high mental wellbeing with higher accuracy than any of the two scores. Overall, we propose to use the total score of the SCS in further research and practice.
There are several instruments to measure the tendency to be compassionate toward oneself in difficult times (Gilbert et al., Citation2017; Gu et al., Citation2020; Kraus & Sears, Citation2009), but the Self-Compassion Scale (SCS) has become the most widely used (Neff et al., Citation2019). The 26-item SCS consists of six subscales assessing opposites of each of the three components of self-compassion: Self-kindness versus Self-judgment, Common Humanity versus Isolation, and Mindfulness versus Over-identification. According to Neff (Neff et al., Citation2019), the various components of self-compassion represent the ways how individuals emotionally react to the negative experience (i.e., with tenderness toward themselves or with a harsh judgment), cognitively understand their negative experience (i.e., with accepting that failure is the common human experience or the perception that their suffering is unique and isolates them from the rest of the world), and pay attention to their negative self-related feelings (i.e., with mindful awareness or overidentification and rumination). Self-compassion as measured by the SCS has consistently demonstrated strong and negative associations with depression, anxiety, and stress (MacBeth & Gumley, Citation2012) as well as significant positive associations with psychological wellbeing (Zessin et al., Citation2015), resilience (Lefebvre et al., Citation2020), and happiness and optimism (Neff et al., Citation2007). These results indicate the relevance of self-compassion for clinical practice, therefore the psychometric properties of SCS have increasingly become a matter of interest for researchers and clinicians.
Overall, the SCS has shown good psychometric properties (Neff, Citation2003b; Veneziani et al., Citation2017), but the scale’s factor structure is a subject of ongoing debate. Based on the confirmatory factor analyses (CFA), Neff initially adopted a six-factor model and a hierarchical (higher-order) model (Neff, Citation2003b), but later rejected the latter on the ground of poor empirical support and statistical limitations (Neff, Citation2016; Neff et al., Citation2017). The single-bifactor model of the SCS (i.e., one general factor and six uncorrelated group factors that simultaneously influence the items) was proposed instead, which showed an acceptable fit in several studies (Cleare et al., Citation2018; Kotsou & Leys, Citation2016; Neff et al., Citation2017). However, some authors using CFA found that the two-bifactor model (i.e., having two distinct general factors) fit the data better than the single general-factor model of self-compassion. These researchers recommend using two separate scores representing compassionate (i.e., self-kindness, common humanity and mindfulness) and uncompassionate (i.e., self-judgment, isolation and overidentification) self-responding instead of one total score in research and clinical practice (Brenner et al., Citation2017; Halamová et al., Citation2021). Muris and Petrocchi (Citation2017) made the same recommendation based on the findings that uncompassionate self-responding (US) showed stronger associations with psychopathology than compassionate self-responding (CS).
Neff (Citation2022) argues that because self-compassion is conceptualized as a bipolar continuum ranging from US to CS, a total score better captures the full range of variance than two separate US and CS scores. Experimental data support the model of US and CS forming a continuum because as CS increases US decreases (Ferrari et al., Citation2019; Neff et al., Citation2021; Wilson et al., Citation2019). The fact that US and CS are differential predictors of outcomes (Muris & Petrocchi, Citation2017) has little bearing on whether they form a continuum, as it is common for variance at different ends of a bipolar continuum to evidence differential strengths of association with particular outcomes (Neff, Citation2022).
Recent studies that have combined bifactor analyses with exploratory structural equation modeling (ESEM) rather than CFA have supported the use of a total SCS score (Neff et al., Citation2019; Tóth-Király et al., Citation2017; Tóth-Király & Neff, Citation2021). This advanced statistical technique combines the best features of EFA (exploratory factor analysis) and CFA (Marsh et al., Citation2014) and was found to be more suitable for testing multidimensional constructs such as self-compassion. The ESEM allows cross-loadings (i.e., it allows all observed indicators to load on all latent variables) which is similar to EFA and, at the same time, allows confirmatory model testing and goodness-of-fit assessment in the manner of CFA. Thus, ESEM provides a less biased representation of data compared to CFA (Marsh et al., Citation2014). For these reasons, ESEM was applied in a study of 20 international samples (N = 11,685), in which Neff et al. (Citation2019) discovered a good fit for the six-factor, single-bifactor and two-bifactor models of the SCS. However, two general factors were weakly defined by their standardized loadings unlike the single general factor, thus the single-bifactor model was supported over the two-bifactor model. In addition, the general factor explained 95% of the reliable variance (omega hierarchical divided by omega) in the single-bifactor model, while only 5% was attributed to the group factors (subscales). Thus, the bifactor-ESEM studies to date have provided reasonably strong support for the use of the total SCS score.
There are, however, a few unresolved issues. First, it is advisable to select a model not just on the basis of a good model fit, but also on the basis of theoretical considerations and its utility for predicting “conceptually relevant external criteria” (Sellbom & Tellegen, Citation2019). Even though previous studies (Neff, Long, et al., Citation2018; Neff, Tóth-Király, et al., Citation2018) examined the associations of both the total score and two scores of the SCS with the relevant external criteria (e.g. depression, anxiety, rumination, emotional wellbeing), they used observed scores or latent factor scores that did not fully account for measurement error. Thus, there is a need for a study that would test a model’s validity within the ESEM framework.
Second, there is a lack of information in previous ESEM studies about whether the SCS is essentially unidimensional to allow the use of its total score. Unidimensionality of SCS was supported in one study that used Item Response Theory (IRT) approach – Rasch model (Finaulahi et al., Citation2021), however, undimensionality can also be easily tested within the classical test theory approach to which ESEM belongs (Asparouhov & Muthén, Citation2009; Reise, Scheines, et al., Citation2013). Moreover, according to Reise et al. (Citation2011), before proceeding to the use of unidimensional IRT models it is preferable to determine unidimensionality within bifactor ESEM first using special indices. If a construct’s unidimensionality is under question, it is recommended to report values of (a) the explained common variance (ECV), (b) percent of uncontaminated correlations (PUC), and (c) the omega hierarchical () coefficient for bifactor models (Reise, Scheines, et al., Citation2013). The omega hierarchical coefficient indicates the amount of total score variance explained by the single factor, but does not directly indicate the degree of unidimensionality; thus, it can be high even when the data are certainly multidimensional (Reise, Scheines, et al., Citation2013). The ECV is the percent of common variance explained by the general factor and directly indicates the degree of unidimensionality in the data (Reise, Scheines, et al., Citation2013). The ECV allows determining the relative strength of the general factor with high values reflecting a strong general factor (Rodriguez et al., Citation2016b). Finally, the PUC is another index used in conjunction with ECV to decide whether multidimensional data are “unidimensional enough” (Rodriguez et al., Citation2016b). To the best of our knowledge, none of the ESEM studies examining the structure of the SCS has reported coefficients other than the omega hierarchical (see Neff et al., Citation2019; Tóth-Király et al., Citation2017). Therefore, to determine whether the general factor is strong enough not only omega hierarchical should be calculated, but also ECV and PUC.
Another unresolved issue is the lack of clarity in the choice of estimation methods for determining model fit. Maximum likelihood (ML) estimation, which usually applies to continuous data with normal distribution versus the weighted least square mean and variance adjusted (WLSMV) estimation, which is preferable for ordinal data. The items of the SCS are answered on a five-point scale, ranging from 1 “Almost Never” to 5 “Almost Always”, and as such can be treated either as continuous or ordinal thus both estimation methods can be used (Shi & Maydeu-Olivares, Citation2020). Previous CFA studies have used different estimations when assessing the structure of the SCS: some used ML or robust maximum likelihood (MLR) (Halamová et al., Citation2021; Neff et al., Citation2017), and some used WLSMV (Coroiu et al., Citation2018). In studies using the ESEM to explore the SCS structure, only the WLSMV has been applied (Neff et al., Citation2019; Tóth-Király et al., Citation2017). Some fit indices such as the root-mean-square error of approximation (RMSEA), the comparative fit index (CFI) and the Tucker–Lewis index (TLI) can change substantially depending on the estimation method used (Beauducel & Herzberg, Citation2006; Shi & Maydeu-Olivares, Citation2020). For example, the WLSMV-based CFI values tend to show a better fit than those obtained using ML when models are misspecified (Shi & Maydeu-Olivares, Citation2020). Thus, it is possible that conventional cutoffs for popular fit indices originally developed on the basis of ML are less suitable in the case of WLSMV (Shi & Maydeu-Olivares, Citation2020). There is a need for a study which would test models with both estimators simultaneously to see whether there will be a large discrepancy between values of fit indices obtained using different estimators. In case of a large discrepancy, the ML would provide a less biased fit (Shi & Maydeu-Olivares, Citation2020).
The aims of the present study
The first aim of the study was to determine the degree of dimensionality of bifactor models of the SCS. The ECV and PUC indices were calculated for that aim in addition to an index of reliability (omega hierarchical). We started with replicating Neff et al.’s (Citation2019) study in a UK adult sample, before determining whether CFA and ESEM models fit differently when ML or WLSMV estimation was employed.
The second aim of this study was to establish the convergent and criterion validity of the SCS bifactor models within the ESEM framework (Neff et al., Citation2019). The convergent validity of the SCS bifactor models was tested by investigating their associations with measures of brooding (self-critical rumination) and maladaptive perfectionism. The criterion validity of the SCS bifactor models was evaluated via associations of general factors in bifactor models with measures of anxiety, depression and mental wellbeing. Based on the results from previous studies (MacBeth & Gumley, Citation2012; Neff, Long, et al., Citation2018; Zessin et al., Citation2015), we expected general latent factors in all bifactor models to be negatively associated with anxiety, depression, brooding, and maladaptive perfectionism and positively associated with mental wellbeing. Also, we predicted that the general factor in the single-bifactor model would be more strongly associated with external variables, than general factors the in two-bifactor model. This prediction was based on the theoretical conceptualization of self-compassion as a holistic construct (Neff, Long, et al., Citation2018) and the finding that each of the two scores was almost equally contributing to the positive mental health outcomes (Neff, Long, et al., Citation2018; Neff, Tóth-Király, et al., Citation2018). To complement the validity test, we also used Receiver Operating Characteristics (ROC) analyses to address the ability of the observed total score and two different scores to detect cases of anxiety, depression and high mental wellbeing.
In sum, our study contributes to the existing literature by providing information about validity and dimensionality of the SCS bifactor models that would allow researchers and clinicians to make an informed decision about using the total SCS score or two separate scores.
Method
Participants
Our initial sample consisted of 500 individuals recruited via the University of Warwick's research participation system, an online research panel of older adults and advertisements on social media. Participants were invited to take part in the study if they were 18 years old or older and English-speaking. One individual was excluded from further analyses for having more than 30% of missing responses (the threshold for excluding missing data was ≥10% as per recommendations of Hair (Citation2014)). Thirteen multivariate outliers in more than 3 SDs were found and excluded from the analysis. The final sample for data analysis consisted of 486 participants (196 men; 287 women; 2 gender-nonconforming people; 1 missing; M age = 39.1 years; SD = 19.2; range 18 to 85 years). The majority of the sample reported their ethnicity as White, with a university degree, being employed/studying and being single. More detailed demographic information is provided in Table S1 in supplementary materials. Participants received £5 eGift Vouchers after completing the study.
Table 1. Fit indices for the confirmatory factor analysis (CFA) and exploratory structural equation modeling (ESEM) factor models of the Self-Compassion Scale.
Procedure
All participants provided informed consent before the study. Ethical approval was granted by the Humanities and Social Sciences Research Ethics Committee, University of Warwick, UK (approval number PGR_18-19/18). Participants completed an online survey using a link leading to the Qualtrics platform (www.qualtrics.com). The online survey contained the measures in the following order, which was the same for all participants: demographic information, Self-Compassion Scale, Ruminative Response Scale (Brooding subscale), Patient-Reported Outcomes Measurement Information System (PROMIS) Emotional Distress-Anxiety Short Form and the PROMIS Emotional Distress-Depression Short Form, Short Form of the Revised Almost Perfect Scale and Short Warwick-Edinburgh Mental Well-being Scale. The study was not pre-registered.
Measures
Demographic information
Participants provided information on age, gender, ethnicity, highest educational qualification (primary education, secondary education, bachelor’s degree, master’s degree, doctoral degree, none of the above, other), employment (employed/self-employed, unemployed, studying, on leave/unable to work, retired/medically retired, other), and marital status (married/in civil partnership/living as married, single/divorced/separated/widowed, other).
Self-compassion
The 26-item Self-Compassion Scale (SCS; Neff, Citation2003b) was used to measure six sub-components of self-compassion: Self-kindness (SK; e.g., “I’m kind to myself when I’m experiencing suffering”), Self-judgment (SJ; e.g., “When I see aspects of myself that I don’t like, I get down on myself”), Common Humanity (CH; e.g., “When things are going badly for me, I see the difficulties as part of life that everyone goes through”), Isolation (IS; e.g., “When I fail at something that's important to me, I tend to feel alone in my failure”), Mindfulness (MI; e.g., “When I'm feeling down I try to approach my feelings with curiosity and openness”), and Over-identification (OI; e.g., “When something painful happens I tend to blow the incident out of proportion”). Responses were given on a five-point scale from 1 “Almost Never” to 5 “Almost Always”. Items of SJ, IS, and OI subscales are reverse coded before computing a mean score of these subscales. The total SCS score is obtained by computing a mean score of six subscales and ranges from 1 to 5, with higher scores indicating higher levels of self-compassion. The total SCS score has demonstrated good three-week test-retest reliability as well as good convergent validity and discriminant validity in previous research (Neff, Citation2003b; Veneziani et al., Citation2017). In this study, the internal consistency reliability scores (Cronbach's αs) of the SCS total score and subscales were SCS=.92, SK=.79, SJ=.82, CH=.73, IS=.78, MI=.78, OI=.78, respectively.
Brooding
Brooding (self-critical rumination) was measured using the 5-item Brooding subscale of Ruminative Responses Scale (RRS; Treynor et al., Citation2003). Example of item is “Think “Why can’t I handle things better?”. Each item is rated on a 4-point scale (1 “almost never” and 4 “almost always”). The total score ranges from 5 to 20, with higher scores representing a higher tendency of brooding. The Brooding subscale showed good convergent and discriminant validity (Schoofs et al., Citation2010). In this study, Cronbach's α for the Brooding scale was .78.
Depression and anxiety
Anxiety and depression were assessed with the Patient-Reported Outcomes Measurement Information System (PROMIS) Emotional Distress-Anxiety Short Form and the PROMIS Emotional Distress-Depression Short Form (Cella et al., Citation2019). Respondents were asked to assess their feelings/symptoms over the past week (e.g., “My worries overwhelmed me” on the anxiety scale and “I felt hopeless” on the depression scale). Each form consists of four items scored between 1 “Never” to 5 “Always”. The total raw score ranges from 8 to 20 and converts to T-scores (range 40.3-81.6 for anxiety and 41.0-79.4 for depression), with higher scores representing higher levels of anxiety and depression, respectively. The cutoff for identifying cases with depression is 56.0; people with scores ≤55.0 most likely respond “never” or “rarely” to questions about the presence of depression and anxiety symptoms (Rothrock et al., Citation2020). Both PROMIS scales have demonstrated good construct validity (Cella et al., Citation2019). In this study, Cronbach's α for the Anxiety and Depression subscales were .93 and .95, respectively.
Maladaptive perfectionism
Maladaptive perfectionism was measured with the 4-item Discrepancy subscale of the 8-item the Short Form of the Revised Almost Perfect Scale (SAPS; Rice et al., Citation2014). An example of item is “I am hardly ever satisfied with my performance”. Discrepancy subscale measures concerns about the disparity between personal standards and one’s evaluation of performance. Responses are given on a 7-point scale from 1 “Strongly disagree” to 7 “Strongly agree”. The total score ranges from low perfectionism (4) to high perfectionism (28). The SAPS has shown to have high convergent validity, discriminant validity, and criterion-related validity (Rice et al., Citation2014). In this study, Cronbach’s α for the Discrepancy subscale was .86.
Mental wellbeing
The 7-item short Warwick-Edinburgh Mental Wellbeing Scale (sWEMWBS; Stewart-Brown et al., Citation2009) was designed to assess mental wellbeing. Example items include “I’ve been feeling optimistic about the future” and “I’ve been dealing with problems well”. Participants were asked to respond on a 5-point scale ranging from 1 “None of the time” to 5 “All of the time” to describe their experience over the previous two weeks. Total score ranges from 7 to 35, with higher scores representing higher levels of mental wellbeing. The cutoff for identifying people with high and medium mental wellbeing is a score of ≥ 21 on the short Warwick-Edinburgh Mental Wellbeing Scale (Ng Fat et al., Citation2017; Shah et al., Citation2021). The scale has been shown to have good criterion and relative validity (Ng Fat et al., Citation2017). In this study Cronbach’s α for sWEMWBS=.87.
Data analyses
We performed CFA and ESEM with both ML and WLSMV estimation using Mplus 8.5 (Muthén & Muthén, Citation2017). Replicating the Neff et al. (Citation2019) study, we used syntax from the supplementary materials of the Neff’s paper (syntax used in the current study to examine the models specified below can be found on osf.io/2t6ar/) to examine the following models:
a one-factor (self-compassion) model,
a two-factor correlated model (i.e., two factors representing compassionate self-responding and uncompassionate self-responding),
a six-factor correlated model (i.e., six components of self-compassion),
a single-bifactor model (i.e., items load simultaneously on six group factors and one general self-compassion factor) and
a two-bifactor correlated model (items load concurrently on six group factors and two factors representing compassionate self-responding and uncompassionate self-responding).
Prior to analyses the items of SJ, IS and OI subscales were reverse-coded to ensure that higher scores of all SCS subscales indicate higher levels of self-compassion. As in Neff et al.’s (Citation2019) study, no cross-loadings were allowed between general factors in the two-bifactor ESEM, whereas cross-loadings between specific factors related to the certain general factor were permitted. In the two-bifactor model correlations between two general factors were allowed as it reflects the theoretical conceptualization of self-compassion as a holistic system ().
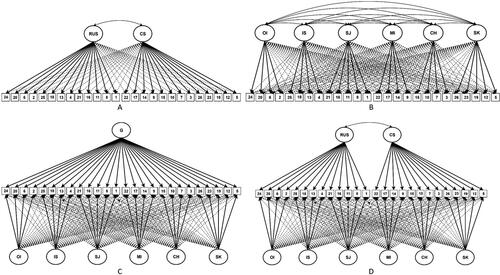
Figure 1. Schematic representation of ESEM models.
Note. Schematic representation of ESEM models: a two-factor (A), a six-factor (B), a single-bifactor (C), a two-bifactor correlated (D). Ovals are latent variables, rectangles are individual SCS items, full arrows denote target factor loadings, dashed arrows represent cross-loadings. The full arrows are thicker than dashed for better visual clarity. G = global factor; SK = self-kindness; SJ = self-judgment; CH = common humanity; IS = isolation; MI = mindfulness; OI = overidentification; CS = compassionate self-responding general factor; RUS = reduced uncompassionate self-responding general factor. Model 1 – one factor model was not represented.
The model’s fit and parameter estimates were evaluated based on the ESEM only, fit indices and parameter estimates for CFA models were presented for information. The following cutoffs for fit indices were applied: the root-mean-square error of approximation (RMSEA) value of .05 or below, the Tucker–Lewis index (TLI) and the comparative fit index (CFI) of .95 or above indicate a close fit (Hu & Bentler, Citation1999; Keith, Citation2015). Both an RMSEA and a standardized root-mean-square residual (SRMR) of .08 or below, CFI and TLI of .90 or above are considered as an indicator of an acceptable model fit (Keith, Citation2015). The Chi-square test statistic is presented in the for information, but was not used in the selection of model, because of its high sensitivity to sample size variations (Keith, Citation2015). Fit indices for the one-factor model were provided only for CFA because of an absence of item cross-loadings in this model.
Table 3. Standardized factor loadings for the single-bifactor CFA and ESEM of the Self-Compassion Scale (SCS).
Decisions about certain model were based not only on the fit indices, but also on the assessment of parameter estimates and relevant theory (Morin et al., Citation2016). The most preferable model was the one in which general factor and specific factors were well-defined with strong factor loadings and in which specific factors were accompanied by reduced cross-loadings. For loadings and cross-loadings to be considered meaningful, we used criteria of ≥.32 proposed by Worthington and Whittaker (Citation2006) and to be viewed strong, we used criteria of ≥.50 (Hair, Citation2014). Thus, we consider a factor as well-defined if its mean target loading (i.e., mean of all loadings in the specific factor) equals or exceeds .50. Strong cross-loadings unexpected by the theory we interpreted as an indication that items are attributed to the wrong factor, especially if they are higher than the target loadings (Morin et al., Citation2020), and/or as an indication of the presence of an unmodeled G-factor (Morin et al., Citation2020; Sánchez-Oliva et al., Citation2017) that could be tested with the bifactor models.
In accordance with the arguments outlined in the introduction, when assessing fit indices, greater emphasis was placed on models with ML estimation. The WLSMV estimation was used further for examining parameter estimates, because ML can lead to a slight underestimation of parameters (Beauducel & Herzberg, Citation2006; Finney & DiStefano, Citation2013). In other words, if models with ML estimation showed acceptable fit, we choose WLSMV estimation of these models for an examination of standardized loadings, reliability, dimensionality and validity.
To estimate reliability we employed the formulas provided by Rodriguez et al. (Citation2016b) to compute the omega coefficients of composite reliability (ω and ). The omega coefficient (ω) indicates the proportion of variance that can be attributed to the general factor plus the specific factors. The omega hierarchical coefficient (
) estimates the proportion of variance that can only be attributed to the general factor. The degree of reliable variance in total scores attributed to the general factor was obtained by dividing
on ω. The degree of reliable variance attributable to the specific factors was obtained by subtracting
from ω. As in Neff et al.’s study (Citation2019), we used similar criteria to Reise et al (Citation2013): values equal to or above .75 in the omega hierarchical indicate the preferable amount of variance.
To assess the degree of unidimensionality in the data and to determine the strength of general factor compared to group factors, we calculated the ECV and PUC for general factor/factors (Rodriguez et al., Citation2016b). According to Rodriguez et al. (Citation2016a), values of ECV > .70 and PUC > .70 indicates that the common variance is basically unidimensional. However, when PUC is high (i.e., > .70), the ECV value becomes less important, even if it is as low as .50. High degree of unidimensionality is not expected given the theoretical conceptualization of self-compassion as a multifaceted construct (Neff, Citation2020), so the goal is to determine whether the SCS is unidimensional enough to justify using the total score. We also computed ECV for individual items (IECV) to assess the proportion of common variance attributable to a general factor.
In the final stage, we investigated convergent validity by computing correlations between latent variables of brooding and maladaptive perfectionism, as well as self-compassion factor/factors based on the ESEM models (WLSMV) that showed the acceptable fit to the data (ML). Latent variables of brooding and maladaptive perfectionism were specified as CFA models (WLSMV) because there are no cross-loadings in these models. To investigate the criterion validity, the self-compassion general and group factors were regressed onto the depression, anxiety, and mental wellbeing latent variables. Before validity analyses, the McDonald’s omega coefficients of reliability (for unidimensional data) for all validity measures were calculated (A. F. Hayes & Coutts, Citation2020; McDonald, Citation1999) with expected values of >.80 (Nájera Catalán, Citation2019).
The performance of the SCS, positive self-compassion subscale (CS – compassionate self-responding) and negative self-compassion subscale (RUS – reduced compassionate self-responding) to screen cases of depression, anxiety and high mental wellbeing was analyzed by calculating Receiver Operating Characteristics (ROC) curves and areas under the ROC curve (AUC). We compared SCS, CS and RUS observed scores to the cutoffs on the PROMIS Emotional Distress-Anxiety and Depression – Short Form short Warwick-Edinburgh Mental Wellbeing Scale. We calculated CS observed scores by mean of SK, CH, and MI subscales. RUS observed scores were computed by mean of reversed subscales - SJ, IS, and OI. ROC curve analysis was conducted using IBM SPSS version 27.
Results
Model fit, parameter estimates, reliability, and dimensionality
Tables S2 and S4 in supplementary materials provide descriptive statistics of measures as well as correlations between measures and correlations between latent factors. presents fit indices for all models using ML and WSLMV estimators.
The one-factor model showed poor fit using both ML and WLSMV estimators. The two-factor model also demonstrated a poor fit with both estimators.
The six-factor model showed an acceptable fit both in the case of ML estimator and WLSMV estimator. As for parameter estimates (), each specific factor except CH in six-factor ESEM had one target loading that was not meaningful (<.32; Worthington & Whittaker, Citation2006). Most of the non-target cross-loadings in six-factor ESEM were negligible (|λ|=.00-.63, M=.12), but 8 were meaningful (≥.32; Worthington & Whittaker, Citation2006) and two items were close to meaningful (λ=.31). In particular, two OI items (items #2 and #6) had the noticeably highest cross-loadings on the SJ factor. Seven cross-loadings, for example, item #2, were of greater size than their respective target loadings.
Table 2. Standardized factor loadings for the six-factor structure correlated CFA and ESEM of the Self-Compassion Scale (SCS).
The single-bifactor model showed a good fit using both estimators. A further examination of the ESEM single-bifactor model revealed a strong general factor and weak group factors. First, all target loadings of the general factor were meaningful () and mostly strong (λ=.33-.79, M=.58), unlike less defined specific factors: SK (λ=.10-.57, M=.42), CH (λ=.29-.74, M=.47), IS (λ=.13-.67, M=.43), MI (λ=.05-.57, M=.37) and OI (|λ|=.06-.57, M=.33). SJ exhibited almost no specificity (λ=.13-.48, M=.27). Each group factor had at least one non-meaningful target loading (i.e., <.32), for example, SK item #23 (λ=.10). Compared to the six-factor model, the single-bifactor model had substantially reduced cross-loadings (only one meaningful cross-loading (≥.32) – item #22 (MI), and two items that were close to the meaningful (λ=.30-.31)). There were 8 items with cross-loadings greater in size than target loadings for specific factor (e.g., CH item #15).
Value of was high (.90) meaning the largest proportion of total score variance was attributed to the general factor. Regarding reliable variance, the single-bifactor model displayed that 93% of the reliable variance in item composite was attributed to the general self-compassion factor (GF in ), while 6% was attributed to the specific factors (SF in ). The strength of the general self-compassion factor was also supported by the PUC and ECV values (): the value of PUC was high (.86), thus the ECV value of .66 can be regarded as acceptable despite that it was below .70 (Rodriguez et al., Citation2016a). In other words, the single-bifactor model showed a sufficient degree of unidimensionality. As to IECV values, in the single-bifactor model, there were 10 items (#1, #2, #4, #6, #11, #15, #16, #21, #22, and #23), with a value higher than .80 indicating that these items are predominantly influenced by the general factor. Interestingly, the SJ factor had four out of five items with high IECV, while other group factors had only one or two such items.
Table 4. Reliability and dimensionality indices for the bifactor ESEM models.
The two-bifactor model also demonstrated a good fit regardless of the estimator used. Examination of parameter estimates () revealed the following pattern: weakly defined general RUS factor (|λ|=.04-.69, M=.24) and even more weakly defined general CS factor (|λ|=.03-.37, M=.17). All target loadings of the general CS factor were not meaningful except for items #7 and #10 (both CH). All target loadings of the general RUS factor were not meaningful except for two items, #13 and #18 (IS). At the same time, the specific factors were more strongly defined than the general factors: SK (λ=.38-.70, M=.59), SJ (λ=.54-.74, M=.61), CH (λ=.49-.60, M=.56), IS (λ=.11-.47, M=.34), MI (λ=.10-.66, M=.44) and OI (λ=.31-.68, M=.52). Group factors’ target loadings were mostly meaningful except for item #22 (MI), #6 (OI), and #4 (IS). There were twenty-three meaningful and six near-meaningful (λ=.30-31) cross-loadings across all items and factors. The two general factors were weakly correlated at r=.28, p=.001. The reliability estimates and dimensionality indices also revealed the weak general factors.
Table 5. Standardized factor loadings for the two-bifactor CFA and ESEM of the Self-Compassion Scale (SCS).
The largest proportion of variance can be attributed to the specific factors, as the low values of (.00) for compassionate self-responding and
(.31) for reduced uncompassionate self-responding indicated. Regarding reliable variance, the two-bifactor model displayed that 0% of the reliable variance in item composite was attributed to the general compassionate self-responding factor and 36% to the general reduced uncompassionate self-responding factor, while variance attributed to the specific factors was 76% and 54% respectively. The PUC values were acceptable for both general factors (both equals .72), but ECV values were far below .50 indicating that each of the general factors explained less than half of the common variance. As for the IECV values, in the two-bifactor model, there was only one item with a high IECV value (item #4) above .80.
Validity analyses
Three ESEM models showed an acceptable fit to the data in ML and WLSMV estimators: the six-factor model, the single-bifactor model and the two-bifactor model. These models were chosen for validity analyses. The reliability of almost all validity measures was acceptable as indicated by values of McDonald’s omega reliability—maladaptive perfectionism (.86), anxiety (.94), depression (.95), and mental well-being (.87)—with brooding’s value close to acceptable (.79).
Convergent validity
In the six-factor model (), group factors correlated with selected convergent measures in the expected negative directions, except mindfulness, which showed a non-significant association with maladaptive perfectionism.
Table 6. Latent variables correlations between convergent validity measures and the self-compassion general and group factors in the ESEM six-factor, single-bifactor and two-bifactor models.
In the single-bifactor model, the general factor was negatively and strongly (>.50, (Cohen, Citation1988)) correlated with brooding and maladaptive perfectionism. All group factors, except reduced IS and SJ showed unexpected positive directions of associations or non-significant associations with the selected convergent measures. For example, SK was positively correlated with brooding and maladaptive perfectionism; whereas OI showed no association with brooding and maladaptive perfectionism.
In the two-bifactor model, the CS factor was negatively and weakly correlated with brooding, and negatively and moderately correlated with maladaptive perfectionism. The RUS factor correlated neither with brooding nor maladaptive perfectionism. Group factors did not correlate with convergent measures, except reduced SJ, CH, and IS, which showed negative associations with measures. It can be seen that the general self-compassion factor in the single-bifactor model showed the strongest and expected negative correlations with the selected convergent measures.
Criterion validity
The criterion validity analysis () was conducted for bifactor models only. The six-factor model resulted in an improper solution suggesting that the model did not fit the data: the latent variable covariance matrix was not positive definite, so interpretation of the results was not possible. In the single-bifactor model, the general self-compassion factor was strongly associated with all outcome measures over and above group factors: negatively with anxiety and depression, and positively with mental wellbeing. All group factors with statistically significant associations with external measures were in the unexpected direction with outcome variables: positive with anxiety and depression and negative with mental wellbeing. The only exceptions were the negative associations of SK with anxiety and depression, and the positive association of reduced IS with mental wellbeing. In the two-bifactor model, the CS factor was weakly associated with all outcome measures over and above the RUS and group factors: negatively with anxiety and depression, and positively with mental wellbeing. The RUS factor was weakly associated with measures in the expected directions: negatively with depression, and positively with mental wellbeing. However, RUS was not associated with anxiety at all. All group factors with statistically significant associations were in the expected direction with outcome variables: negative with anxiety and depression and positive with the mental wellbeing.
Table 7. Latent variables regressions between criterion validity measures and the self-compassion general and group factors in the ESEM single-bifactor and two-bifactor models.
ROC curve analysis
An analysis of the AUC, specificity, sensitivity, positive predicted value (PPV) and negative predicted value (NPV) are shown in . The highest AUC (70-71), specificity (69-71%), PPV (67-85%) and NPV (52-73%) was found for the SCS total score for all three outcomes (depression, anxiety and mental wellbeing). The cutoffs for SCS total score for depression, anxiety and mental wellbeing were ≤ 2.87, ≤ 2.89 and ≥ 2.74 respectively. The sensitivity level was about the same (70%) for all three scores. RUS score was closer to SCS in performance than CS and were better in detecting all three outcomes than CS.
Table 8. Results of ROC curve analysis of depression, anxiety, mental wellbeing and self-compassion.
Discussion
Consistent with some previous studies that have used the ESEM to examine the structure of the SCS (Neff et al., 2019; Tóth-Király et al., Citation2017), our analyses showed that the six-factor, single-bifactor and two-bifactor models indicated a good fit to the data. When analyzing different parameter estimates and reliability estimates, our results mostly supported the single-bifactor model. This study independently replicated the findings of Neff et al. (Citation2019) and Tóth-Király et al. (Citation2017) thereby increasing the confidence in the results obtained in previous studies. We extended the Neff and colleagues’ (Citation2019) study by showing that the single-bifactor ESEM model had a good fit irrespective of the estimator used: maximum likelihood (ML) or weighted least square mean and variance adjusted (WLSMV) estimator.
Our study also contributes to the literature by providing support for the convergent and criterion validity of the single-bifactor ESEM model through examining associations of the latent factors with the relevant external outcomes. We found that the general self-compassion factor had statistically significant and strong negative associations with anxiety, depression, brooding, and maladaptive perfectionism, and strong positive associations with mental wellbeing. While previous studies obtained similar results employing the observed (Neff, Long, et al., Citation2018) and factor scores (Neff, Tóth-Király, et al., Citation2018) of the SCS, our study used latent factors, which more accurately represent constructs by accounting for the measurement errors (Rdz-Navarro, Citation2019).
In our study, we also answered the question not raised in the previously published ESEM studies: to what extent the data is unidimensional to warrant the use of total SCS score? The results showed that the item variance had a sufficient degree of unidimensionality as indicated by the high ECV and PUC values to support the use of the total SCS score when operationalized as a single-factor bifactor model. The support of the SCS unidimensionality is consistent with the study of Finaulahi et al. (Citation2021) that employed the Rasch methodology. At the same time, as expected, we did not observe a very high degree of unidimensionality of the SCS which would contradict the theoretical conceptualization of self-compassion as a multidimensional system (Neff, Citation2020).
While data in the present study supported the use of a total score of the SCS, it did not provide support for the use of two separate scores—CS and RUS. This result is consistent with previous ESEM studies (Neff et al., Citation2019; Tóth-Király et al., Citation2017; Tóth-Király & Neff, Citation2021). Fit indices for the two-bifactor ESEM model demonstrated a good fit using both estimation techniques, however, when examining the standardized factor loadings, it was evident that the CS and RUS factors were very weakly and the six specific factors quite strongly defined. In addition, multiple cross-loadings were suggesting the presence of an unmodeled common factor (Morin et al., Citation2020; Sánchez-Oliva et al., Citation2017). Thus, the two-bifactor model had very poor parameter estimates. In contrast, the general factor in the single-bifactor ESEM model was strong with high factor loadings, while the specific factors had relatively low loadings. Moreover, there were fewer meaningful cross-loadings in the single-bifactor model, which is again in favor of the strength of the general factor. Unlike the general factor in the single-bifactor model, the general factors in the two-bifactor models explained substantially less variance than group factors and neither of them was essentially unidimensional. These might explain why both CS and RUS factors demonstrated weak or no associations with external criteria (anxiety, depression, mental wellbeing, brooding and maladaptive perfectionism). Group factors in turn demonstrated stronger associations with outcomes than general factors in the expected direction. In the case of the single-bifactor model, the general factor accounted for the majority of variance hence it showed stronger expected associations with outcomes than group factors. The finding that the general self-compassion factor had better convergent and criterion validity than CS and RUS factors is consistent with Neff’s (Citation2022) view that a total SCS score represents an entire bipolar continuum and therefore, has more explanatory power than two separate scores.
Additionally, our study revealed that using two total scores – positive and negative – worsens the ability of the scale to discriminate between individuals with and without anxiety, depression or poor mental wellbeing. If we use two separate scores instead of the single score of the SCS, the specificity level decreases from 69-71% to 58-69%, PPV and NPV decrease from 67-85% to 59-84% and from 52%-73% to 45%-71% respectively. Only sensitivity maintains the same level of 70-71%.
Altogether, these results suggest that using two scores (i.e., defined as CS and RUS) could lead to less accurate findings, thus it is preferable to use one total SCS score instead. This is particularly important to consider when the SCS is being used in trials and clinical settings.
Additional findings
Ten items with high IECV in the single-bifactor model (items #1, #2, #4, #6, #11, #15, #16, #21, #22, #23) suggest the possible reduction of the scale if one wishes to form a more unidimensional measure of self-compassion. The scale was already reduced in the past from 26 to 12 items which formed the Self-Compassion Scale Short Form (SCS-SF; Raes et al., Citation2011). Considering the low internal consistencies of the SCS-SF subscales, it was recommended to use the total score rather than six subscale scores. However, while some authors found further support for the total score (Castilho et al., Citation2015; Raes et al., Citation2011), others proffered the use of two scores representing positive and negative self-compassion components (Babenko & Guo, Citation2019; Bratt & Fagerström, Citation2020; Hayes et al., Citation2016; Kotera & Sheffield, Citation2020). Thus, the factor structure of the SCS-SF is hardly conclusive. It should be noted that the short form was not examined using ESEM. Nevertheless, revising the short form based on the items with high IECV, i.e., with a high percentage of common variance attributed to the general factor, could potentially improve the form in terms of unidimensionality. The existing 12-item form contains five items with high IECV discovered in our study. The remaining seven items (items #2, #3, #4, #6, #7, #8, and #10) in SCS-SF were the items that were less related to the general factor in the single-bifactor model in our study. Future research may focus on the development of the SCS-SF with the inclusion of a larger number of items with high IECV obtained in the various and larger samples.
It is interesting to note that in terms of content, the majority of the items with loadings higher than .80 (i.e., with high IECV) were more relevant in measuring an attitude toward oneself than items with lower loadings. High IECV items were more about an attitude toward one’s shortcomings and failures, for example, item #1 “I’m disapproving and judgmental about my own flaws and inadequacies” (SJ) or item #15 “I try to see my failings as part of the human condition” (CH). On the contrary, half of the low IECV items, especially those with loadings lower than .50, asked participants about their responses to negative feelings and situations in general, not necessarily how they feel about themselves. For example, item #9 “When something upsets me, I try to keep my emotions in balance” (MI) or item #13 “When I’m feeling down, I tend to feel like most other people are probably happier than I am” (IS). The last two example items do not necessarily imply that individuals are upset about themselves, it can be interpreted as feeling down because of other people or a situation in general. These items probably reflect Neff’s theoretical formulation of self-compassion as an attitude in times of both personal failures and general suffering (Neff, Citation2003a), but if one wants to further increase the unidimensionality of the scale, reformulating such items in a more self-related manner may be necessary.
Interestingly, SJ was the only specific factor that mostly consisted of the high IECV items (4 out of 5), whilst other factors had only one such item, except OI, which had two such items. Furthermore, in the single-bifactor model SJ was the only group factor that retained the least amount of specificity. One possible explanation of these findings could be that the presence/absence of self-judgment or self-criticism underlies all factors and is the largest part of the self-compassion construct. Consistently, research shows that self-compassion and self-criticism are strongly related, r = −.65 (Neff, Citation2003b). However, we note that other studies have found evidence that self-compassion cannot be interpreted as a mere lack of self-judgment. For example, Neff (Citation2003b) found that the total SCS score is negatively associated with anxiety and depression after controlling for self-criticism, which suggests that self-compassion is more than an absence of self-judgment. The findings from the study of Mantzios et al. (Citation2020) echo the same message. In the study, the authors found that a self-compassion intervention (targeting only positive components of the SCS) was equally effective in increasing self-compassion as an intervention that aimed to reduce self-criticism (targeting only negative components of the SCS). If self-judgment was the core of self-compassion, the intervention that did not address self-criticism would not increase self-compassion as effectively as the intervention that addressed self-criticism. Furthermore, only a self-compassion but not a self-criticism intervention was found effective in lowering people’s levels of self-judgement (Mantzios et al., Citation2020). Thus, an alternative and probably more plausible, explanation for the prominence of the SJ subscale in the present study is that the content of the SJ subscale is more related to personal failures and flaws than the content of other subscales which are more related to general suffering. This may be particularly relevant to people from countries with high levels of individualism and masculinity values such as the United Kingdom and the United States (Montero-Marin et al., Citation2018) where people are relatively more focused on personal autonomy, achievements, and success. Although the influence of individualism and masculinity on the salience of negative items of the SCS was not statistically significant in the study of Montero-Marin et al. (Citation2018), moderate effects were found.
Limitations and conclusion
The study has certain limitations. The first limitation is the generalizability of findings: the sample was mostly comprised of participants of White ethnicity, who were employed or studying at a university in the UK. This limits the generalizability of our results to a wider population or different cultural settings. However, it should be noted that in a recent large-scale study conducted in 15 different countries in which the SCS was operationalized as a single-bifactor ESEM, it showed equivalence across a wide range of groups in terms of age, gender, language, student or community status (Tóth-Király & Neff, Citation2021). Second, the ESEM is a relatively new statistical technique and recommendations regarding the application of indices of reliability and dimensionality and related cutoffs primarily concern bifactor CFA models, but recommendations are lacking when it comes to bifactor ESEM models (Morin et al., Citation2020).
In sum, the results of the present study provide additional support for the use of the total score of the SCS, but not for the use of two separate scores representing compassionate and uncompassionate self-responding. General factor in the single-bifactor model was a stronger predictor of anxiety, depression and mental wellbeing than any of the general factors in the two-bifactor model. The same result was obtained regarding the associations with brooding and maladaptive perfectionism. The total SCS score identifies the cases of depression and anxiety better than any of the two separate scores. Overall, the SCS is a reliable and valid instrument that can be used to measure self-compassion, although further research in terms of revision of items is probably needed if one wants to develop a more unidimensional measure.
Declaration of interest statement
The authors declare they have no conflicts of interest
Supplemental Material
Download MS Word (45.6 KB)Acknowledgments
We are thankful to our participants and Professor Elizabeth A. Maylor, University of Warwick, the United Kingdom for permission to access the older adult research panel.
Data availability
The datasets generated during and/or analyzed during the current study are available from the corresponding author on reasonable request.
Additional information
Funding
References
- Asparouhov, T., & Muthén, B. (2009). Exploratory structural equation modeling. Structural Equation Modeling: A Multidisciplinary Journal, 16(3), 397–438. https://doi.org/10.1080/10705510903008204
- Babenko, O., & Guo, Q. (2019). Measuring self-compassion in medical students: Factorial validation of the Self-Compassion Scale–Short Form (SCS-SF). Academic Psychiatry: The Journal of the American Association of Directors of Psychiatric Residency Training and the Association for Academic Psychiatry, 43(6), 590–594. https://doi.org/10.1007/s40596-019-01095-x
- Beauducel, A., & Herzberg, P. (2006). On the performance of maximum likelihood versus means and variance adjusted weighted least squares estimation in CFA. Structural Equation Modeling: A Multidisciplinary Journal, 13(2), 186–203. https://doi.org/10.1207/s15328007sem1302_2
- Bratt, A., & Fagerström, C. (2020). Self-compassion in old age: Confirmatory factor analysis of the 6-factor model and the internal consistency of the Self-Compassion Scale-Short Form. Aging & Mental Health, 24(4), 642–648. https://doi.org/10.1080/13607863.2019.1569588
- Brenner, R. E., Heath, P. J., Vogel, D. L., & Credé, M. (2017). Two is more valid than one: Examining the factor structure of the Self-Compassion Scale (SCS). Journal of counseling psychology, 64(6), 696–707. https://doi.org/10.1037/cou0000211
- Castilho, P., Pinto-Gouveia, J., & Duarte, J. (2015). Evaluating the multifactor structure of the long and short versions of the Self-Compassion Scale in a clinical sample: Factor analysis of the long and short Self-Compassion Scale. Journal of Clinical Psychology, 71(9), 856–870. https://doi.org/10.1002/jclp.22187
- Cella, D., Choi, S. W., Condon, D. M., Schalet, B., Hays, R. D., Rothrock, N. E., Yount, S., Cook, K. F., Gershon, R. C., Amtmann, D., DeWalt, D. A., Pilkonis, P. A., Stone, A. A., Weinfurt, K., & Reeve, B. B. (2019). PROMIS adult health profiles: Efficient short-form measures of seven health domains. Value in health: The Journal of the International Society for Pharmacoeconomics and Outcomes Research, 22(5), 537–544. https://doi.org/10.1016/j.jval.2019.02.004
- Cleare, S., Gumley, A., Cleare, C. J., & O'Connor, R. C. (2018). An investigation of the factor structure of the Self-Compassion Scale. Mindfulness, 9(2), 618–628. https://doi.org/10.1007/s12671-017-0803-1
- Cohen, J. (1988). Statistical power analysis for the behavioral sciences (2nd ed.). L. Erlbaum Associates.
- Coroiu, A., Kwakkenbos, L., Moran, C., Thombs, B., Albani, C., Bourkas, S., Zenger, M., Brahler, E., & Körner, A. (2018). Structural validation of the Self-Compassion Scale with a German general population sample. PLoS One, 13(2), e0190771. https://doi.org/10.1371/journal.pone.0190771
- Ferrari, M., Hunt, C., Harrysunker, A., Abbott, M. J., Beath, A. P., & Einstein, D. A. (2019). Self-compassion interventions and psychosocial outcomes: A meta-analysis of RCTs. Mindfulness, 10(8), 1455–1473. https://doi.org/10.1007/s12671-019-01134-6
- Finaulahi, K. P., Sumich, A., Heym, N., & Medvedev, O. N. (2021). Investigating psychometric properties of the Self-Compassion Scale using Rasch methodology. Mindfulness, 12(3), 730–740. https://doi.org/10.1007/s12671-020-01539-8
- Finney, S. J., & DiStefano, C. (2013). Nonnormal and categorical data in structural equation modeling. In Structural equation modeling: A second course (2nd ed., pp. 439–492). IAP Information Age Publishing.
- Gilbert, P., Catarino, F., Duarte, C., Matos, M., Kolts, R., Stubbs, J., Ceresatto, L., Duarte, J., Pinto-Gouveia, J., & Basran, J. (2017). The development of compassionate engagement and action scales for self and others. Journal of Compassionate Health Care, 4(1), 4. https://doi.org/10.1186/s40639-017-0033-3
- Gu, J., Baer, R., Cavanagh, K., Kuyken, W., & Strauss, C. (2020). Development and psychometric properties of the Sussex-Oxford Compassion Scales (SOCS). Assessment, 27(1), 3–20. https://doi.org/10.1177/1073191119860911
- Hair, J. F. (Ed.). (2014). Multivariate data analysis (7th ed.). Pearson.
- Halamová, J., Kanovský, M., Petrocchi, N., Moreira, H., López, A., Barnett, M. D., Yang, E., Benda, J., Brähler, E., Zeng, X., & Zenger, M. (2021). Factor structure of the Self-Compassion Scale in 11 international samples. Measurement and Evaluation in Counseling and Development, 54(1), 1–23. https://doi.org/10.1080/07481756.2020.1735203
- Hayes, A. F., Coutts, J. J. (2020). Use Omega rather than Cronbach’s Alpha for estimating reliability. But…. Communication Methods and Measures, 14(1), 1–24. https://doi.org/10.1080/19312458.2020.1718629
- Hayes, J. A., Lockard, A. J., Janis, R. A., & Locke, B. D. (2016). Construct validity of the Self-Compassion Scale-Short Form among psychotherapy clients. Counselling Psychology Quarterly, 29(4), 405–422. https://doi.org/10.1080/09515070.2016.1138397
- Hu, L., & Bentler, P. M. (1999). Cutoff criteria for fit indexes in covariance structure analysis: Conventional criteria versus new alternatives. Structural Equation Modeling: A Multidisciplinary Journal, 6(1), 1–55. https://doi.org/10.1080/10705519909540118
- Keith, T. Z. (2015). Multiple regression and beyond: An introduction to multiple regression and structural equation modeling (2nd ed.). Routledge/Taylor & Francis Group. https://doi.org/10.4324/9781315749099
- Kotera, Y., & Sheffield, D. (2020). Revisiting the Self-compassion Scale-Short Form: Stronger associations with self-inadequacy and resilience. SN Comprehensive Clinical Medicine, 2(6), 761–769. https://doi.org/10.1007/s42399-020-00309-w
- Kotsou, I., & Leys, C. (2016). Self-Compassion Scale (SCS): Psychometric properties of the French translation and its relations with psychological well-being, affect and depression. PLOS One, 11(4), e0152880. https://doi.org/10.1371/journal.pone.0152880
- Kraus, S., & Sears, S. (2009). Measuring the immeasurables: Development and initial validation of the Self-Other Four Immeasurables (SOFI) Scale based on Buddhist teachings on loving kindness, compassion, joy, and equanimity. Social Indicators Research, 92(1), 169–181. https://doi.org/10.1007/s11205-008-9300-1
- Lefebvre, J.-I., Montani, F., & Courcy, F. (2020). Self-compassion and resilience at work: A practice-oriented review. Advances in Developing Human Resources, 22(4), 437–452. https://doi.org/10.1177/1523422320949145
- MacBeth, A., & Gumley, A. (2012). Exploring compassion: A meta-analysis of the association between self-compassion and psychopathology. Clinical Psychology Review, 32(6), 545–552. https://doi.org/10.1016/j.cpr.2012.06.003
- Mantzios, M., Koneva, A., & Egan, H. (2020). When ‘negativity’ becomes obstructive: A novel exploration of the two-factor model of the Self-Compassion Scale and a comparison of self-compassion and self-criticism interventions. Current Issues in Personality Psychology, 8(4), 289–300. https://doi.org/10.5114/cipp.2020.100791
- Marsh, H. W., Morin, A. J. S., Parker, P. D., & Kaur, G. (2014). Exploratory structural equation modeling: An integration of the best features of exploratory and confirmatory factor analysis. Annual Review of Clinical Psychology, 10(1), 85–110. https://doi.org/10.1146/annurev-clinpsy-032813-153700
- McDonald, R. P. (1999). Test theory: A unified treatment. Psychology Press. https://doi.org/10.4324/9781410601087
- Montero-Marin, J., Kuyken, W., Crane, C., Gu, J., Baer, R., Al-Awamleh, A. A., Akutsu, S., Araya-Véliz, C., Ghorbani, N., Chen, Z. J., Kim, M.-S., Mantzios, M., Rolim dos Santos, D. N., Serramo López, L. C., Teleb, A. A., Watson, P. J., Yamaguchi, A., Yang, E., & García-Campayo, J. (2018). Self-compassion and cultural values: A cross-cultural study of self-compassion using a Multitrait-Multimethod (MTMM) analytical procedure. Frontiers in Psychology, 9, 2638. https://doi.org/10.3389/fpsyg.2018.02638
- Morin, A. J. S., Arens, A. K., & Marsh, H. W. (2016). A bifactor exploratory structural equation modeling framework for the identification of distinct sources of construct-relevant psychometric multidimensionality. Structural Equation Modeling: A Multidisciplinary Journal, 23(1), 116–139. https://doi.org/10.1080/10705511.2014.961800
- Morin, A. J. S., Myers, N. D., & Lee, S. (2020). Modern factor analytic techniques: Bifactor models, exploratory structural equation modeling (ESEM), and Bifactor‐ESEM. In G. Tenenbaum & R. C. Eklund (Eds.), Handbook of sport psychology (1st ed., pp. 1044–1073). Wiley. https://doi.org/10.1002/9781119568124.ch51
- Muris, P., & Petrocchi, N. (2017). Protection or vulnerability? A meta-analysis of the relations between the positive and negative components of self-compassion and psychopathology. Clinical Psychology & Psychotherapy, 24(2), 373–383. https://doi.org/10.1002/cpp.2005
- Muthén, L. K., & Muthén, B. O. (2017). Mplus user’s guide (8th ed.). Muthén & Muthén.
- Nájera Catalán, H. E. (2019). Reliability, population classification and weighting in multidimensional poverty measurement: A Monte Carlo study. Social Indicators Research, 142(3), 887–910. https://doi.org/10.1007/s11205-018-1950-z
- Neff, K. D. (2003a). Self-compassion: An alternative conceptualization of a healthy attitude toward oneself. Self and Identity, 2(2), 85–101. https://doi.org/10.1080/15298860309032
- Neff, K. D. (2003b). The development and validation of a scale to measure self-compassion. Self and Identity, 2(3), 223–250. https://doi.org/10.1080/15298860309027
- Neff, K. D. (2016). The Self-Compassion Scale is a valid and theoretically coherent measure of self-compassion. Mindfulness, 7(1), 264–274. https://doi.org/10.1007/s12671-015-0479-3
- Neff, K. D. (2020). Commentary on Muris and Otgaar (2020): Let the empirical evidence speak on the Self-Compassion Scale. Mindfulness, 11(8), 1900–1909. https://doi.org/10.1007/s12671-020-01411-9
- Neff, K. D. (2022). The differential effects fallacy in the study of self-compassion: Misunderstanding the nature of bipolar continuums. Mindfulness, 13(3), 572–576. https://doi.org/10.1007/s12671-022-01832-8
- Neff, K. D., Long, P., Knox, M. C., Davidson, O., Kuchar, A., Costigan, A., Williamson, Z., Rohleder, N., Tóth-Király, I., & Breines, J. G. (2018). The forest and the trees: Examining the association of self-compassion and its positive and negative components with psychological functioning. Self and Identity, 17(6), 627–645. https://doi.org/10.1080/15298868.2018.1436587
- Neff, K. D., Rude, S. S., & Kirkpatrick, K. L. (2007). An examination of self-compassion in relation to positive psychological functioning and personality traits. Journal of Research in Personality, 41(4), 908–916. https://doi.org/10.1016/j.jrp.2006.08.002
- Neff, K. D., Tóth-Király, I., & Colosimo, K. (2018). Self-compassion is best measured as a global construct and is overlapping with but distinct from neuroticism: A response to Pfattheicher, Geiger, Hartung, Weiss, and Schindler (2017). European Journal of Personality, 32(4), 371–392. https://doi.org/10.1002/per.2148
- Neff, K. D., Tóth-Király, I., Knox, M. C., Kuchar, A., & Davidson, O. (2021). The development and validation of the State Self-Compassion Scale (long- and short form). Mindfulness, 12(1), 121–140. https://doi.org/10.1007/s12671-020-01505-4
- Neff, K. D., Tóth-Király, I., Yarnell, L. M., Arimitsu, K., Castilho, P., Ghorbani, N., Guo, H. X., Hirsch, J. K., Hupfeld, J., Hutz, C. S., Kotsou, I., Lee, W. K., Montero-Marin, J., Sirois, F. M., de Souza, L. K., Svendsen, J. L., Wilkinson, R. B., & Mantzios, M. (2019). Examining the factor structure of the Self-Compassion Scale in 20 diverse samples: Support for use of a total score and six subscale scores. Psychological Assessment, 31(1), 27–45. https://doi.org/10.1037/pas0000629
- Neff, K. D., Whittaker, T. A., & Karl, A. (2017). Examining the factor structure of the Self-Compassion Scale in four distinct populations: Is the use of a total scale score justified? Journal of Personality Assessment, 99(6), 596–607. https://doi.org/10.1080/00223891.2016.1269334
- Ng Fat, L., Scholes, S., Boniface, S., Mindell, J., & Stewart-Brown, S. (2017). Evaluating and establishing national norms for mental wellbeing using the short Warwick–Edinburgh Mental Well-being Scale (SWEMWBS): Findings from the Health Survey for England. Quality of Life Research, 26(5), 1129–1144. https://doi.org/10.1007/s11136-016-1454-8
- Raes, F., Pommier, E., Neff, K. D., & Van Gucht, D. (2011). Construction and factorial validation of a short form of the Self-Compassion Scale. Clinical Psychology & Psychotherapy, 18(3), 250–255. https://doi.org/10.1002/cpp.702
- Rdz-Navarro, K. (2019). Latent variables should remain as such: Evidence from a Monte Carlo study. The Journal of general psychology, 146(4), 417–442. https://doi.org/10.1080/00221309.2019.1596064
- Reise, S. P., Bonifay, W. E., & Haviland, M. G. (2013). Scoring and modeling psychological measures in the presence of multidimensionality. Journal of Personality Assessment, 95(2), 129–140. https://doi.org/10.1080/00223891.2012.725437
- Reise, S. P., Scheines, R., Widaman, K. F., & Haviland, M. G. (2013). Multidimensionality and structural coefficient bias in structural equation modeling: A bifactor perspective. Educational and Psychological Measurement, 73(1), 5–26. https://doi.org/10.1177/0013164412449831
- Reise, S. P., Ventura, J., Keefe, R. S. E., Baade, L. E., Gold, J. M., Green, M. F., Kern, R. S., Mesholam-Gately, R., Nuechterlein, K. H., Seidman, L. J., & Bilder, R. (2011). Bifactor and item response theory analyses of interviewer report scales of cognitive impairment in schizophrenia. Psychological Assessment, 23(1), 245–261. https://doi.org/10.1037/a0021501
- Rice, K. G., Richardson, C. M. E., & Tueller, S. (2014). The short form of the Revised Almost Perfect Scale. Journal of Personality Assessment, 96(3), 368–379. https://doi.org/10.1080/00223891.2013.838172
- Rodriguez, A., Reise, S. P., & Haviland, M. G. (2016a). Applying bifactor statistical indices in the evaluation of psychological measures. Journal of personality assessment, 98(3), 223–237. https://doi.org/10.1080/00223891.2015.1089249
- Rodriguez, A., Reise, S. P., & Haviland, M. G. (2016b). Evaluating bifactor models: Calculating and interpreting statistical indices. Psychological Methods, 21(2), 137–150. https://doi.org/10.1037/met0000045
- Rothrock, N. E., Amtmann, D., & Cook, K. F. (2020). Development and validation of an interpretive guide for PROMIS scores. Journal of Patient-Reported Outcomes, 4(1), 16. https://doi.org/10.1186/s41687-020-0181-7
- Sánchez-Oliva, D., Morin, A. J. S., Teixeira, P. J., Carraça, E. V., Palmeira, A. L., & Silva, M. N. (2017). A bifactor exploratory structural equation modeling representation of the structure of the Basic Psychological Needs at Work Scale. Journal of Vocational Behavior, 98, 173–187. https://doi.org/10.1016/j.jvb.2016.12.001
- Schoofs, H., Hermans, D., & Raes, F. (2010). Brooding and reflection as subtypes of rumination: Evidence from confirmatory factor analysis in nonclinical samples using the Dutch Ruminative Response Scale. Journal of Psychopathology and Behavioral Assessment, 32(4), 609–617. https://doi.org/10.1007/s10862-010-9182-9
- Sellbom, M., & Tellegen, A. (2019). Factor analysis in psychological assessment research: Common pitfalls and recommendations. Psychological Assessment, 31(12), 1428–1441. https://doi.org/10.1037/pas0000623
- Shah, N., Cader, M., Andrews, B., McCabe, R., & Stewart-Brown, S. L. (2021). Short Warwick-Edinburgh Mental Well-being Scale (SWEMWBS): Performance in a clinical sample in relation to PHQ-9 and GAD-7. Health and Quality of Life Outcomes, 19(1), 1–9. https://doi.org/10.1186/s12955-021-01882-x
- Shi, D., & Maydeu-Olivares, A. (2020). The effect of estimation methods on SEM fit indices. Educational and Psychological Measurement, 80(3), 421–445. https://doi.org/10.1177/0013164419885164
- Stewart-Brown, S., Tennant, A., Tennant, R., Platt, S., Parkinson, J., & Weich, S. (2009). Internal construct validity of the Warwick-Edinburgh Mental Well-being Scale (WEMWBS): A Rasch analysis using data from the Scottish Health Education Population Survey. Health and Quality of Life Outcomes, 7, 15. https://doi.org/10.1186/1477-7525-7-15
- Tóth-Király, I., Bőthe, B., & Orosz, G. (2017). Exploratory structural equation modeling analysis of the Self-Compassion Scale. Mindfulness, 8(4), 881–892. https://doi.org/10.1007/s12671-016-0662-1
- Tóth-Király, I., & Neff, K. D. (2021). Is self-compassion universal? Support for the measurement invariance of the Self-Compassion Scale across populations. Assessment, 28(1), 169–185. https://doi.org/10.1177/1073191120926232
- Treynor, W., Gonzalez, R., & Nolen-Hoeksema, S. (2003). Rumination reconsidered: A psychometric analysis. Cognitive Therapy and Research, 27(3), 247–259. https://doi.org/10.1023/A:1023910315561
- Veneziani, C. A., Fuochi, G., & Voci, A. (2017). Self-compassion as a healthy attitude toward the self: Factorial and construct validity in an Italian sample. Personality and Individual Differences, 119, 60–68. https://doi.org/10.1016/j.paid.2017.06.028
- Wilson, A. C., Mackintosh, K., Power, K., & Chan, S. W. Y. (2019). Effectiveness of self-compassion related therapies: A systematic review and meta-analysis. Mindfulness, 10(6), 979–995. https://doi.org/10.1007/s12671-018-1037-6
- Worthington, R. L., & Whittaker, T. A. (2006). Scale development research: A content analysis and recommendations for best practices. The Counseling Psychologist, 34(6), 806–838. https://doi.org/10.1177/0011000006288127
- Zessin, U., Dickhäuser, O., & Garbade, S. (2015). The relationship between self-compassion and well-being: A meta-analysis. Applied Psychology. Health and Well-Being, 7(3), 340–364. https://doi.org/10.1111/aphw.12051