

 ?Mathematical formulae have been encoded as MathML and are displayed in this HTML version using MathJax in order to improve their display. Uncheck the box to turn MathJax off. This feature requires Javascript. Click on a formula to zoom.
Abstract
The Values in Action (VIA) framework encompasses 24 universally valued character strengths. Recent factor-analytic work has identified three global core strengths (metatraits) that proved to be well-interpretable and cross-culturally replicable: positivity, dependability, and mastery. However, there are no short scales to economically measure these core strengths that would encourage (large-scale) survey-based research on the global level of the VIA trait space. In the present study, we selected 18 items to measure the three metatraits from the 96-item IPIP-VIA-R inventory. To optimize the item selection while considering multiple psychometric criteria simultaneously, we made use of Ant Colony Optimization. Thereby, we obtained balanced-keyed scales that cover the heterogeneous constructs well, showed good model fit and reliability across six samples from Germany and the U.K. (total N = 2,754), and achieved scalar measurement invariance across countries. Furthermore, we demonstrated each scale’s validity by locating the three core strengths in a nomological net with personality and value metatraits, life satisfaction, and behavioral criteria. Available in the public domain in English and German, these both valid and economical core strength scales may further stimulate integrative research on personality and values.
Introduction
When moral aspects of human behavior are of interest, researchers often focus on positive ethical traits such as character strengths and virtues (Fowers et al., Citation2021). Thereby, psychological researchers define character traits as measurable individual difference constructs representing desirable, positively valued traits that can be acquired or developed through personal and institutional practice or training, and they expect them to manifest in well-motivated, intentional, self- and other-benefitting behavior that people generally judge to be morally right (e.g., Fowers et al., Citation2021; Peterson & Seligman, Citation2004). Two decades ago, Peterson and Seligman (Citation2004) introduced a comprehensive list of 24 character traits which they referred to as character strengths or values in action (VIA). Examples of VIA character strengths are integrity, equity, kindness, forgiveness, gratitude, and perspective.
Locating them in a trait hierarchy, the 24 VIA character strengths are on a fine-grained level of abstraction similar to personality facets (McGrath et al., Citation2020; Partsch et al., Citation2022). That is, they are rather specific, narrow traits. However, we also require highly aggregated global VIA traits to understand how the VIA trait space is related to other trait spaces (e.g., the Big Five), to parsimoniously describe human character, to predict global outcomes, and to allow for economical measurement. Against this backdrop, Partsch et al. (Citation2022) conducted a comprehensive factor-analytic study into the hierarchy of the VIA trait space and identified three well-interpretable, cross-culturally replicable, global core strengths: positivity (i.e., the common core of the character strengths forgiveness, hope, zest, and capacity for love), dependability (prudence, modesty/humility, integrity, and equity), and mastery (judgment, originality, perspective, valor, leadership, and social intelligence).
However, there are no scales to directly measure these core strengths that would facilitate research on the global level of the VIA trait space. To exploit the core strengths’ potential for economical character measurement (i.e., to measure the character trait space with as few items as reasonable), researchers need to measure them with short scales. While saving questionnaire space and reducing response burden, scales with approximately six items usually allow a valid assessment of global personality constructs (e.g., Rammstedt et al., Citation2021; Soto & John, Citation2019). This is highly appealing in various research contexts, such as large-scale surveys, within-subject designs, and laboratory studies (as detailed by Soto & John, Citation2017). To obtain short scales of global constructs, researchers usually select items from longer or lower-level (e.g., facet-level) scales (e.g., Soto & John, Citation2017; Thalmayer & Saucier, Citation2014), which requires balancing several criteria, such as model fit, reliability, and item-keying. Item selection therefore represents a complex combinatorial problem, in which metaheuristic optimization algorithms, such as Ant Colony Optimization (ACO), generally outperform traditional manual or stepwise selection strategies that evaluate single items instead of item combinations (e.g., Olaru et al., Citation2019; Schroeders et al., Citation2016).
Against this backdrop, we developed three 6-item scales to measure the core strengths positivity, dependability, and mastery in a total of six samples from Germany and the U.K. (total N = 2,754) based on a 96-item public domain measure of the 24 VIA character strengths (the IPIP-VIA-R; Bluemke et al., Citation2021), which is currently available and validated in German and English. Thereby, we used ACO (e.g., Olaru et al., Citation2019) to optimize the item selection in terms of balanced keying, measurement model fit, factor saturation, and scalar measurement invariance. Furthermore, we evaluated the nomological network of the three core strengths and examined their criterion validity.
VIA—Theoretical classification and factor-analytic trait hierarchy
The building blocks of the VIA trait space are 24 character strengths, which are theoretically underpinned and empirically supported individual difference constructs intended for psychological measurement. The 24 character strengths resulted from a comprehensive collection of positive characteristics that Peterson and Seligman (Citation2004) subsequently winnowed based on different inclusion criteria (e.g., traits that are cross-culturally and morally valued, fulfilling for the self and others, and socially/institutionally cultivated).
Peterson and Seligman (Citation2004) classified the character strengths with a purely theoretical “Linnaean” classification approach by mapping them onto six more abstract, universally acknowledged core virtues (wisdom, courage, humanity, justice, temperance, and transcendence) based on common attributes (e.g., they mapped “cognitive strengths” such as creativity and curiosity onto the virtue of wisdom). A different approach to map specific traits onto global traits is to establish a factor-analytic trait hierarchy. Here, factor-analytic methods such as Goldberg’s (Citation2006) Bass-ackwards analysis determine the number and nature of global constructs that reside on more abstract levels in the trait hierarchy based on the empirical (co-)variation of the underlying more specific constructs.
Various factor-analytic approaches to aggregate the 24 character strengths were of varying methodological quality and yielded inconsistent results that ranged from anywhere between 1 and 6 global dimensions (for a detailed review see Partsch et al., Citation2022). However, several more recent studies clearly pointed to three global dimensions (especially McGrath, Citation2015, Citation2019; McGrath et al., Citation2018, Citation2022; McGrath & Wallace, Citation2021). McGrath and colleagues interpreted the three factors they identified as Caring (the common core of the character strengths equity, forgiveness, kindness, capacity for love, and citizenship/teamwork; supposed to capture interpersonal concern and virtuous action toward others), Inquisitiveness (the common core of creativity, curiosity, and love of learning; supposed to capture information seeking and virtuous action toward the self), and Self-Control (the common core of perseverance, prudence, and self-regulation; supposed to capture intrapersonal regulation and virtuous action toward the physical world) and referred to them as “three-virtue model”.
To further contribute to the establishment of the factor-analytic trait hierarchy, Partsch et al. (Citation2022) revisited the hierarchical structure of the 24 character strengths with a refined methodological approach. They scrutinized Levels I–VIII of the trait hierarchy that resulted from applying Goldberg’s Bass-ackwards analysis to data from large heterogeneous samples of respondents from Germany and the U.K. who completed a revised VIA inventory based on the IPIP (IPIP-VIA-R; Bluemke et al., Citation2021). They found that only Levels I–III consisted exclusively of well-interpretable, truly global (i.e., comprising at least three highly loading character strengths), and cross-culturally replicable dimensions. Thereby, Level III emerged as the most useful level of analysis in terms of interpretability, globality, and cross-cultural replicability (for details see Partsch et al., Citation2022). This level comprises the three global VIA dimensions or metatraits positivity, dependability, and mastery. Because these dimensions each summarize the common core of different character strengths, we will refer to them as the three core strengths in the remainder of this article. In , we illustrate the three core strengths and present both their marker strengths and related global constructs.
Table 1. The three core strengths constructs.
Despite some overlap, the three core strengths by Partsch et al. (Citation2022) and the three-virtue model (e.g., McGrath et al., Citation2018) represent different constructs. These differences result from different inputs and methodological choices in the factor analyses (PCA using the IPIP-VIA-R in Partsch et al. (Citation2022), versus, for example, PAF using the VIA-IS-R in McGrath & Wallace, Citation2021; and McGrath et al., Citation2022) and different interpretive rationales (abstracting the common core of the underlying character strengths following the factor-analytical logic in Partsch et al. (Citation2022), versus attempting to bring the three factors in line with common virtue concepts and other virtue theories as explained in McGrath et al., Citation2018).Footnote1
Measurement of the three core strengths
Our goal was to develop short scales that would allow an economical and essentially unidimensional assessment of the three core strengths in (large-scale) surveys and minimize idiosyncratic, systematic response biases (McCrae & Mõttus, Citation2019). To ensure adequate construct coverage, reliability, and validity at the same time, we have followed Soto and John (Citation2019) and opted for a scale length of six items per core strength. In doing so, each of the 4–6 marker strengths per core strength would be covered (displayed in ).
Ensuring good construct coverage
As per Partsch et al.’s (Citation2022) results, core strengths are each characterized by their cross-national, unique set of highly loading marker strengths that have loadings of λ ≥ .50 exclusively on the respective dimension in both Germany and the U.K. (see ). Thus, the three core strengths mainly represent the essence of 14 of the 24 VIA character strengths. The remaining 10 co-defining strengths (appreciation of beauty, citizenship/teamwork, curiosity, gratitude, humor, industriousness/perseverance, kindness, love of learning, self-regulation, and spirituality/religiousness) loaded |λ| ≥ .30 on at least one of the three core strengths in both countries (but never λ ≥ .50 on the single same dimension across Germany and the U.K., which defines the marker strengths).
From this we concluded that the co-defining strengths should not be completely neglected in the development of the three core strength scales, but the marker strengths should receive greater weight. We thus derived the following construction rationale: In a 6-item core strength scale, each of its 4–6 marker strengths is represented with at least one item. This ensures that the scales indeed capture the abstract constructs of positivity, dependability, and mastery. In addition, single items from co-defining strengths might lend themselves to complement the operationalization of these abstract constructs. In Figure S1, that we provide as Supplementary Online Material (SOM) on OSF (https://osf.io/pdntc/), we visualize how core strengths, character strengths, marker strengths, and co-defining strengths are related.
ACO—Simultaneously optimizing multiple psychometric properties
In addition to construct coverage or content validity, scales must satisfy psychometric criteria such as reliability, model fit, and measurement invariance across countries or languages. Identifying which combination of items best fulfills these multiple psychometric criteria is a complex combinatorial problem. We, therefore, used the item selection algorithm ACO to approach the optimal solution. Traditional (i.e., “manual”) approaches to item selection usually select or discard items in an isolated fashion (i.e., they disregard the interplay of items building a scale), thereby considering only few criteria, such as the size of an item’s factor loading or its impact on the scale’s Cronbach’s alpha. In contrast, ACO as algorithmic approach has the computational power to select numerous potential scales and evaluate each of them based on multiple psychometric criteria, including criteria that manual approaches usually do not use for item selection, such as measurement invariance across groups. Furthermore, due to its ability to learn from previous selections, ACO does not need to evaluate all possible item selections, thereby keeping its computational complexity manageable. As a result, ACO is much more likely to yield a close-to-optimal item selection than a manual selection of items for a scale from a (large) item pool (e.g., Olaru et al., Citation2019; Schroeders et al., Citation2016).
Previous studies (e.g., Jankowsky et al., Citation2020; Olaru & Danner, Citation2021; Olaru & Jankowsky, Citation2022) used ACO for short scale construction (i.e., selecting items from a long version of a scale to construct its short version). In short scale development each long scale represents the clearly defined item pool for the selection of the short scale. Contrariwise, the present item selection scenario (selecting items for newly identified VIA metatraits) is more complex because the items from the co-defining strengths cannot be uniquely assigned for the selection of a single core strength scale. We therefore expanded the ACO algorithm by a new item sampling feature that allows ACO to choose items from co-defining strengths for different scales.
The nomological net of the three core strengths
Based on content-analytical reasoning, Partsch et al. (Citation2022) identified various related metatraits of the three core strengths (see ), among others the two metatraits from the Big Five framework Stability and Plasticity (DeYoung, Citation2006; DeYoung et al., Citation2002). Whereas Stability expresses the common core of Agreeableness (i.e., stable social relationships), Conscientiousness (i.e., stable goal pursuit), and Emotional Stability (i.e., absence of negative affect), Plasticity expresses the common core of Extraversion and Open-Mindedness—namely, a flexible, explorative, and positive affective approach to the world. While Stability facilitates social integration, Plasticity facilitates personal growth. Previous research showed that single character traits are usually related to various basic personality traits (e.g., Bluemke et al., Citation2021; McGrath et al., Citation2020). Thus, for scale validation, it can be feasible to expect associations of different size between a (personality) metatrait and the three core strengths. Based on Partsch et al. (Citation2022) and further content-analytical reasoning, we assumed the strongest positive association between Stability and dependability, and the strongest (second-strongest) positive association between Plasticity and mastery (positivity).
As value-laden personality traits, character traits reside at the intersection of basic personality traits and basic human values (Bluemke et al., Citation2021). Thus, in addition to the related constructs presented in , core strengths can be meaningfully related to the metatraits social growth orientation and personal growth orientation from the basic human values framework (Rudnev et al., Citation2016; Schwartz, Citation1992, Citation2012). Social growth orientation and personal growth orientation both express the preference for anxiety-free growth values over anxiety-based self-protection values. Social growth orientation expresses the preference for self-transcendence values over self-enhancement values and represents an approach- and growth-oriented regulation of one’s interpersonal relationships, in which one transcends selfish interests and enhances others. Personal growth orientation expresses the preference for openness to change over conservation and represents an approach- and growth-oriented regulation of one’s personal interests and characteristics, which involves striving for a thrill of pleasure, novelty, and mastery. Based on content-analytical reasoning, we assumed the strongest (second-strongest) positive association(s) between social growth orientation and dependability (positivity and mastery), the strongest (second-strongest) positive association between personal growth orientation and mastery (positivity), and the strongest negative association between personal growth orientation and dependability.
As character traits per definition facilitate self- and other-benefitting behavior and promote the “good life” (e.g., Peterson & Seligman, Citation2004), life satisfaction is a key outcome. Based on previous research (Bluemke et al., Citation2021; Park et al., Citation2004; Proyer et al., Citation2011; Ruch et al., Citation2007; Weber et al., Citation2013), we assumed the strongest (second-strongest) positive association between life satisfaction and positivity (mastery). Furthermore, as “values in action”, character traits are associated with (value-driven) behavior (Lavy & Benish-Weisman, Citation2021). Therefore, we assumed associations between the three core strengths and various self-reported behaviors. We present these hypotheses, alongside with those outlined above, in the pre-registration form available on OSF.
The present study
To summarize, we developed and validated an 18-item inventory in English and German to measure three global core strengths based on the public domain IPIP-VIA-R inventory (Bluemke et al., Citation2021), which is based on the IPIP (Goldberg et al., Citation2006). We approached the combinatorial problem of selecting the most suitable 18 out of 96 items with an ACO algorithm (Olaru et al., Citation2019; Schroeders et al., Citation2016). To assess the robustness of our results, we used six heterogeneous samples from three data collections each conducted in Germany and the U.K., allowing for extensive cross-validation and built-in replication.
We developed the scales in three steps. In the first step, we fed data from the first data collection (samples 1 and 2, hereinafter referred to as training samples) into the ACO algorithm to select a set of 18 items (i.e., six per scale) that would approach maximum construct representation, balanced keying, measurement model fit, factor saturation, and measurement invariance across Germany and the U.K. In the second step, we reexamined the psychometric properties of the ACO item selection based on data from the second data collection (samples 3 and 4, hereinafter referred to as validation samples) to check if the item selection optimized based on the training samples can be generalized and does not represent a sample-specific, thus overfitted selection (Olaru et al., Citation2019). In the third step, we used data from our third data collection (samples 5 and 6, hereinafter referred to as use-case samples) to examine whether the scales maintain their psychometric properties when administered as an independent 18-item inventory instead of being embedded in the original item-pool of 96 items (as recommended by Smith et al., Citation2000).
To validate the newly developed scales, we located them in the nomological net of the Big Five metatraits Plasticity and Stability (DeYoung, Citation2006; DeYoung et al., Citation2002) and the metatraits abstracted from Schwartz’ (Citation1992, Citation1994) theory of basic human values (i.e., social growth orientation and personal growth orientation; Rudnev et al., Citation2016; Schwartz, Citation1992, Citation2012). Furthermore, we looked at the association of the three core strengths with several criteria: general life satisfaction and various behavioral correlates.
Method
Open data & material
We provide the complete data and R code including a renv-lockfile for reproducibility (Ushey, Citation2020) on OSF. We conducted all analyses in R (version 4.0.2; R Core Team, Citation2019).
Data
We used data from six samples from Germany (samples 1, 3, and 5) and the U.K. (samples 2, 4, and 6). We collected the training samples (i.e., samples 1 & 2) in 2018, the validation samples (i.e., samples 3 & 4) in 2019, and the use-case samples (i.e., samples 5 & 6) in 2021. For each data collection, we contracted the commercial online access panel provider respondi AG. For Germany, we drew quota samples based on gender, age, and education (obtained from Census 2011 for the surveys of 2018 and 2019 and from Census 2017 for the survey of 2021, respectively). For the U.K., we drew parallel samples. In each data collection, we invited a subsample of the main survey to a retest survey 2–3 weeks after completion of the main survey. To ensure data quality, we excluded careless responders separately per sample 1–6. Respondents were flagged as careless responders if they fell within the upper 2.5% of the sample distribution of the Mahalanobis distance, or the lower 5% of the sample distribution of the ipsatized variance, or if their average response time per item was ≤ 1 s (see Partsch et al. (Citation2022), for the rationale of this data exclusion). In , we report both the characteristics of all analysis samples 1–6 (i.e., after case exclusion) and the sizes of all six samples before and after case exclusion and in the retest. Furthermore, we provide an overview of information on and use of the six samples in Table S1 as SOM on OSF. With N ≥ 420, we deemed our analysis samples of suitable size for all our analyses (e.g., prevention of overfitting in ACO item selection, adequate for measurement invariance testing; Chen, Citation2007; Olaru et al., Citation2019).
Table 2. Sample characteristics of samples 1–6.
Missing data were negligible in the first and second data collection (i.e., samples 1–4) ranging between 0.00–0.60% across all items from VIA and validation scales. In the third data collection (i.e., samples 5–6), we applied a 3-form planned missingness design (3 F-PMD; Graham et al., Citation1996, Citation2006) to reduce response burden given the large number of administered scales. Thus, we prepared three questionnaire forms each containing only two thirds of the items of several instruments and randomly assigned one of these forms to each respondent. In 3 F-PMD, the items are assigned to questionnaire forms in such a way that half of the presented items overlap with one of the other forms, while the other half overlaps with the other. From the newly developed core strength scales, we presented two of three scales to each form. Introducing missings completely at random (MCAR) and in a way that missing information can be drawn from the other two forms, the 3 F-PMD allows conducting analyses with full information maximum likelihood (FIML). Except for the estimation of the test–retest correlations (rtt), we conducted all analyses using FIML.
Measures
All scales were available both in English and in German, so that respondents from the U.K. and the German samples were presented the items in their respective mother tongue.
VIA item pool
We developed the three core strength scales based on the IPIP-VIA-R inventory. As detailed in Bluemke et al. (Citation2021), the IPIP-VIA-R was developed based on the original English-language IPIP-VIA and translated to German based on the TRAPD approach by Harkness (Citation2003). The 96 items measure each of the 24 character strengths (Peterson & Seligman, Citation2004) with two positively and two negatively keyed items on a fully labeled 5-point rating scale ranging from “does not apply at all” to “applies completely”.
Personality metatraits
We measured Stability and Plasticity (DeYoung, Citation2006; DeYoung et al., Citation2002) with the BFI-2-XS (Rammstedt et al., Citation2020; Soto & John, Citation2017). The 15 items measure each Big Five dimension with three items (i.e., one from each facet), of which one or two are negatively keyed, on a 5-point rating scale ranging from “strongly disagree” to “strongly agree”. We administered the BFI-2-XS in the validation samples. We computed Stability scores as unit-weighted means of the Agreeableness, Conscientiousness, and Emotional Stability (i.e., recoded Negative Emotionality) items and Plasticity scores as unit-weighted means of the Extraversion and the Open-Mindedness items. The internal consistencies of the scores were αGermany = .70/αU.K. = .73 for Stability and αGermany = .59/αU.K. = .58 for Plasticity.
Value metatraits
We measured social growth orientation and personal growth orientation (Rudnev et al., Citation2016; Schwartz, Citation1992, Citation2012) based on the 21-item version of the Portrait Values Questionnaire (PVQ-21; Schmidt et al., Citation2007; Schwartz, Citation2003). The PVQ-21 measures each of the ten basic human values with 2–3 items on a 6-point rating scale ranging from “very much like me” to “not like me at all” (including the response option “don’t know”). We administered the PVQ-21 in the validation samples. Following the approach described on ESS EduNet (n.d.), we subtracted the self-enhancement scores (i.e., unit-weighted mean score of power and achievement items with αGermany = .77 and αU.K. = .79) from the self-transcendence scores (i.e., unit-weighted mean score of universalism and benevolence items with αGermany = .81 and αU.K. = .79) to compute social growth orientation scores. To compute personal growth orientation scores, we subtracted the conservation scores (i.e., unit-weighted mean score of conformity, tradition, and security items with αGermany = .68 and αU.K. = .74) from the openness to change scores (i.e., unit-weighted mean score of hedonism, stimulation, and self-direction items with αGermany = .77 and αU.K. = .75).
General life satisfaction
To assess respondents’ global evaluation of their subjective well-being (Diener, Citation1984), we used the single-item L-1 scale (Beierlein et al., Citation2015; Nießen et al., Citation2020). We administered the L-1 in the use-case samples, applying an 11-point rating scale ranging from “not at all satisfied” to “completely satisfied”.
Behavioral correlates
We used 22 items from a newly developed battery of behavioral correlates that measures the frequency of various behaviors. We bundled the single items into seven thematic behavioral clusters (see and on OSF). The behavioral items are inspired by the behaviors presented in Schwartz (Citation2015; Table 3) and can be connected to different underlying basic human values. Accordingly, based on Schwartz’ (Citation2015) empirical results or theoretical reasoning, we allocated the seven thematic behavioral clusters in Schwartz’ value circle (e.g., Schwartz, Citation1994): (1) self-enhancing behaviors (primarily motivated by the basic human value of power), (2) risk-taking behaviors (hedonism and stimulation), (3) personal growth behaviors (self-direction), (4) activism and civil courage behaviors (self-direction and universalism), (5) sustainable behaviors (universalism), (6) charitable behaviors (universalism and benevolence), and (7) provision-making behaviors (security). We presented the items to the use-case samples with a 5-point scale ranging from “never” to “very often” (including the option “prefer not to say”).
Table 3. Items of the three core strength scales.
Statistical analyses
Scale development
In the first step, we used ACO to select 18 (i.e., six items per core strength) out of 96 IPIP-VIA-R items based on the training samples. In a nutshell, ACO selects and evaluates several item combinations (in this case 18-item models) based on user-given optimization criteria (e.g., model fit). Over the course of several iterations, ACO learns which items are best suited to maximize the given optimization criteria and will return a (close-to-)optimal solution without requiring an estimation of all possible item combinations (for detailed information, see Olaru et al., Citation2019; Schroeders et al., Citation2016). In the following, we describe the properties of the item selection used in this study, namely (a) the measurement model, (b) the item sampling procedure, (c) the optimization criteria, and (d) the ACO parameter settings.
Measurement model
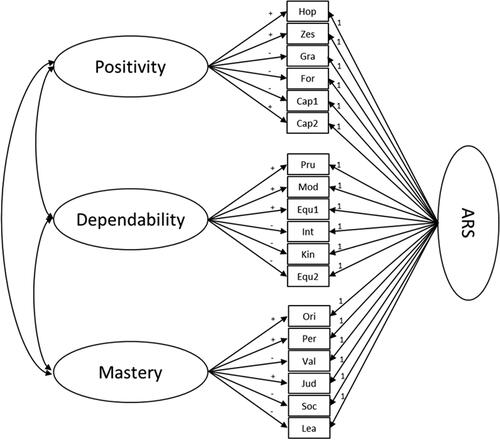
As measurement model, we specified a correlated first-order factor model (Brunner et al., Citation2012) with three factors representing the three core strengths. In addition, we included a method factor capturing acquiescent response style (ARS), also known as “yeah-saying”, that is, the tendency to agree to survey items independent of their content and keying (Jackson & Messick, Citation1958). All items loaded on the ARS factor with these loadings fixed to 1 (for both positively and non-recoded negatively keyed items) and the factor variance freely estimated. illustrates the measurement model. We used multi-group CFA to test measurement invariance across countries (i.e., Germany and the U.K.). More specifically, we compared the configural (i.e., no parameter constraints across groups), the metric (i.e., equal factor loadings across groups) and the scalar measurement invariance level (i.e., equal factor loadings and item intercepts across groups). We estimated all models with robust maximum likelihood (MLR) estimation using the R-package lavaan (version 0.6–7; Rosseel, Citation2012).
Figure 1. Measurement model of the three core strength scales. ARS = acquiescent response style. Items corresponding to the item labels in the boxes can be found in . +/− signs indicate item keying and positive/negative factor loading, respectively. Loadings of acquiescence factor were fixed to 1.
Item sampling
In previous studies that used ACO for item selection, all items from the item pool were uniquely assigned to one factor for which ACO could select them (e.g., Olaru & Danner, Citation2021; Olaru & Jankowsky, Citation2022). In the present study, we applied this logic to the 56 marker strengths items. That is, we preset that ACO could select items measuring forgiveness, zest, hope, and capacity for love (i.e., the marker strengths of positivity) only for the positivity factor. Likewise, we preset that ACO could select items measuring prudence, modesty/humility, integrity, and equity (i.e., the marker strengths of dependability) only for the dependability factor, and items measuring judgment, originality, perspective, valor, leadership, and social intelligence (i.e., the marker strengths of mastery) only for the mastery factor.
For each item selection, ACO had to draw at least one item of each marker strength. That is, four out of six items of the positivity and dependability scale, respectively, and (all) six items of the mastery scale, were marker items. In this way, we made sure that each of the three scales would measure its core strength’s definitional core. Selecting six items per scale allowed to choose two more items for both the positivity and the dependability scale. Here, ACO was free to select items from either the core strength’s marker strengths or from the co-defining strengths, while optimizing the criteria outlined below. That is, we let ACO decide empirically whether any of the co-defining items lend themselves as indicators of positivity or dependability—and if so, which ones did. ACO was not allowed to choose items from the same co-defining strength for different factors.
Optimization criteria
Within the set measurement model and sampling procedure, ACO approached the optimal item selection by maximizing the criteria described below. We scaled all criteria to a range from 0 (minimum) to 1 (maximum) to ensure that ACO weighted them equally. For that purpose, we transformed the criterion for balanced keying with an exponential function and all other criteria with a logistic function with turning point at the critical cutoff (see R script on OSF for exact transformations; see Olaru et al., Citation2019 for an illustration of the criterion transformation). We computed the unit-weighted mean across the transformed criteria to obtain the overall optimization index.
Balanced keying
This optimization criterion attained its minimum value of 0 when the item selection resulted in three fully unbalanced scales (i.e., each scale consisted of six either positively or negatively keyed items), and its maximum value of 1 if three fully balanced-keyed scales resulted (i.e., if each scale consisted of three positively and three negatively keyed items).
Model fit
We optimized the fit of the scalar-invariant measurement model based on the comparative fit index (CFI) and the root mean squared error of approximation (RMSEA). Because good model fit does not require maximum values of CFI or RMSEA (i.e., CFI = 1.000 and RMSEA = 0.000), ACO aimed at reaching CFI ≥ .900 (as we expected medium-size factor loadings only that are generally associated with a smaller CFI; Moshagen & Auerswald, Citation2018) and RMSEA ≤ .060 (as recommended by Hu & Bentler, Citation1999).
Factor loadings
ACO simultaneously aimed at reaching standardized factor loadings of |λ| ≥ .30 (commonly used rule of thumb) and average variance extracted (AVE, i.e., average squared standardized factor loadings) of AVE ≥ .50 of each factor (as suggested by Fornell & Larcker, Citation1981).
Measurement invariance
To allow for cross-national comparisons, metric invariance is required; for mean-level comparisons, scalar invariance is required. We therefore aimed to obtain scales that reach scalar invariance across Germany and the U.K. ACO minimized the decrease in model fit between the metric-invariant and the scalar-invariant model. Thereby, it aimed at reaching ΔCFI(metric−scalar) < .010 (as recommended by Chen, Citation2007).
ACO parameter settings
Within each iteration, ACO compared 60 models, identified the best solution based on the overall optimization index, and increased the selection probability of the 18 items contained in the best solution by the overall optimization index. After each iteration, the selection probability of each item was reduced by 1% to decrease the probability that ill-suited items, that had been selected in the first iterations (i.e., the early learning phase), were re-selected in later iterations (“pheromone evaporation”). ACO aborted the search after 40 iterations that did not yield a new best solution. Because ACO is a probabilistic item selection approach that might not always find the best possible solution, we ran ACO ten times with different random number generator seeds.
To choose the best item selection, we looked at each best solution of all ten ACO runs (we present them all as SOM on OSF). We chose the solution with the 5th best overall optimization index as final core strength scales. This solution considerably overlapped with those from the four ACO runs yielding slightly higher overall optimization indices but outperformed them in terms of construct representation and (low) factor correlations (i.e., criteria not optimized by ACO). To ensure the robustness of our results, we then evaluated the final item selection based on the validation samples and the use-case samples.
Scale validation
To validate the newly developed core strength scales, we first looked at their associations with Stability and Plasticity—the two metatraits from the Big Five framework (DeYoung, Citation2006; DeYoung et al., Citation2002). (Additionally, we provide an overview of the nomological net of the three core strengths and the Big Five on OSF.) Second, we looked at the associations between the three core strength scales and social growth orientation and personal growth orientation—the two metatraits from the basic human values framework (Rudnev et al., Citation2016; Schwartz, Citation1992, Citation2012). Third, we looked at the associations between the three core strength scales and several criteria: general life satisfaction and different behavioral clusters that are based on Schwartz’ theory of basic human values (e.g., Schwartz, Citation1994).
To test our hypotheses, we looked at the correlations between the variables of interest in multi-group SEM models estimated with MLR. In each SEM model, we included the scalar invariant measurement model of the three core strength scales and the manifest scale score of one or several validation constructs or criteria. In the first model, we tested our validation hypotheses for Stability, Plasticity, social growth orientation, and personal growth orientation based on the validation samples. In the second model, we tested our hypotheses for general life satisfaction based on the use-case samples. Furthermore, we tested our hypotheses for the behavioral correlates based on both seven behavioral cluster scores and always the single behaviors these clusters consisted of in separate models (i.e., 14 models in total) based on the use-case samples. To handle the missing data from the 3 F-PMD in the use-case samples, we included the seven behavioral clusters with pseudo-indicator models as manifest model-based composite scores in the SEM model (Rose et al., Citation2019).
Results
Scale development
In , we present the final 18-item solution in German and English that we chose to measure positivity, dependability, and mastery. In , we present their standardized factor loadings and factor correlations from the multi-group first-order factor model (including an acquiescence factor) in the training, validation, and use-case samples. In , we present the corresponding model fit indices, measurement invariance tests, and both the scales’ composite reliabilities and test–retest correlations (i.e., in both countries). In Table S2a–c of the SOM, we present the zero-order correlations of the 18 items and their mean vectors in the training, validation, and use-case samples.
Table 4. Standardized factor loadings and factor correlations.
Table 5. Model and scale evaluation.
The final item selection measures each of the three core strengths with balanced-keyed scales and good construct representation. That is, all 14 marker strengths are represented in their respective core strength, two of them with two items (capacity for love and equity). In addition, two co-defining strengths are represented with one item each. Thereby, the two selected items from the co-defining strengths gratitude and kindness lent themselves well to operationalize the global constructs of positivity and dependability: The negatively keyed gratitude item (“Find few things in my life to be grateful for.”) expresses a negative interpretation of situations or events—thus people scoring high on positivity tend to disagree with it. Likewise, the negatively keyed kindness item (“Get impatient when others talk to me about their problems.”) indicates that a person is not a dependable, considerate contact for others—thus people scoring high on dependability tend to disagree with it.
Model and scale evaluation in the training samples
In the training samples (i.e., samples 1 and 2) used for item selection, measurement invariance tests based on ΔCFI, ΔRMSEA, ΔSRMR, and ΔBIC between both the configural and metric model and the metric and scalar model endorsed accepting scalar invariance. The scalar invariant measurement model itself showed good fit ().Footnote2 Standardized loadings on the core strength factors ranged between .33 ≤ |λ| ≤ .66 in Germany (sample 1) and between .35 ≤ |λ| ≤ .62 in the U.K. (sample 2; ). Standardized loadings on the acquiescence factor were on average .23 in Germany but .35 in the U.K., which may reflect cultural differences in acquiescence (associated with different social norms, see Lechner et al., Citation2019). Factor correlations were on average .61 in Germany (ranging between .55–.64) and .75 in the U.K. (ranging between .69–.78), showing that the latent factors were related but discriminable. McDonald’s ω ranged between .63–.73 in Germany and between .66–.73 in the U.K., showing satisfactory composite reliability for heterogenous scales measuring global constructs. Additionally, we computed rtt coefficients based on a 2–3 weeks test–retest interval as important complementing information on the reliability of the scale scores, especially for short heterogeneous scales (e.g., McCrae et al., Citation2011). Rtt ranged between .72–.79 in Germany and between .65–.73 in the U.K., respectively.
Model and scale evaluation in the validation samples
In the validation samples (i.e., samples 3 and 4), based on which ACO checks the degree of generality of the quality of its item selection, we largely replicated the findings based on the training samples. Overall, factor loadings (), model fit, measurement invariance, and reliability coefficients () were similar to the findings in the training samples. There were only few minor exceptions: First, CFI of the scalar model (.899) and ΔCFI (−.014 and −.015 for metric and scalar measurement invariance, respectively) deviated slightly from the applied cutoffs and their values in the training samples. However, the deviation of the CFI was negligible. Furthermore, we can still accept scalar measurement invariance, because both ΔRMSEA and ΔSRMR did not exceed their critical cutoffs (Chen, Citation2007) and decreases in BIC from both the configural to the metric and from the metric to the scalar model were > 10. Second, the loadings on dependability of the prudence and the modesty/humility item in the validation samples (.26 ≤ λ ≤ .30) were slightly lower than in the training samples (.33 ≤ λ ≤ .39; see )—also leveling down reliability (both ω and rtt) of the dependability scale in both Germany and the U.K.
Model and scale evaluation in the use-case samples
In the use-case samples (i.e., samples 5 and 6), to which we presented the final three 6-item core strength scales only (instead of all 96 IPIP-VIA-R items), we also largely replicated the good psychometric properties of the training samples. As in the validation samples, ΔCFI values were greater than in the training samples and exceeded the cutoff of −.010 (ΔCFI = −.013 and −.021 for metric and scalar measurement invariance, respectively, in the use-case samples; see ), but again ΔRMSEA, ΔSRMR, and ΔBIC values clearly supported scalar measurement invariance. Unlike in the validation samples, the dependability scale showed good factor saturation in the use-case samples (i.e., .39 ≤ |λ| ≤ .68 across both countries and all reliability coefficients ≥ .70; see and ). However, the gratitude item of the positivity scale had a small loading in the use-case samples (cross-country average λ = −.22). The reliability of the three scales was again good in the use-case samples: Apart from slightly lower ωs of the positivity scale and the mastery scale in Germany (compared to those in the training and validation samples), all ω and rtt coefficients were (highly) satisfactory ranging between .68–.81. Furthermore, the factor correlations were on average lower in the use-case samples (.47 ≤ rGermany ≤ .70; .43 ≤ rU.K. ≤ .79).
Scale validation
We present the correlations between the three core strength scales and the various validation constructs and criteria in , including whether they supported our hypotheses. In addition, we visualized a summary of the results in Figure S2 on OSF. In general, results were consistent across countries: Hypothesis testing yielded different results in Germany and the U.K. only in six out of 44 instances. Measured against Gignac and Szodorai’s (Citation2016) meta-analytic classification of small (r = .10), typical (r = .20), and relatively large (r = .30) effects, the effects we identified were substantial: Taking into account all statistically significant effects (i.e., p < .05), their average absolute size was || = .31 (ranging between .13 ≤ |r| ≤ .76) in Germany and |
| = .35 (ranging between .14 ≤ |r| ≤ .77) in the U.K.
Table 6. Correlations between three core strength scales and validation constructs and criteria.
Looking at the nomological nets with Stability, Plasticity, social growth orientation, personal growth orientation, and general life satisfaction, all hypotheses were accurate except for the one regarding Stability and some regarding personal growth orientation. Stability correlated most strongly with positivity—instead of with dependability—and had the second-strongest correlations with both dependability and mastery (expressing the degree to which the three core strengths involve relationship, motivational, and emotional stability). In line with our expectations, Plasticity was most strongly positively correlated with mastery (expressing their common function to facilitate a flexible reaction to changes and integration of new information) and had the second-strongest positive correlation with positivity (expressing their common function to facilitate positive affectivity). In addition, Plasticity showed comparatively weak positive correlations with dependability.
Regarding the higher-order values, social growth orientation was most strongly positively correlated with dependability and had the second-strongest positive correlation with both positivity and mastery (expressing the degree to which each core strength motivates to transcend selfish interests and enhance others). Personal growth orientation was most strongly negatively correlated with dependability in both countries (expressing the personal costs that come with the benefits of dependability for others). Furthermore, personal growth orientation was most strongly positively correlated with mastery in the U.K. (as expected) and with positivity in Germany (expressing the degree to which these core strengths involve a striving for mastery, novelty, or a thrill of pleasure). In line with our expectations, general life satisfaction was most strongly positively correlated with positivity and had the second-strongest positive correlation with mastery across countries.
The three core strength scales showed several of the expected and some unexpected correlations with the seven behavioral clusters and their items, respectively. The rather egocentric (1) self-enhancing and (2) risk-taking behaviors showed many negative correlations with all socially beneficial core strengths. In line with our expectations, those with dependability were strongest. (3) Only in Germany, personal growth behaviors were positively correlated with either positivity or, as expected, mastery (which may reflect the personal growth orientation expressed by both the core strengths and behaviors). (4) Only in Germany, the civil courage behavior “Intervening when a stranger is treated unfairly”, showed positive correlations with both dependability (likely attributable to the common civil-aspect) and, as expected, mastery (likely attributable to the common courage-aspect). Contrary to expectations, the two activism items were either not at all or negatively correlated with all core strengths in both countries. (5) Sustainable behaviors showed some positive correlations with all core strengths that, expectedly, tended to be strongest with dependability (which may reflect the social growth orientation expressed by both the core strengths and behaviors). (6) Charitable behaviors were positively correlated with positivity in Germany. The positivity facets gratitude and capacity for love may have driven these correlations (e.g., donating as reaction to gratitude for own privileges and awareness of being cared for). Contrary to expectations, charitable behaviors were not correlated with dependability. (7) Finally, the expected positive correlations between provision-making behaviors and dependability were not confirmed—we found either non-significant or negative correlations.
Discussion
Measurement of the VIA trait space has so far mainly focused on the 24 character strengths (Bluemke et al., Citation2021; McGrath et al., Citation2022), which have a similar level of abstraction as personality facets. By contrast, measures of factor-analytically determined global VIA traits have long been in short supply (with the sole exception being the VIA-IS-V3 scales provided by the VIA Institute on Character upon registration that measure the three dimensions Caring, Inquisitiveness, and Self-Control; McGrath, Citation2019).
To facilitate research on the global level of the VIA trait space, we developed and validated scales measuring the three well-interpretable, truly global, and cross-culturally replicable VIA dimensions positivity, dependability, and mastery that Partsch et al. (Citation2022) established in their factor-analytic study. To obtain both economical and valid scales, we selected six items for each short scale from a refined public domain VIA instrument, the 96-item IPIP-VIA-R (Bluemke et al., Citation2021). To simultaneously optimize multiple psychometric criteria in our item selection, we made use of an ACO algorithm.
The core strength scales show good psychometric properties across samples
Using ACO, we selected three 6-item scales, that (1) represented the heterogeneity of the core strengths well, (2) were balanced-keyed to allow for acquiescence control by building unit-weighted manifest scale scores or modeling an acquiescence factor in a latent measurement model (Billiet & McClendon, Citation2000), (3) showed good model fit or factorial validity, and (4) were scalar measurement invariant across Germany and the U.K., allowing scale users to compare the latent means across countries. Further, the scales (5) represented distinct factors (i.e., factor correlations r < .80) that (6) showed good factor saturation (i.e., |λ| > .30) and (7) exhibited proper composite reliabilities as well as test–retest correlations of the manifest scale scores, especially given the high efficiency and heterogeneity of the scales (i.e., both ω and rtt > .60). These reliability coefficients were also comparable with reliability coefficients of scales measuring global constructs reported in the literature (see Caprara et al., Citation2012; Rammstedt et al., Citation2021; Thalmayer & Saucier, Citation2014) and allow scale users to calculate manifest scale scores for analyses on the group level (i.e., research but not diagnostic purposes) as this is common practice. Except for minor fluctuations, we reproduced these highly satisfactory psychometric properties in four independent samples collected one (i.e., the validation samples) and almost three years later (i.e., the use-case samples). In the use-case samples, we demonstrated that the newly developed scales also perform when administered in isolation in their final form outside of the original IPIP-VIA-R item pool.
Two findings are in need of explanation. First, the weak loading of the gratitude item in the use-case samples begs the question if this item from a co-defining strength might not work in final scale use. However, some sampling variation in factor loadings is, of course, expected and this particular finding might also be a temporary effect of the COVID-19 pandemic: It is reminiscent of a finding by Allemand et al. (Citation2021), who showed lower correlations between gratitude and a positive outlook on one’s own future in 2020 compared to the pre-pandemic year 2018. Second, the correlations between the three core strengths were substantial (.43 ≤ r ≤ .79 across all samples even when controlling for acquiescence). Although positive correlations between the three strengths are not unexpected, the size of these correlations might be inflated because we used only single-informant ratings. Previous research reported similar findings for personality metatrait scales. DeYoung (Citation2006) and DeYoung et al. (Citation2002) reported substantial correlations between latent Stability and Plasticity factors from CFA or SEM models based on single-informant ratings up to r = .53 that vanished in models controlling for specific rater variance (via a multi-informant approach; DeYoung, Citation2006). A multi-informant approach would likely also lower the factor correlations between the three core strengths. However, we would not expect them to completely vanish, because they likely arise from a substantive VIA g-factor (see also Partsch et al., Citation2022). As all VIA traits are socially desirable, people who generally adapt successfully to their (social) environment, tend to score higher on all three core strengths. Furthermore, people likely differ in their expectations regarding (good) character—while some impose generally low/mild standards when evaluating themselves (or others) by the core strength scales, others impose generally high/rigid standards.
Evidence for the validity and distinctness of the three core strength scales
Overall, the nomological nets with metatraits from personality and value frameworks, general life satisfaction, and a broad range of value-related behaviors supported the construct and criterion validity of each of the three scales. At the same time, correlations did not exceed .77, corroborating that the three core strengths are no replicas of the existing metatraits but distinct constructs. Furthermore, the distinct, meaningful correlation pattern for each scale also underscored the distinct nature of each of the three global VIA constructs. Most of the findings were robust across Germany and the U.K. Deviations between countries appeared mainly in the nomological net with the behavioral correlates, whereby effects in the German sample were not replicated in the U.K. sample, attesting to the slightly stronger criterion validity of the three core strength scales in the German compared to the U.K. samples.
Building on DeYoung et al. (Citation2002), who showed that Stability—but not Plasticity—is positively associated with social desirability in terms of moral or conformist conduct, we assume that the high correlations of all three core strengths with Stability likely hail from the core strengths’ overlapping social and moral relevance, thereby underscoring the convergent validity of our scales. The relatively small correlations between dependability and Plasticity provide evidence for discriminant validity. Furthermore, the correlation pattern with social and personal growth orientation showed both convergent and discriminant validity of the scales: Each core strength correlated more strongly with social growth orientation than with personal growth orientation, corroborating that all three core strengths are primarily socially beneficial. Whereas dependability as most socially relevant core strength even comes with small personal costs, positivity and mastery are also somewhat beneficial for the self. This is in line with the claim that “[a character] strength contributes to various fulfillments that constitute the good life, for oneself and for others. […]” (Peterson & Seligman, Citation2004; p. 17).
Regarding criterion validity, our results are in line with previous research that showed positive correlations between life satisfaction and most or all the 24 character strengths. In previous studies, hope, gratitude, capacity for love, and zest (i.e., character strengths covered by positivity) ranged among the strongest and modesty/humility and prudence (i.e., covered by dependability) ranged among the weakest correlates of life satisfaction (Bluemke et al., Citation2021; Park et al., Citation2004; Proyer et al., Citation2011; Ruch et al., Citation2007; Weber et al., Citation2013).
Besides the cognitive appraisal of well-being, it is of particular interest how the three core strengths are related to (self-reported) behavior. Previous research suggests that basic human values are important drivers of behaviors and that VIA traits (i.e., “values in action”) are mediators of these associations (Lavy & Benish-Weisman, Citation2021; Schwartz, Citation2015). Accordingly, we found several expected associations between the three core strengths and behaviors that were originally derived from different basic human values (see ). In line with our findings regarding the higher-order values, the three core strengths showed most and, on average, strongest positive (negative) associations with socially beneficial (unfavorable) behaviors (i.e., self-enhancing, risk-taking, and sustainable behaviors). We also obtained some unexpected results that can be explained by the complex motivational basis of single behaviors, that is, single behaviors can be motivated/driven by different, sometimes even opposing values (Lins De Holanda Coelho et al., Citation2021; Schwartz, Citation2015). Thus, if correlations between the three core strengths and behaviors turned out differently than expected, this is most likely because the mechanism that we assumed behind a hypothesized correlation was not its main driver. For example, instead of being positively correlated with mastery, thereby expressing the intention to give good advice to political decision makers, the activism behavior “contacting a politician, government or local government official” was negatively correlated with dependability, potentially expressing more of a power or social dominance motive. Likewise, the provision-making behavior “acquiring a new capital investment” showed a negative instead of a positive correlation with dependability—obviously, this behavior was not primarily driven by a provision-making motive (i.e., the value of security) but a motive that is potentially negatively associated with dependability, for example a power motive. Moreover, behavior is not solely determined by motives, values, and traits but also by habits, automatisms, or situational aspects.
Limitations and future directions for measuring the three core strengths
Even though our ACO-based scale development approach yielded three core strength scales with highly satisfactory and robust psychometric properties and strong evidence for validity, our present study has limitations that future research should address. First, our focus here was on Germany and the U.K. Future research should expand that focus by adapting the three scales for application in other, including non-WEIRD (i.e., white, educated, industrialized, rich, and democratic) cultures to test if scalar measurement invariance also holds across a more diverse set of countries and if the claim to universality of the 24 VIA character strengths can be generalized to the three global core strengths.
Second, researchers should apply the scales in multi-informant ratings to test if the psychometric properties generally replicate based on informant/observer ratings, how strongly self- and informant-rated core strengths are correlated (i.e., as rough indication of the role that socially desirable responding plays in the application of the scales; McCrae & Mõttus, Citation2019), and if the factor correlations decrease if latent core strength variables are based on multi-informant data (as DeYoung, Citation2006, demonstrated for Stability and Plasticity).
Third, future research should further expand the nomological network of the three core strength scales beyond what was possible in the present study. In particular, it would be instructive to look at the correlations between the three core strength scales and the positivity construct by Caprara et al. (Citation2012), Social Self-Regulation, Dynamism (i.e., the Big Two from the Big Six framework; Thalmayer & Saucier, Citation2014), and Caring, Inquisitiveness, and Self-Control from the three-virtue model (e.g., McGrath et al., Citation2018; McGrath & Wallace, Citation2021). Furthermore, it would be valuable to look at still more outcome associations, especially objective and informant-rated criteria to test criterion validity more rigorously.
Conclusion
By means of an ACO algorithm, we obtained three both economical and valid short scales of the global VIA core strengths positivity, dependability, and mastery (Partsch et al., Citation2022) in both German and English. We replicated the good psychometric quality of the scales—including their scalar measurement invariance across Germany and the U.K.—across six samples from three data collections. Consisting of IPIP items, these scales are the first for the measurement of global VIA traits that are accessible in the public domain. We hope they will stimulate both research advancing the understanding of the VIA trait space and applied character research warranting parsimonious measures of global character traits.
Open Scholarship
![]()
This article has earned the Center for Open Science badges for Open Data and Preregistered. The data and pre-registration are openly accessible at https://osf.io/pdntc/.
Ethics statement
Respondents consented to their participation in an anonymous online survey by clicking a button which indicated that they had read the consent information and agreed to participate. According to the local legislation and requirements of the institution, this study on human participants did not require review and approval by an ethics committee as we collected data without any reference to the participants’ identity. The data collection was completely anonymous. The purpose of the research—to investigate the quality of several questionnaires—was explained to all respondents. We adhered to ethical standards comparable to the 1964 Declaration of Helsinki.
Preprint
A previous version of this manuscript was informally published as:
Partsch, M. V., Olaru, G., & Lechner, C. M. (2022). Measuring global character dimensions: An ant colony optimization approach towards three core strengths scales. PsyArXiv. https://doi.org/10.31234/osf.io/tdjh4
Acknowledgment
The authors thank Manfred Schmitt (RPTU Kaiserslautern-Landau, Germany) for his valuable feedback on a previous version of this manuscript.
Disclosure statement
No potential conflict of interest was reported by the author(s).
Data availability statement
The data and analysis scripts used for this article can be accessed at https://osf.io/pdntc/.
Notes
1 Taking a closer look at the results of studies on the three-virtue model (i.e., McGrath, Citation2015, Citation2019; McGrath et al., Citation2018, Citation2022; McGrath & Wallace, Citation2021), one might consider the interpretation of the three global traits as Caring, Inquisitiveness, and Self-Control as somewhat constricted or inappropriate—given that these studies frequently yielded high loadings of spirituality on Caring or valor and leadership on Inquisitiveness, for example. Furthermore, it seems that the authors somewhat overemphasize the replicability of the three-virtue model across these studies. Most strikingly, while modesty/humility characterized Self-Control in McGrath et al. (Citation2018), it has its negative main loading on Inquisitiveness and thus represents as weakness of character in the three-virtue model in more recent studies based on the revised VIA-IS-R (McGrath et al., Citation2022; McGrath & Wallace, Citation2021).
2 Based on Chen (Citation2007), we would reject the scalar measurement invariance model, if ΔCFI(metric – configural) ≥ −.010 in combination with either ΔRMSEA(metric – configural) ≥ .015 or ΔSRMR(metric – configural) ≥ .030, and if ΔCFI(scalar – metric) ≥ −.010 in combination with either ΔRMSEA(scalar – metric) ≥ .015 or ΔSRMR(scalar – metric) ≥ .010, respectively. Furthermore, decreases in BIC (i.e., an increasing balance between model fit and parsimony) from the configural to the metric and from the metric to the scalar model larger than 10 provide very strong evidence to accept the scalar invariant model (based on Raftery, Citation1995). Moreover, we attest good model fit, if CFI ≥ .900, RMSEA ≤ .060, and SRMR ≤ .080 (as recommended by Hu & Bentler, Citation1999).
References
- Allemand, M., Olaru, G., & Hill, P. L. (2021). Gratitude and future time perspective during the COVID-19 pandemic: Effects of age and virus worry. The Journal of Positive Psychology, 17(6), 819–831. https://doi.org/10.1080/17439760.2021.1975156
- Bakan, D. (1966). The duality of human existence: An essay on psychology and religion. Rand Mcnally.
- Beierlein, C., Kovaleva, A., László, Z., Kemper, C. J., & Rammstedt, B. (2015). Kurzskala zur Erfassung der Allgemeinen Lebenszufriedenheit (L-1). Zusammenstellung sozialwissenschaftlicher Items und Skalen (ZIS). https://doi.org/10.6102/ZIS229
- Billiet, J. B., & McClendon, M. J. (2000). Modeling acquiescence in measurement models for two balanced sets of items. Structural Equation Modeling: A Multidisciplinary Journal, 7(4), 608–628. https://doi.org/10.1207/S15328007SEM0704_5
- Bluemke, M., Partsch, M. V., Saucier, G., & Lechner, C. M. (2021). Human character in the IPIP: Towards shorter, more content-valid, and cross-culturally comparable IPIP-VIA character strength scales. PsyArXiv. https://doi.org/10.31234/osf.io/k79qf
- Brunner, M., Nagy, G., & Wilhelm, O. (2012). A tutorial on hierarchically structured constructs. Journal of Personality, 80(4), 796–846. https://doi.org/10.1111/j.1467-6494.2011.00749.x
- Caprara, G. V., Alessandri, G., Eisenberg, N., Kupfer, A., Steca, P., Caprara, M. G., Yamaguchi, S., Fukuzawa, A., & Abela, J. (2012). The positivity scale. Psychological Assessment, 24(3), 701–712. https://doi.org/10.1037/a0026681
- Chen, F. F. (2007). Sensitivity of goodness of fit indexes to lack of measurement invariance. Structural Equation Modeling: A Multidisciplinary Journal, 14(3), 464–504. https://doi.org/10.1080/10705510701301834
- DeYoung, C. G. (2006). Higher-order factors of the Big Five in a multi-informant sample. Journal of Personality and Social Psychology, 91(6), 1138–1151. https://doi.org/10.1037/0022-3514.91.6.1138
- DeYoung, C. G., Peterson, J. B., & Higgins, D. M. (2002). Higher-order factors of the Big Five predict conformity: Are there neuroses of health? Personality and Individual Differences, 33(4), 533–552.(01)00171-4 https://doi.org/10.1016/S0191-8869
- Diener, E. D. (1984). Subjective well-being. Psychological Bulletin, 95(3), 542–575. https://doi.org/10.1037/0033-2909.95.3.542
- EduNet, E. S. S. (n.d.). Two dimensions. Retrieved October 1, 2021, from http://essedunet.nsd.uib.no/cms/topics/1/5/3.html
- Fornell, C., & Larcker, D. F. (1981). Evaluating structural equation models with unobservable variables and measurement error. Journal of Marketing Research, 18(1), 39–50. https://doi.org/10.2307/3151312
- Fowers, B. J., Carroll, J. S., Leonhardt, N. D., & Cokelet, B. (2021). The emerging science of virtue. Perspectives on Psychological Science : A Journal of the Association for Psychological Science, 16(1), 118–147. https://doi.org/10.1177/1745691620924473
- Gignac, G. E., & Szodorai, E. T. (2016). Effect size guidelines for individual differences researchers. Personality and Individual Differences, 102, 74–78. https://doi.org/10.1016/j.paid.2016.06.069
- Goldberg, L. R. (2006). Doing it all Bass-Ackwards: The development of hierarchical factor structures from the top down. Journal of Research in Personality, 40(4), 347–358. https://doi.org/10.1016/j.jrp.2006.01.001
- Goldberg, L. R., Johnson, J. A., Eber, H. W., Hogan, R., Ashton, M. C., Cloninger, C. R., & Gough, H. G. (2006). The international personality item pool and the future of public-domain personality measures. Journal of Research in Personality, 40(1), 84–96. https://doi.org/10.1016/j.jrp.2005.08.007
- Graham, J. W., Hofer, S. M., & MacKinnon, D. P. (1996). Maximizing the usefulness of data obtained with planned missing value patterns: An application of maximum likelihood procedures. Multivariate Behavioral Research, 31(2), 197–218. https://doi.org/10.1207/s15327906mbr3102_3
- Graham, J. W., Taylor, B. J., Olchowski, A. E., & Cumsille, P. E. (2006). Planned missing data designs in psychological research. Psychological Methods, 11(4), 323–343. https://doi.org/10.1037/1082-989X.11.4.323
- Harkness, J. (2003). Questionnaire translation. In J. Harkness, F. J. R. van de Vijver, & P. Ph. Mohler (Eds.), Cross-cultural survey methods (pp. 35–56). Wiley.
- Hu, L., & Bentler, P. M. (1999). Cutoff criteria for fit indexes in covariance structure analysis: Conventional criteria versus new alternatives. Structural Equation Modeling: A Multidisciplinary Journal, 6(1), 1–55. https://doi.org/10.1080/10705519909540118
- Jackson, D. N., & Messick, S. (1958). Content and style in personality assessment. Psychological Bulletin, 55(4), 243–252. https://doi.org/10.1037/h0045996
- Jankowsky, K., Olaru, G., & Schroeders, U. (2020). Compiling measurement invariant short scales in cross–cultural personality assessment using ant colony optimization. European Journal of Personality, 34(3), 470–485. https://doi.org/10.1002/per.2260
- Lavy, S., & Benish-Weisman, M. (2021). Character strengths as “Values in Action”: Linking character strengths with values theory – an exploratory study of the case of gratitude and self-transcendence. Frontiers in Psychology, 12, 576189. https://doi.org/10.3389/fpsyg.2021.576189
- Lechner, C. M., Partsch, M. V., Danner, D., & Rammstedt, B. (2019). Individual, situational, and cultural correlates of acquiescent responding: Towards a unified conceptual framework. The British Journal of Mathematical and Statistical Psychology, 72(3), 426–446. https://doi.org/10.1111/bmsp.12164
- Lins De Holanda Coelho, G., Hanel, P. H. P., Johansen, M. K., & Maio, G. R. (2021). Mental representations of values and behaviors. European Journal of Personality, 36(6), 926–941. https://doi.org/10.1177/08902070211034385
- McCrae, R. R., & Mõttus, R. (2019). What personality scales measure: A new psychometrics and its implications for theory and assessment. Current Directions in Psychological Science, 28(4), 415–420. https://doi.org/10.1177/0963721419849559
- McCrae, R. R., Kurtz, J. E., Yamagata, S., & Terracciano, A. (2011). Internal consistency, retest reliability, and their implications for personality scale validity. Personality and Social Psychology Review: An Official Journal of the Society for Personality and Social Psychology, Inc, 15(1), 28–50. https://doi.org/10.1177/1088868310366253
- McGrath, R. E. (2015). Integrating psychological and cultural perspectives on virtue: The hierarchical structure of character strengths. The Journal of Positive Psychology, 10(5), 407–424. https://doi.org/10.1080/17439760.2014.994222
- McGrath, R. E. (2019). Technical report: The VIA Assessment Suite for Adults: Development and initial evaluation (Rev ed.). VIA Institute on Character. https://www.viacharacter.org/pdf/Technical%20Report%20Revised%20Edition%202019_1.pdf
- McGrath, R. E., & Wallace, N. (2021). Cross-validation of the VIA Inventory of strengths-revised and its short forms. Journal of Personality Assessment, 103(1), 120–131. https://doi.org/10.1080/00223891.2019.1705465
- McGrath, R. E., Brown, M., Westrich, B., & Han, H. (2022). Representative sampling of the VIA Assessment Suite for Adults. Journal of Personality Assessment, 104(3), 380–394. https://doi.org/10.1080/00223891.2021.1955692
- McGrath, R. E., Greenberg, M. J., & Hall-Simmonds, A. (2018). Scarecrow, Tin Woodsman, and Cowardly Lion: The three-factor model of virtue. The Journal of Positive Psychology, 13(4), 373–392. https://doi.org/10.1080/17439760.2017.1326518
- McGrath, R. E., Hall-Simmonds, A., & Goldberg, L. R. (2020). Are measures of character and personality distinct? Evidence from observed-score and true-score analyses. Assessment, 27(1), 117–135. https://doi.org/10.1177/1073191117738047
- Moshagen, M., & Auerswald, M. (2018). On congruence and incongruence of measures of fit in structural equation modeling. Psychological Methods, 23(2), 318–336. https://doi.org/10.1037/met0000122
- Nießen, D., Groskurth, K., Rammstedt, B., & Lechner, C. M. (2020). An English-language adaptation of the General Life Satisfaction Short Scale (L-1). Zusammenstellung sozialwissenschaftlicher Items und Skalen (ZIS). https://doi.org/10.6102/zis284
- Olaru, G., & Danner, D. (2021). Developing cross-cultural short scales using ant colony optimization. Assessment, 28(1), 199–210. https://doi.org/10.1177/1073191120918026
- Olaru, G., & Jankowsky, K. (2022). The HEX-ACO-18: Developing an age-invariant HEXACO short scale using ant colony optimization. Journal of Personality Assessment, 104(4), 435–446. https://doi.org/10.1080/00223891.2021.1934480
- Olaru, G., Schroeders, U., Hartung, J., & Wilhelm, O. (2019). Ant colony optimization and local weighted structural equation modeling. A tutorial on novel item and person sampling procedures for personality research. European Journal of Personality, 33(3), 400–419. https://doi.org/10.1002/per.2195
- Park, N., Peterson, C., & Seligman, M. E. P. (2004). Strengths of character and well-being. Journal of Social and Clinical Psychology, 23(5), 603–619. https://doi.org/10.1521/jscp.23.5.603.50748
- Partsch, M. V., Bluemke, M., & Lechner, C. M. (2022). Revisiting the hierarchical structure of the 24 VIA character strengths: Three global dimensions may suffice to capture their essence. European Journal of Personality, 36(5), 825–845. https://doi.org/10.1177/08902070211017760
- Peterson, C., & Seligman, M. E. P. (2004). Character strengths and virtues: A handbook and classification. American Psychological Association.
- Proyer, R. T., Gander, F., Wyss, T., & Ruch, W. (2011). The relation of character strengths to past, present, and future life satisfaction among German-speaking women. Applied Psychology: Health and Well-Being, 3(3), 370–384. https://doi.org/10.1111/j.1758-0854.2011.01060.x
- R Core Team. (2019). R: A language and environment for statistical computing (Version 3.6.1) [Statistical software]. R Foundation for Statistical Computing. https://www.R-project.org/
- Raftery, A. E. (1995). Bayesian model selection in social research. Sociological Methodology, 25, 111–163. https://doi.org/10.2307/271063
- Rammstedt, B., Danner, D., Soto, C. J., & John, O. P. (2020). Validation of the short and extra-short forms of the Big Five Inventory-2 (BFI-2) and their German adaptations. European Journal of Psychological Assessment, 36(1), 149–161. https://doi.org/10.1027/1015-5759/a000481
- Rammstedt, B., Lechner, C. M., & Danner, D. (2021). Short forms do not fall short: A comparison of three (extra-)short forms of the Big Five. European Journal of Psychological Assessment, 37(1), 23–32. https://doi.org/10.1027/1015-5759/a000574
- Rose, N., Wagner, W., Mayer, A., & Nagengast, B. (2019). Model-based manifest and latent composite scores in structural equation models. Collabra: Psychology, 5(1), 9. https://doi.org/10.1525/collabra.143
- Rosseel, Y. (2012). lavaan: An R package for structural equation modeling. Journal of Statistical Software, 48(2), 1–36. https://doi.org/10.18637/jss.v048.i02
- Ruch, W., Huber, A., Beermann, U., & Proyer, R. T. (2007). Character strengths as predictors of the “good life” in Austria, Germany and Switzerland. In Romanian Academy - “George Barit” Department of Social Research (Ed.), Studies and researches in social sciences (pp. 123–131). Academia Română. https://doi.org/10.5167/uzh-3648
- Rudnev, M., Magun, V., & Schmidt, P. (2016). Basic human values: Stability of value typology in Europe. In M. Voicu, I. C. Mochmann, & H. Dülmer (Eds.), Values, economic crisis and democracy (1st ed., pp. 21–49). Routledge.
- Schmidt, P., Bamberg, S., Davidov, E., Herrmann, J., & Schwartz, S. H. (2007). Die Messung von Werten mit dem “Portraits Value Questionnaire” [The measurement of values with the “Portrait Value Questionnaire. Zeitschrift Für Sozialpsychologie, 38(4), 261–275. ]. https://doi.org/10.1024/0044-3514.38.4.261
- Schroeders, U., Wilhelm, O., & Olaru, G. (2016). Meta-heuristics in short scale construction: Ant colony optimization and genetic algorithm. PLoS One, 11(11), e0167110. https://doi.org/10.1371/journal.pone.0167110
- Schwartz, S. H. (1992). Universals in the content and structure of values: Theoretical advances and empirical tests in 20 countries. In M. P. Zanna (Ed.), Advances in experimental social psychology (Vol. 25, pp. 1–65). Academic Press.(08)60281-6 https://doi.org/10.1016/S0065-2601
- Schwartz, S. H. (1994). Are there universal aspects in the structure and contents of human values? Journal of Social Issues, 50(4), 19–45. https://doi.org/10.1111/j.1540-4560.1994.tb01196.x
- Schwartz, S. H. (2003). A proposal for measuring value orientations across nations. In Questionnaire development package of the European Social Survey (pp. 259–319). https://www.europeansocialsurvey.org/docs/methodology/core_ess_questionnaire/ESS_core_questionnaire_human_values.pdf
- Schwartz, S. H. (2012). An overview of the Schwartz theory of basic values. Online Readings in Psychology and Culture, 2(1), 11. Article https://doi.org/10.9707/2307-0919.1116
- Schwartz, S. H. (2015). Basic individual values: Sources and consequences. In T. Brosch & D. Sander (Eds.), Handbook of value: Perspectives from economics, neuroscience, philosophy, psychology and sociology (1st ed., pp. 63–84). Oxford University Press. https://doi.org/10.1093/acprof:Oso/9780198716600.003.0004
- Smith, G. T., McCarthy, D. M., & Anderson, K. G. (2000). On the sins of short-form development. Psychological Assessment, 12(1), 102–111. https://doi.org/10.1037/1040-3590.12.1.102
- Soto, C. J., & John, O. P. (2017). Short and extra-short forms of the Big Five Inventory-2: The BFI-2-S and BFI-2-XS. Journal of Research in Personality, 68, 69–81. https://doi.org/10.1016/j.jrp.2017.02.004
- Soto, C. J., & John, O. P. (2019). Optimizing the length, width, and balance of a personality scale: How do internal characteristics affect external validity? Psychological Assessment, 31(4), 444–459. https://doi.org/10.1037/pas0000586
- Thalmayer, A. G., & Saucier, G. (2014). The questionnaire Big Six in 26 nations: Developing cross–culturally applicable Big Six, Big Five and Big Two Inventories. European Journal of Personality, 28(5), 482–496. https://doi.org/10.1002/per.1969
- Ushey, K. (2020). renv: Project environments (Version 0.12.0) [R package]. https://CRAN.R-project.org/package=renv
- Weber, M., Ruch, W., Littman-Ovadia, H., Lavy, S., & Gai, O. (2013). Relationships among higher-order strengths factors, subjective well-being, and general self-efficacy – The case of Israeli adolescents. Personality and Individual Differences, 55(3), 322–327. https://doi.org/10.1016/j.paid.2013.03.006